
Technical Analysis
BTC/USDT
In the US, Fed Chairman John Williams’ cautious assessments regarding the health of inflation data indicate that the cautious stance in monetary policy continues, while Fed Board Member Christopher Waller’s meetings with Trump as part of the Fed Chairmanship process have brought discussions about the institution’s future back to the agenda. The US’s determined stance on customs tariffs in its trade policies has brought the topic of global trade to the forefront, while in the crypto sphere, Michael Saylor’s statements regarding the Bitcoin protocol have reignited discussions about the network’s long-term structure.
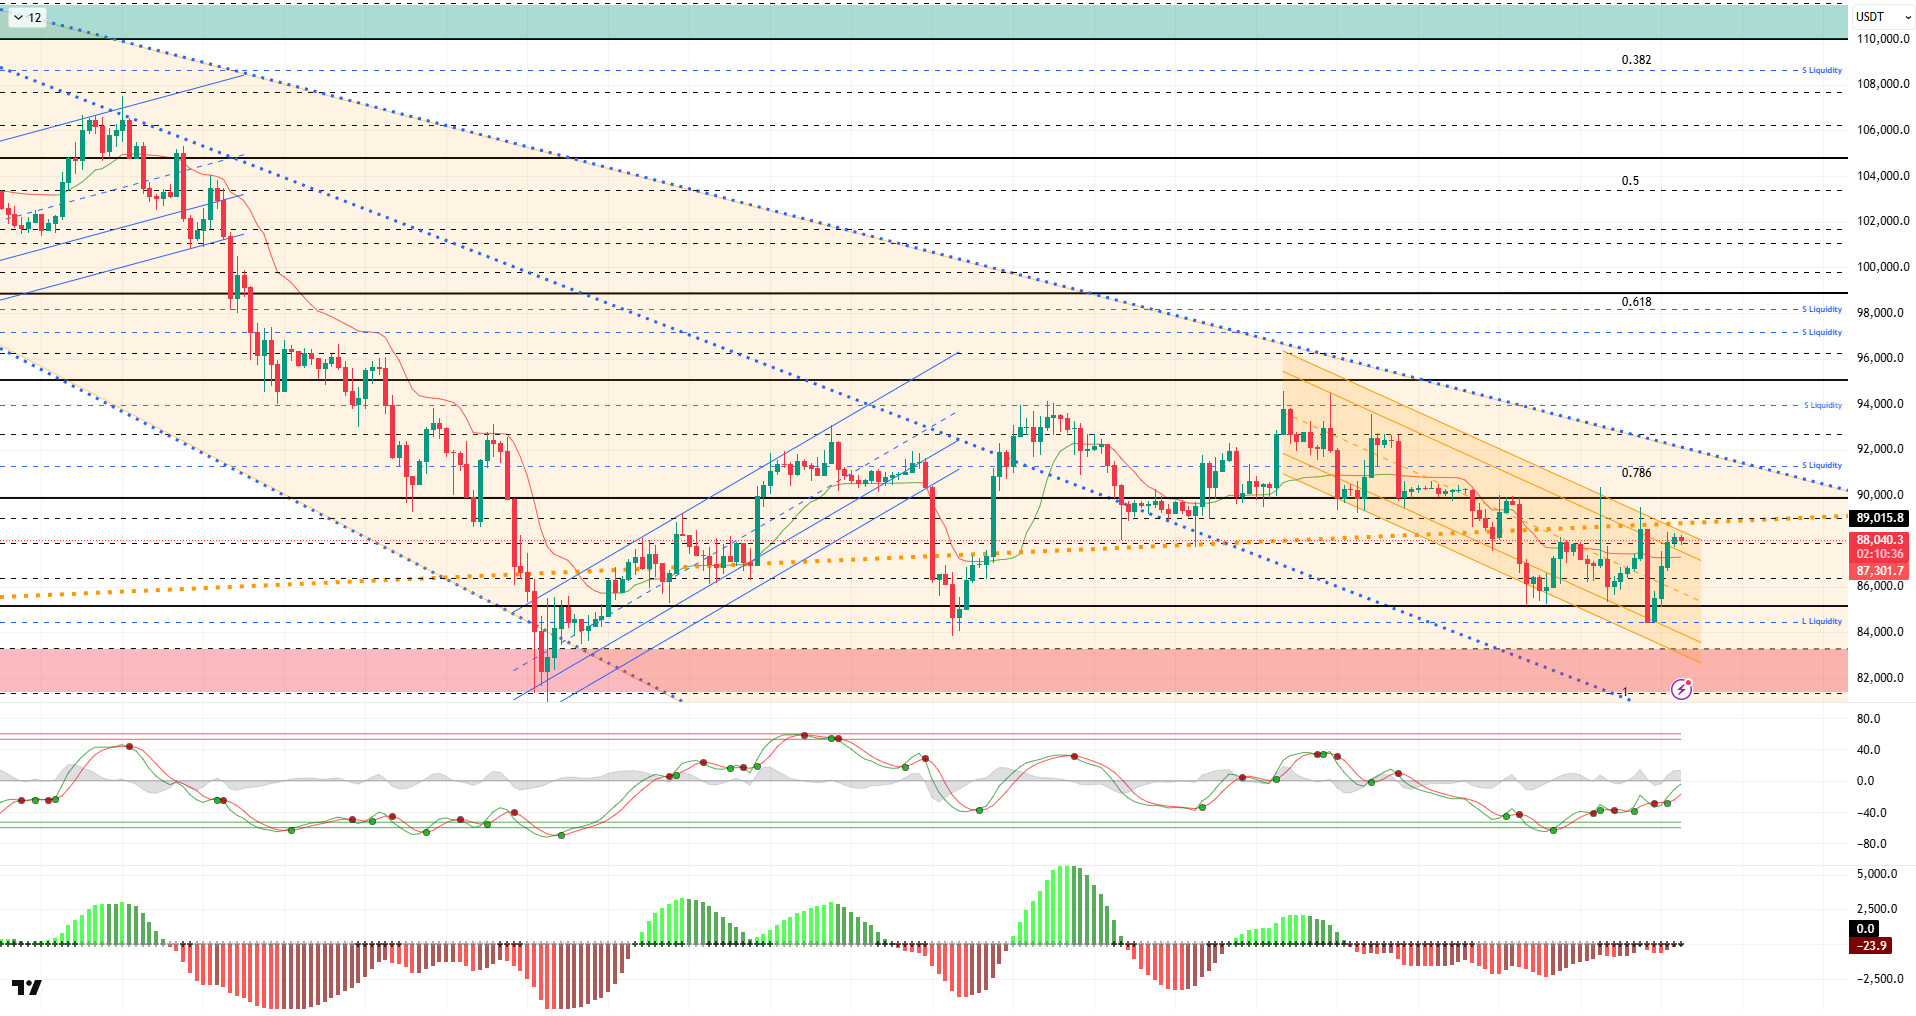
From a technical perspective, BTC continues to move parallel to the descending trend channel it has formed, occasionally testing the upper resistance band. The price, which has been volatile, is still trading below the major uptrend and has yet to show signs of an upward movement. With market sensitivity rising this week, BTC remains below the critical reference level of 90,000, continuing the selling pressure.
Technical indicators reflect the uncertain structure with the Wave Trend (WT) oscillator giving false and variable signals, while the histogram on the Squeeze Momentum (SM) indicator provides a clearer picture, showing that the market has not yet gained momentum.The Kaufman Moving Average (KAMA) is currently moving below the price level at $87,300.
When examining liquidation data, the recent volatile movements in BTC are aggressively forcing short-term buy and sell orders into liquidation. The buy level was liquidated at 85,000, while the sell level was liquidated just below 90,000. In contrast, the long-term sell level continues to maintain its accumulation above the 90,000 level.
In summary, after the Fed, ECB, and Bank of England, all eyes turned to the BoJ. As expected, the bank raised interest rates, with Governor Ueda emphasizing a cautious approach. Meanwhile, tensions between the US, China, and Venezuela began to dominate the market agenda. Technically, BTC continues to trade within a minor downtrend channel, with no catalyst yet emerging to form a new uptrend channel. Liquidity data shows that short-term trading activity is concentrated in specific areas, while long-term sell orders have yet to be tested.After this stage, the 89,000 level has become a critical point for the price to maintain its momentum as it passes through the major uptrend. Closings and pricing above this level are an important indicator for regaining momentum. In this context, 90,000 stands out as the next target area, and if it is passed, liquidity areas will be monitored again. In the event of potential selling pressure, the 88,000 level will be monitored as a support area.
Supports: 88,000 – 86,300 – 85,000
Resistances: 89,000 – 90,000 – 91,400
ETH/USDT
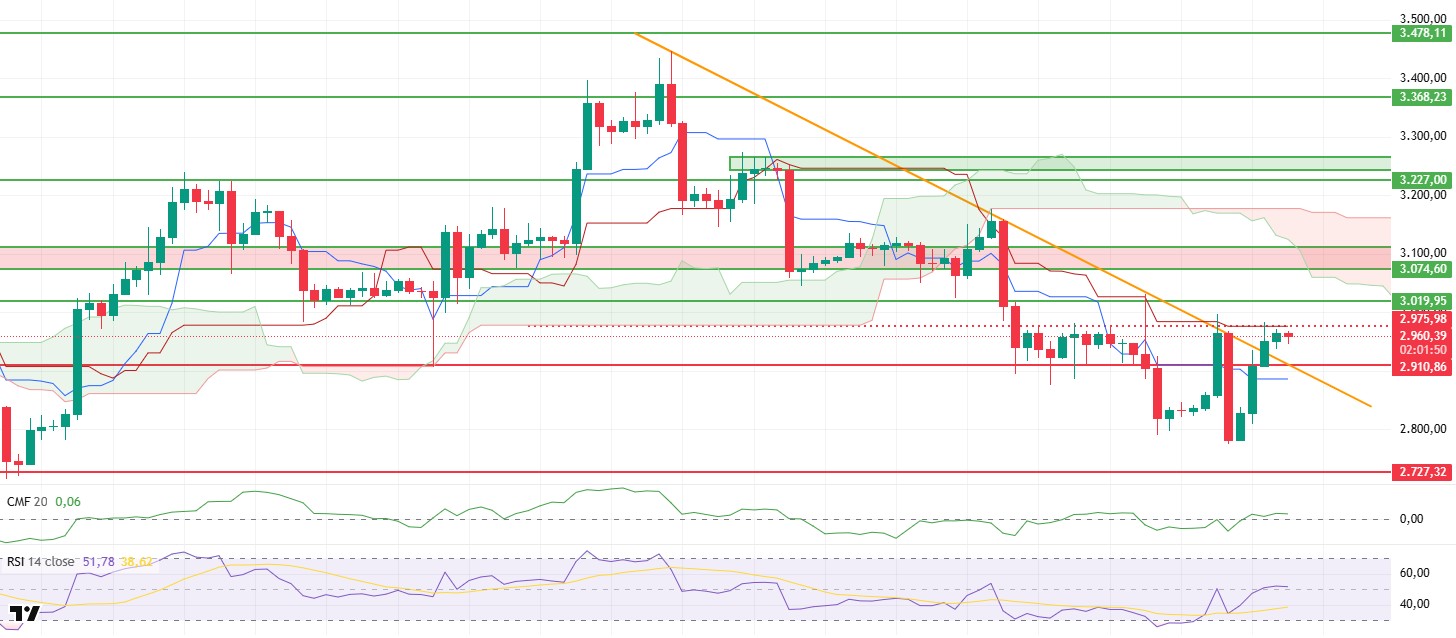
The ETH price moved within a calm range between $2,950 and $2,970 throughout the day without producing a clear direction. After the strong rise seen in the morning hours, the price hovering in this region indicates that buyers are holding their positions but are cautious about new momentum. This horizontal trend following sharp sales signals that the market is still seeking balance.
The liquidity outlook remained positive as the day progressed. The Chaikin Money Flow (CMF) indicator continues to hold above zero, indicating that capital entering the market has not completely withdrawn. The continued flow of liquidity stands out as one of the main reasons the price has not produced sharp downward movements.
The improvement seen in the morning is also being maintained on the momentum front. The Relative Strength Index (RSI) continues to stay above the 50 level, indicating that buyer momentum has not weakened. This stance in the RSI suggests that upward demand is still alive but that additional catalysts are needed for a strong breakout.
The notable point in the Ichimoku indicator was that the price remained above the Tenkan level but failed to break through the Kijun level. Although the Kijun level, located around $2,975, was tested during the day, there was no sustained breakout. If this level is gained, it appears technically possible for the price to open up and test the $3,020 region.
As of the evening hours, the overall positive structure of technical indicators is maintained. The $3,020 level is the prominent short-term target, and if this region is breached, the uptrend is expected to gain stronger momentum. On the downside, the $2,910 level remains the key support. As long as the price stays above this level, the current positive outlook remains intact and the upward expectation remains valid.
Supports: 2,910 – 2,727 – 2,625
Resistances: 3,019 – 3,074 – 3,227
XRP/USDT
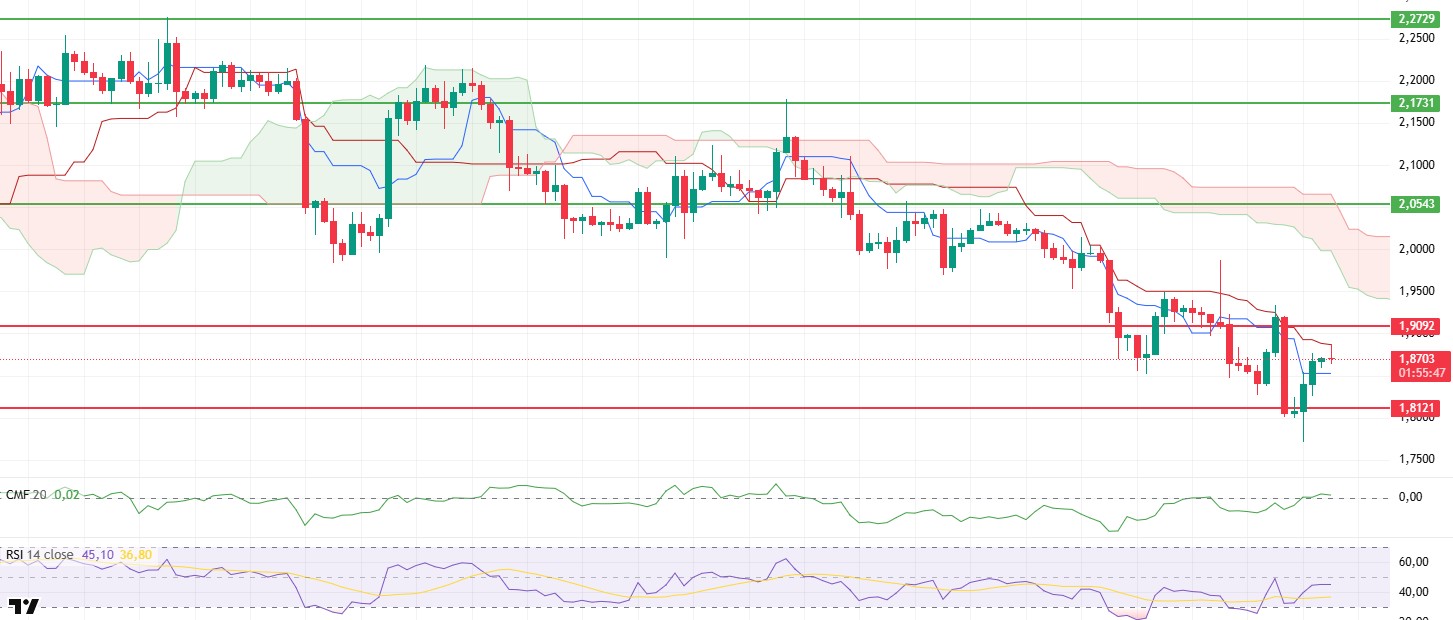
The XRP price moved throughout the day without completely losing its upward momentum and rose to the $1.88 level due to buying pressure. Selling pressure from the Kijun level capped the price in this region, and a slight pullback occurred towards the evening hours. Nevertheless, the price retaining most of its intraday gains indicates that sellers were unable to sustain their previous strong pressure.
The positive outlook on the liquidity side continues. Chaikin Money Flow (CMF) maintains its positive trajectory, indicating that capital entering the market is not being withdrawn during the day. Liquidity remaining in positive territory plays an important role in keeping withdrawals under control and preventing the price from producing sharp downward movements.
The momentum front presents a more cautious picture. The Relative Strength Index (RSI) is moving horizontally just below the 50 level. The RSI lingering in this region indicates that buyers have not completely lost their strength, but upward momentum has weakened. The lack of a clear direction on the momentum front may cause the price to move within a narrow range in the short term.
The technical outlook has not changed significantly from the Ichimoku indicator perspective. Although the price remains above the Tenkan level, the Kijun and Kumo cloud are still above. This structure indicates that pressure has decreased in the short term, but it is too early to say that the medium-term trend has turned positive.
As of the evening hours, the overall picture appears more balanced compared to the morning. The $1.90 level remains a key threshold for the continuation of the upward movement, and a retest of this region seems likely. On the downside, $1.81 remains an important support level. As long as the price stays above this level, it is difficult to say that the recent rise is completely invalid. While liquidity support continues in the current scenario, whether momentum regains strength will be decisive for the direction of the price.
Supports: 1.8121 – 1.6224 – 1.2596
Resistances: 1.9092 – 2.0543 – 2.1731
SOL/USDT
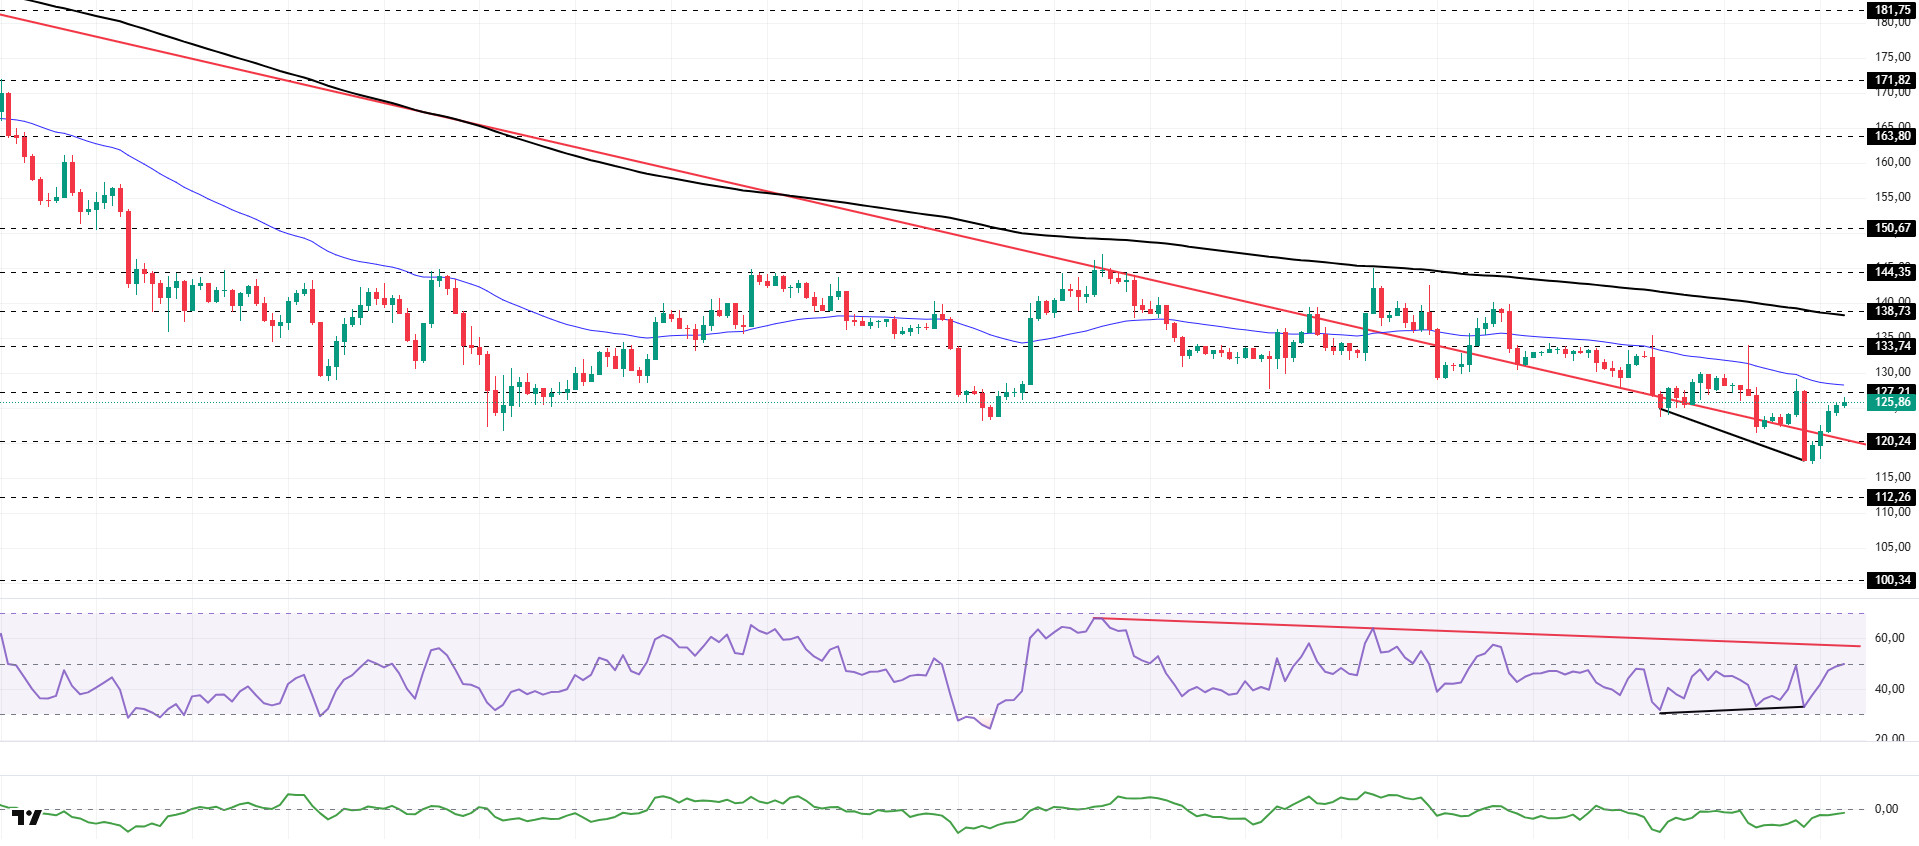
The SOL price showed an upward trend during the day. The asset continued to trade in the upper region of the downward trend that began on October 6. Currently priced between the downward trend line and the 50 EMA (Blue Line) moving average, the asset may test the 50 EMA (Blue Line) moving average as resistance if it experiences an uptrend. In the event of a pullback, the $120.24 level may be monitored.
On the 4-hour chart, it continued to be in the lower region of the 50 EMA (Exponential Moving Average – Blue Line) and 200 EMA (Black Line). This indicates that it may be in a downtrend in the medium term. At the same time, the price being in the lower region of both moving averages indicated that the asset is trending downward in the short term. The Chaikin Money Flow (CMF-20) is in the negative zone, close to the neutral level. However, a slight increase in money inflows could push the CMF into positive territory. The Relative Strength Index (RSI-14) rose from the middle of the negative zone to the neutral level. However, it remained below the downward trend that began on December 3. This indicates that selling pressure continues. However, positive divergence could push the price higher. If there is an uptrend due to macroeconomic data or positive news related to the Solana ecosystem, the $138.73 level stands out as a strong resistance point. If this level is broken upwards, the uptrend is expected to continue. In case of pullbacks due to developments in the opposite direction or profit-taking, the $112.26 level could be tested. If the price falls back to these support levels, an increase in buying momentum could present a potential upside opportunity.
Supports: 120.24 – 112.26 – 100.34
Resistances: 127.21 – 133.74 – 138.73
DOGE/USDT
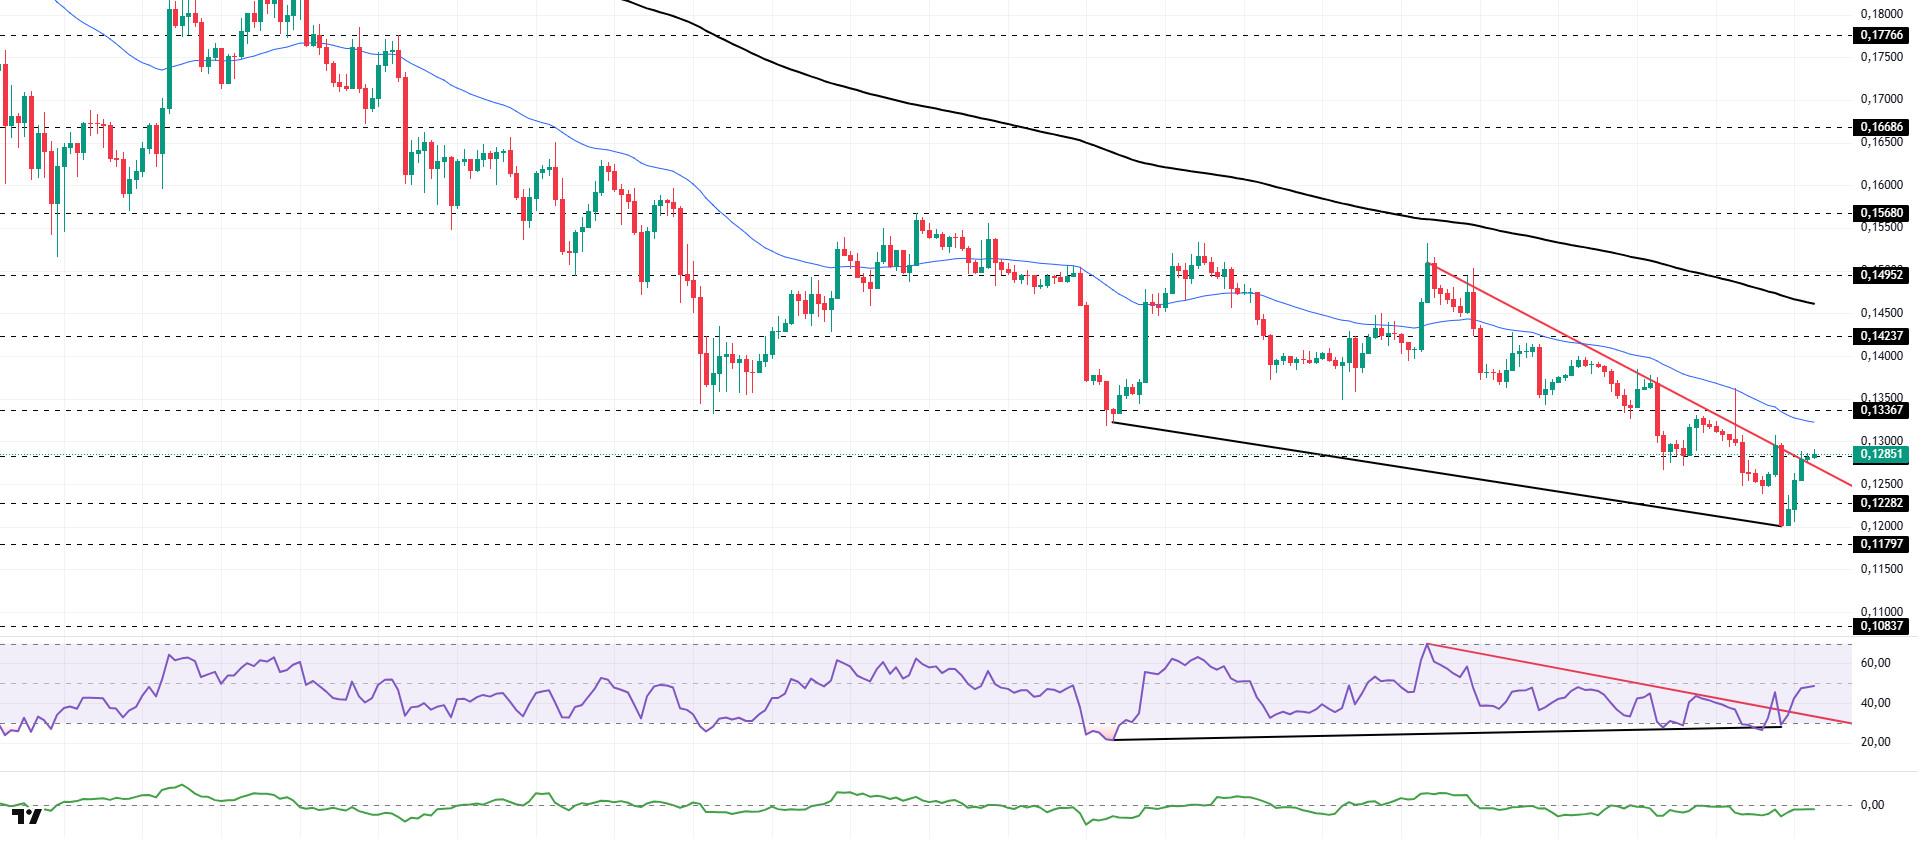
The DOGE price showed an upward trend during the day. The asset moved to the upper region of the downward trend that began on December 9 and strengthened the upward signal. Currently priced above $0.12824, the asset may test the 50 EMA (Blue Line) moving average as resistance if the uptrend continues. In case of a pullback, it may test the $0.11797 level and the downtrend line as support.
On the 4-hour chart, the 50 EMA (Exponential Moving Average – Blue Line) remained below the 200 EMA (Black Line). This indicates that the downtrend may continue in the medium term. The price being below both moving averages indicates a downward trend in the short term. The Chaikin Money Flow (CMF-20) has started to move into the negative zone near the neutral level. Additionally, the balance of money inflows and outflows may keep the CMF at a neutral level. The Relative Strength Index (RSI-14) rose from the middle of the negative zone to a neutral level. At the same time, it continued to remain in the upper region of the downward trend that began on December 9. This could create buying pressure. On the other hand, positive divergence should be monitored. In the event of an uptrend driven by political developments, macroeconomic data, or positive news flow in the DOGE ecosystem, the $0.14237 level stands out as a strong resistance zone. Conversely, in the event of negative news flow, the $0.11797 level could be triggered. A decline to these levels could increase momentum and initiate a new wave of growth.
Supports: 0.12824 – 0.12282 – 0.11797
Resistances: 0.13367 – 0.14237 – 0.14952
Legal Notice
The investment information, comments, and recommendations contained herein do not constitute investment advice. Investment advisory services are provided individually by authorized institutions taking into account the risk and return preferences of individuals. The comments and recommendations contained herein are of a general nature. These recommendations may not be suitable for your financial situation and risk and return preferences. Therefore, making an investment decision based solely on the information contained herein may not produce results in line with your expectations.
