
January 5 – 12, 2025 – Darkex Weekly Technical Analysis Report
BTC/USDT
The global agenda intensified with the US launching a large-scale military operation against Venezuela and the capture of President Nicolás Maduro and his wife. During the same period, US-Ukraine talks remained on the agenda with critical disagreements over territory and security, while tensions between China and Taiwan and Iran’s plans to export weapons using cryptocurrency increased global tensions. In the financial sphere, the Bank of Japan’s interest rate policies, discussions over Fed chair candidates in the US, and the OECD’s crypto asset reporting framework coming into effect are shaping investors’ agendas.
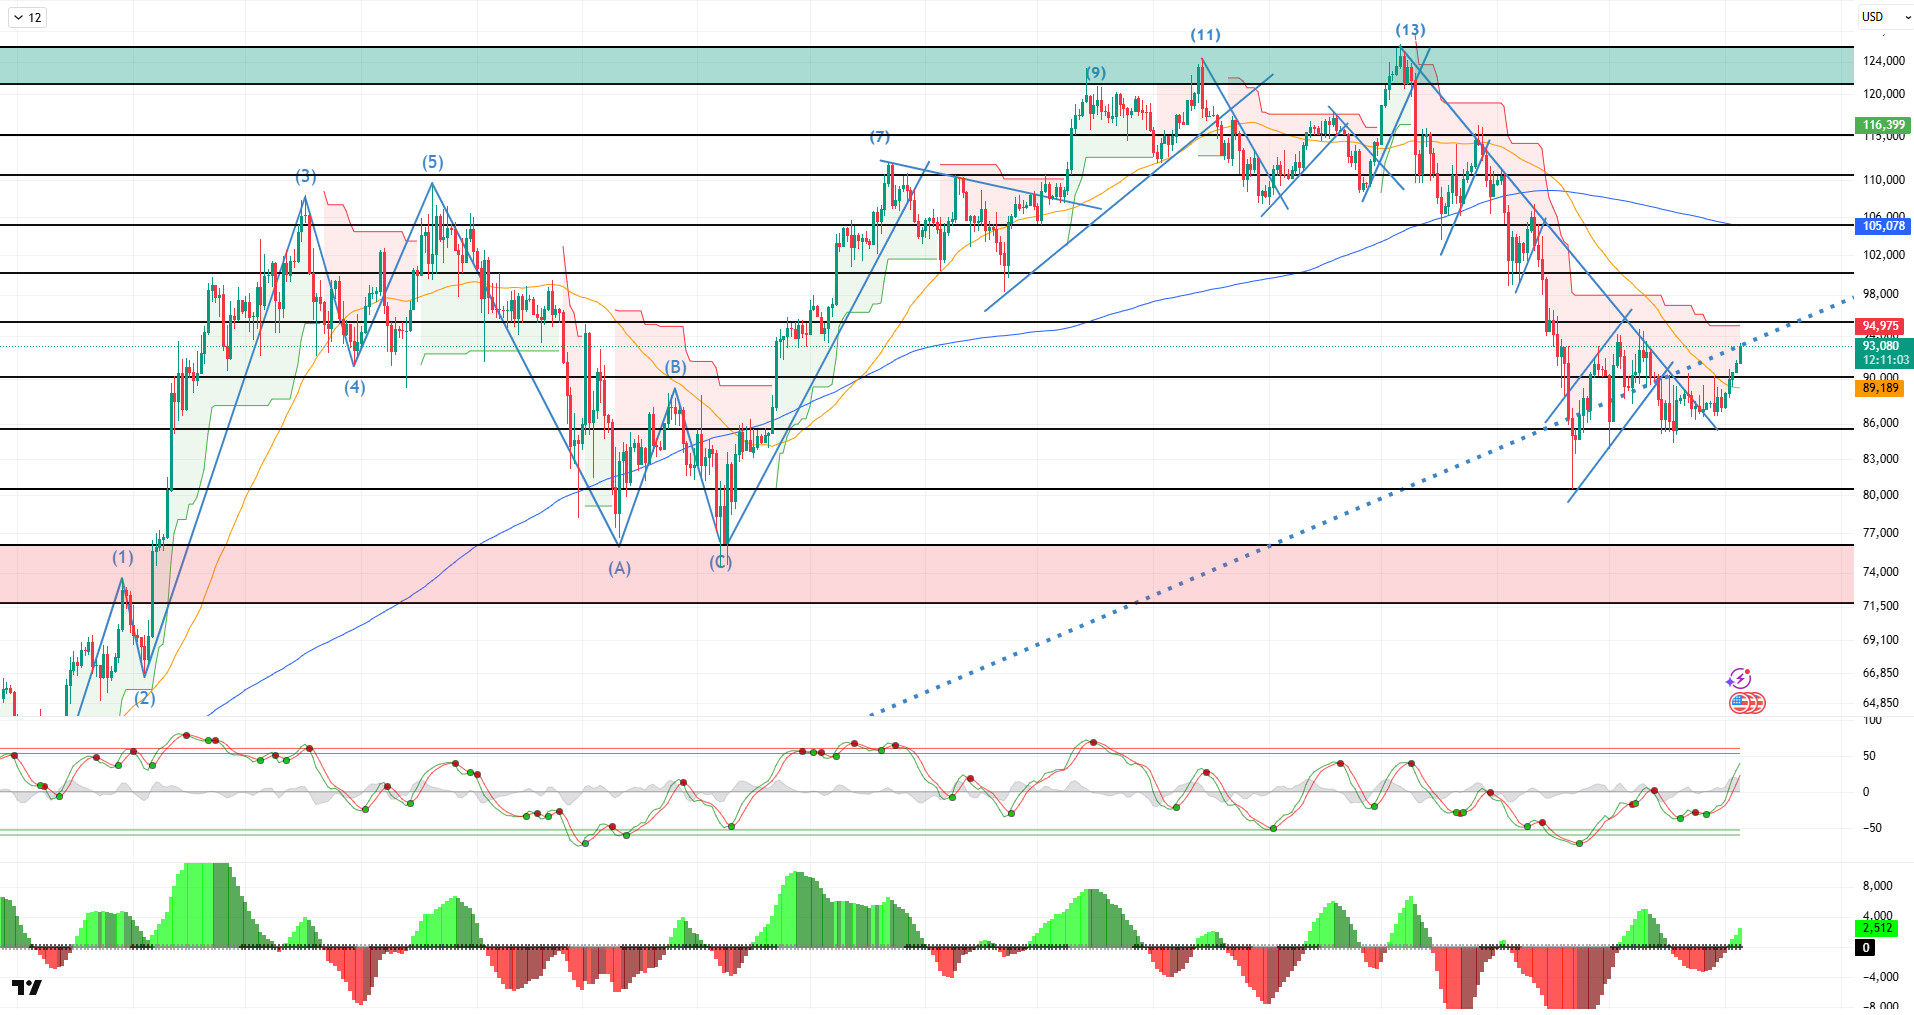
Looking at the daily technical outlook following all these developments, BTC has shifted its downtrend since its ATH level first to a horizontal band range and then to a minor upward channel. During this process, BTC, which started the year positively, tested the 93,400 level. The price, which touched the major uptrend line on the daily chart, is now at a decision point. If this level is broken, the uptrend is expected to gain momentum, and the 95,000 level will be monitored as the new reference area. A possible rejection could bring sharp sell-offs.
Looking at technical indicators, the Wave Trend (WT) oscillator approached the overbought zone, parallel to its buy signal. The Squeeze Momentum (SM) histogram settled into positive territory. In moving averages, the golden cross structure that began on May 17 was lost when the 50-day SMA crossed above the 200-day SMA. The Supertrend structure continues to maintain its bearish outlook.
Looking at weekly liquidation data, with the recent rise, the buy level gained intensity in the 84,000-86,000 band, while the sell level was liquidated in the short term in the 90,600-91,400 band. In the long term, accumulation continues in the 94,000 – 95,500 and 97,000 – 98,000 bands.
In summary, tensions between the US and Venezuela have escalated with the capture of President Maduro. Maduro, who will be tried in the US today, has received messages of support from China and Russia on the international stage. On the other hand, it has been suggested that Venezuela is accepting payments in BTC and USDT to avoid sanctions. While negotiations on the Russia-Ukraine front reached an impasse, on the economic front, the BoJ president raised interest rates, while the Fed issued cautious messages. On the technical side, the price, which managed to hold the new low of 80,500 for now, has once again surpassed the 90,000 level. In liquidity data, the recent rise has led to liquidation in the selling tiers, with buying tiers gaining weight. In the coming period, the price may continue to rise if it breaks through the falling trend line. In this context, if the 92,600 level is broken and closes above it, the 95,000 level will be targeted. On the other hand, if the price comes under selling pressure again due to fundamental developments, 90,000 will emerge as an important reference area, while 85,000 will be monitored as both a liquidity and demand zone in case of a breakout.
Supports: 90,000 – 85,000 – 83,800
Resistances: 95,000 – 98,000 – 100,000
ETH/USDT
The ETH price has been moving not only with short-term fluctuations since last week but also with deeper signals indicating that market equilibrium is being reestablished. Although price volatility remains high, recent data shows that the downward scenario is more limited compared to previous weeks. In particular, the medium-term outlook highlights a structure where fundamental and technical factors are beginning to improve together.
On the fundamental side, data on network usage paints a striking picture. According to Token Terminal data, the transfer volume on Ethereum reached $8 trillion, nearly doubling the $4 trillion recorded in the second quarter. BlockWorks data clearly shows the expansion on the stablecoin front. Throughout 2025, the stablecoin supply on Ethereum increased by approximately 43 percent, rising from $127 billion to $181 billion. This increase shows that the network is being used more intensively not only for speculation but also as a financial infrastructure.
On the technological front, Vitalik Buterin’s recent statements were one of the headlines that reinforced long-term expectations. Buterin emphasized that PeerDAS and the Zero Knowledge Ethereum Virtual Machine (zkEVM) architecture together make Ethereum a more scalable and powerful decentralized network. This statement shows that Ethereum maintains its technical claim in the blockchain trilemma debate and supports the long-term perception.
The picture on the institutional demand side is more cautious. Between December 26, 2025, and January 1, 2026, there was a total net outflow of $52.4 million from Spot Ethereum ETFs. BlackRock ETHA-related outflows were particularly prominent during this period. Although the $67.9 million single-day inflow seen on December 30 broke the negative streak, the overall flow remained weak and volatile. The cumulative net inflow falling to $12.347 billion shows that spot demand is still fragile.
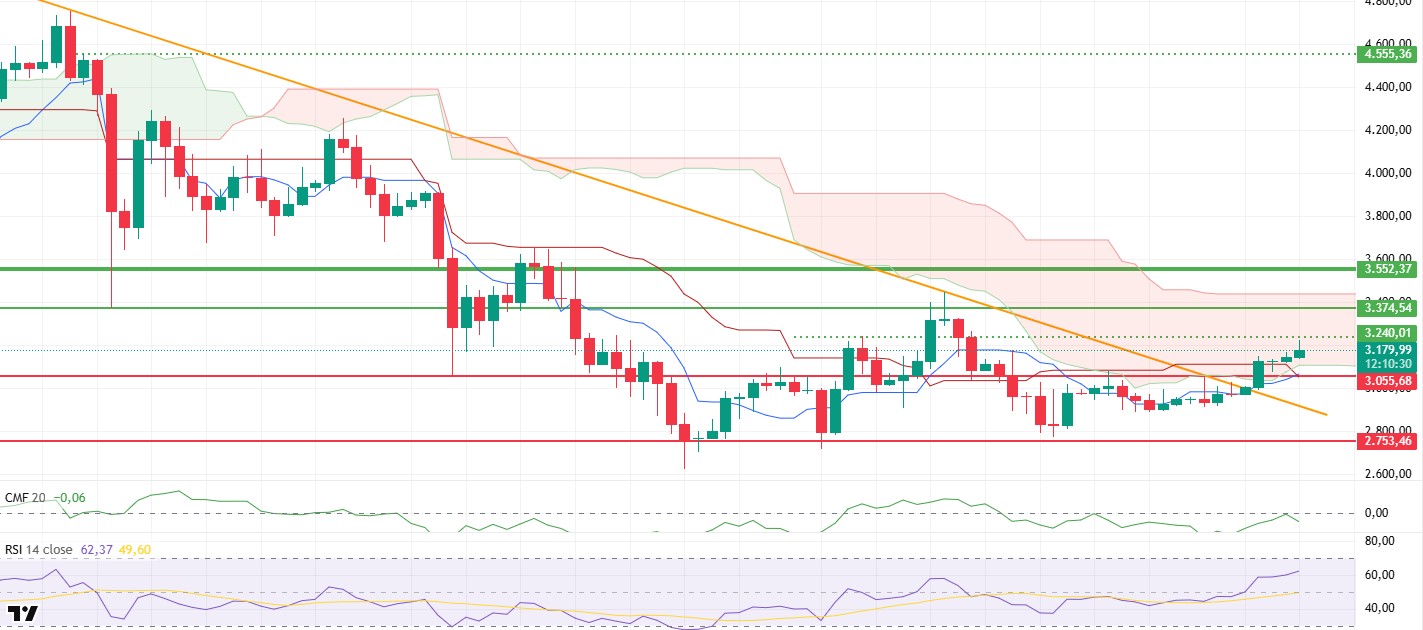
On the price front, a more constructive picture is emerging. The ETH price initiated an upward movement last week with a rebound from the $2,910 support level, surpassing the long-unbroken $3,055 level and accelerating the momentum. With this movement, the $3,200 level was also surpassed. Accompanying data indicates that this rise is not merely a short-term spike.
While the Spot Cumulative Volume Delta (CVD) continues its upward movement, the Chaikin Money Flow (CMF) also shows an increase in liquidity inflows. Although the CMF has not yet entered positive territory, it is clear that downward pressure has weakened significantly. This recovery in liquidity suggests that the rise is progressing on a healthier footing.
Momentum indicators also support this picture. The Relative Strength Index (RSI) rose to 62 on the daily timeframe. Since the indicator has not yet reached the overbought zone, it can be said that the upward movement has not yet run its course. The strengthening momentum indicates that selling pressure has receded and buyers are able to move more freely.
The technical outlook has also improved significantly from the Ichimoku indicator perspective. The price entering the kumo cloud and the Tenkan level crossing above the Kijun level signal the start of a positive trend in the medium term. When these two signals are evaluated together, it can be said that the rises seen in previous weeks, which were only seen as reactions, are now on a more structural footing.
Considering both technical and fundamental data in the overall picture, the ETH price is expected to continue its upward trend this week. The $3,374 level stands out as the first target zone on the upside. On the downside, the $3,055 level is a critical support position. If prices remain below this level, downward movements could intensify. As long as the current structure is maintained, the medium-term outlook remains upward.
Supports: 3,055 – 2,753 – 2,520
Resistances: 3,240 – 3,374 – 3,552
XRP/USDT
The XRP price appears to be seeking a different equilibrium compared to last week. While the weak structure of the previous period has given way to more dynamic price behavior, this movement is driven not only by technical but also by on-chain data. In particular, the change on the supply side provides an important backdrop for understanding the recent price rise.
Glassnode data points to a notable decline in the supply of XRP on exchanges over the last 60 days. The amount of XRP held on exchanges has fallen from 3.76 billion to 1.6 billion. This level was last seen in August 2018. This significant withdrawal of supply from exchanges indicates that selling pressure has weakened and investors’ tendency to hold their assets has strengthened. This picture stands out as one of the key factors explaining why the downside risks for the price remain limited.
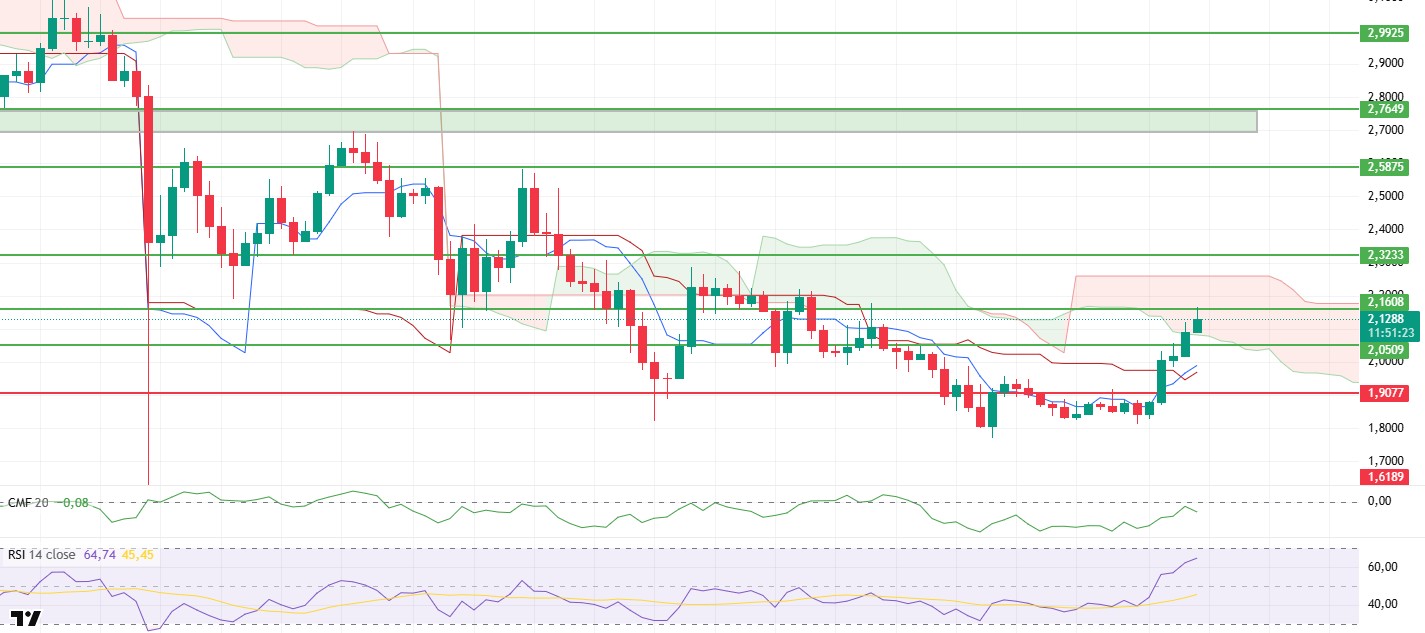
The impact of this change was also clearly visible on the price side. After regaining the $1.90 level last week, the XRP price showed a sharp upward movement and rose to the $2.16 resistance level. This move showed that areas that could not be overcome in previous weeks were tested more eagerly this time. With the regaining of $1.90, it can be said that sentiment has improved significantly.
Although there has not been a full recovery in liquidity, the picture is more constructive than in previous weeks. Chaikin Money Flow has not yet crossed into positive territory, but its accompanying rise indicates that the outflow of money from the market has lost momentum. The slowdown in liquidity outflows stands out as one of the key factors preventing the rally from fading quickly.
On the momentum side, a noticeable strengthening is evident. The Relative Strength Index has risen to 65. This movement indicates that buyers have become more eager and are not struggling to push the price up. However, the RSI approaching the overbought zone also brings with it the possibility of pricing that slows down in the short term or includes limited pullbacks.
The technical structure has also improved significantly from the Ichimoku indicator perspective. The XRP price has managed to enter the kumo cloud after a long break, and the Tenkan line has crossed the Kijun level upwards. When these two signals are evaluated together, it is possible to say that a change in direction has occurred in the medium-term trend. The impression that the rises seen in previous weeks, which were only seen as reactions, are now on a more structural footing is growing stronger.
In general, the XRP price is expected to continue its upward movement during the week. If the $2.16 level is exceeded, the $2.32 region emerges as the next target area. On the downside, the $2.05 level is a critical support position. As long as this level is maintained, it seems more likely that pullbacks will remain limited and the upward trend will continue.
Supports: 2.0509 – 1.9077 – 1.6189
Resistances: 2.1608 – 2.3233 – 2.5875
SOL/USDT
Within the Solana ecosystem;
USDC Treasury recently announced that it had burned over 51 million tokens on the Solana blockchain.
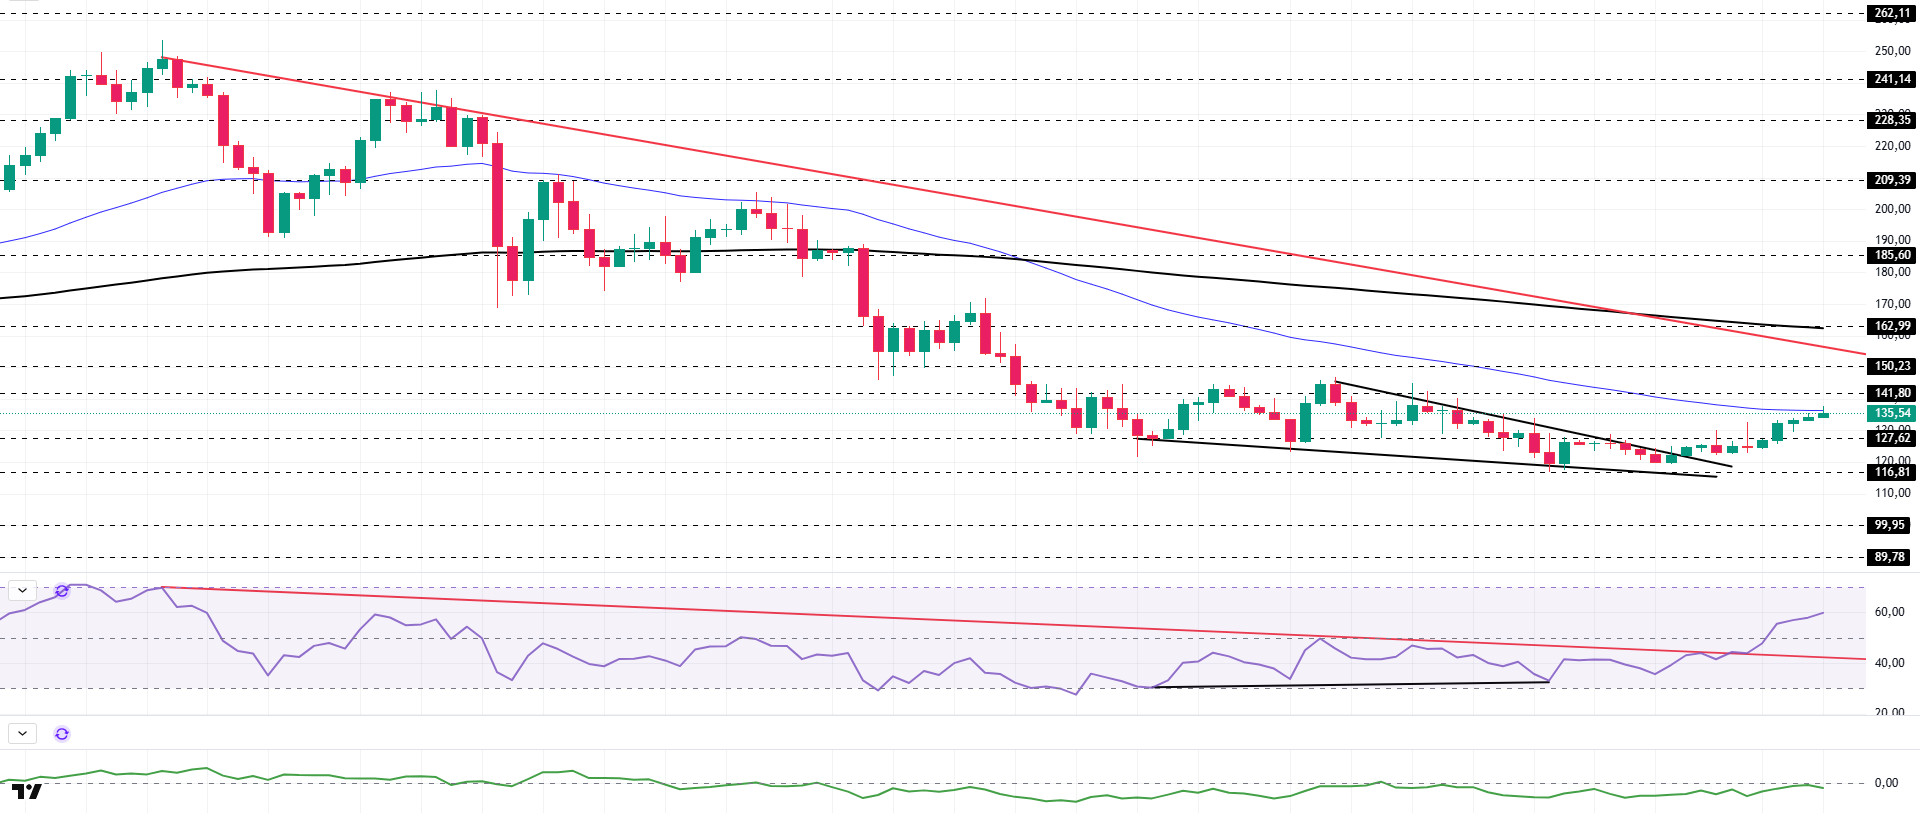
The SOL price rose by approximately 10% on the daily chart this week. The asset remained in the lower region of the downtrend that began on September 18. Testing the strong support level of $116.81 and the base level of the falling wedge formation as support, the price accelerated from there and broke above the falling wedge formation. Currently testing the 50 EMA (Blue Line) moving average as resistance, the price may test the downward trend as resistance in candle closes above this level. In the event of a pullback, it may test the $127.62 level as support.
The asset is trading below its 50 EMA (Exponential Moving Average – Blue Line) and 200 EMA (Black Line) moving averages, indicating that the asset is trending downward. Furthermore, the 50 EMA remained below the 200 EMA. This showed us that a “dead cross” formation was continuing from a technical perspective. It also indicated that the potential for decline in the medium term was continuing. The RSI (14) rose from the middle of the negative zone to the middle of the positive zone. At the same time, the indicator remained above the downward trend that began on July 22, signaling that buying pressure may continue. Chaikin Money Flow (CMF-20) remained at a negative level. At the same time, an increase in cash outflows could push the CMF-20 indicator down to the middle of the negative zone. If macroeconomic data remains positive and developments in the ecosystem continue to be favorable, the first major resistance level of $162.99 could be retested. Conversely, in the event of potential negative news flow or deterioration in macro data, the $99.95 level could be monitored as a potential buying opportunity.
Supports: 127.62 – 116.81 – 99.95
Resistances: 141.80 – 150.23 – 162.99
DOGE/USDT
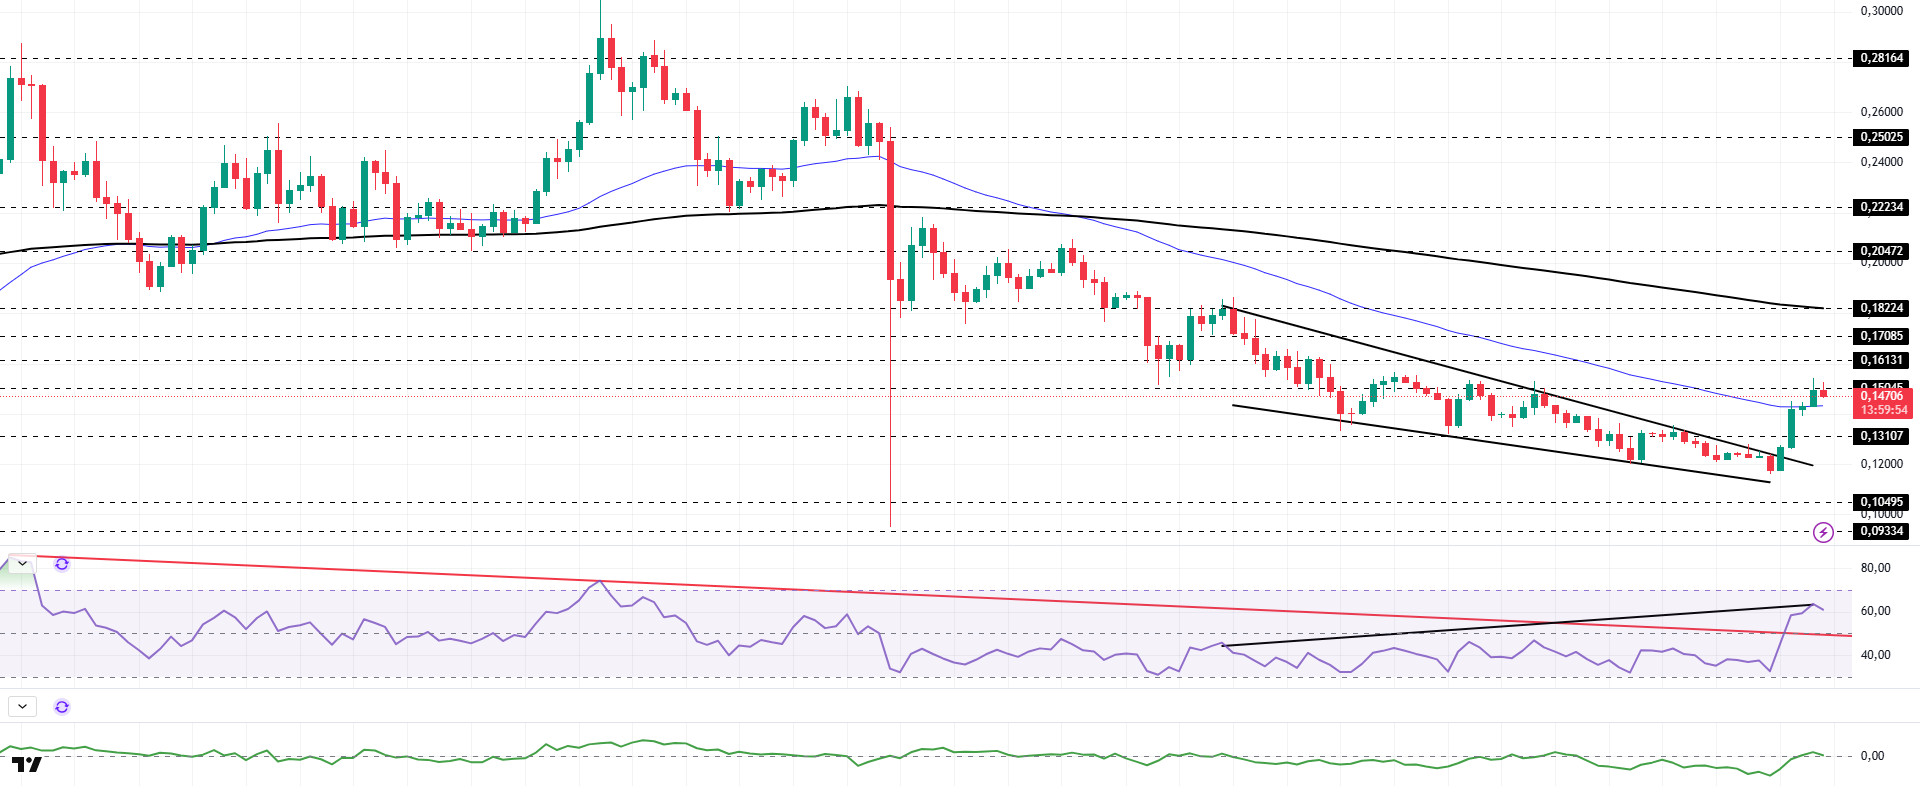
DOGE has shown an increase of approximately 21% on the daily chart since last week. The asset experienced an upward movement by breaking the descending wedge formation that began on November 10. Continuing its momentum, the asset tested the 50 EMA (Blue Line) moving average as resistance and broke through it, continuing its upward movement. Currently testing the strong resistance level of $0.15045, the price may test the 200 EMA (Black Line) moving average as resistance upon closing above this level. In the event of a pullback, it may test the 50 EMA (Blue Line) moving average as support.
The asset has started trading between the 50 EMA (Blue Line) and 200 EMA (Exponential Moving Average – Black Line) moving averages. This indicates that the asset is in a decision phase. On the other hand, the 50 EMA moving average being below the 200 EMA moving average shows us that the “dead cross” formation is continuing. This also indicates that the asset currently has the potential to lose value. The Chaikin Money Flow (CMF–20) indicator is at a neutral level. Money inflows have started to increase. This could push the CMF-20 into positive territory. Looking at the Relative Strength Index (RSI-14) indicator, it has risen from the oversold zone to the middle of the positive zone. At the same time, it has broken above the downward trend that has been ongoing since September 13 and is showing an upward trend. This indicates that buying pressure is building. In the event of macroeconomic risks or negative news from the ecosystem, the $0.10495 level can be monitored as strong support. On the other hand, if the upward movement gains strength, the $0.18224 level comes to the fore as the first strong resistance level.
Supports: 0.13107 – 0.10495 – 0.09334
Resistances: 0.15045 – 0.16131 – 0.17085
TRX/USDT
Last week, with the minting of 1 billion USDT on the Tron network, the total USDT supply on the network reached $81.5 billion. Current data shows that TRON continues to be one of the largest blockchain networks in terms of USDT supply.
Last week, the TRON network generated a total of $46.1 million in revenue, continuing to be the highest-earning ecosystem among all blockchain networks. This table shows that TRON has a clear advantage over competing networks in terms of revenue generation.
During the week of December 29, 2025 – January 4, 2026, a total of 21.9 million TRX were burned on the TRON network. Despite this, the circulating supply increased by 5.5 million. While the increased supply poses a risk of putting pressure on TRX pricing in the short term, the regular burning process plays a balancing role in the medium-term outlook. Additionally, the total number of addresses increased by 1.5 million to 357.6 million during the same week.
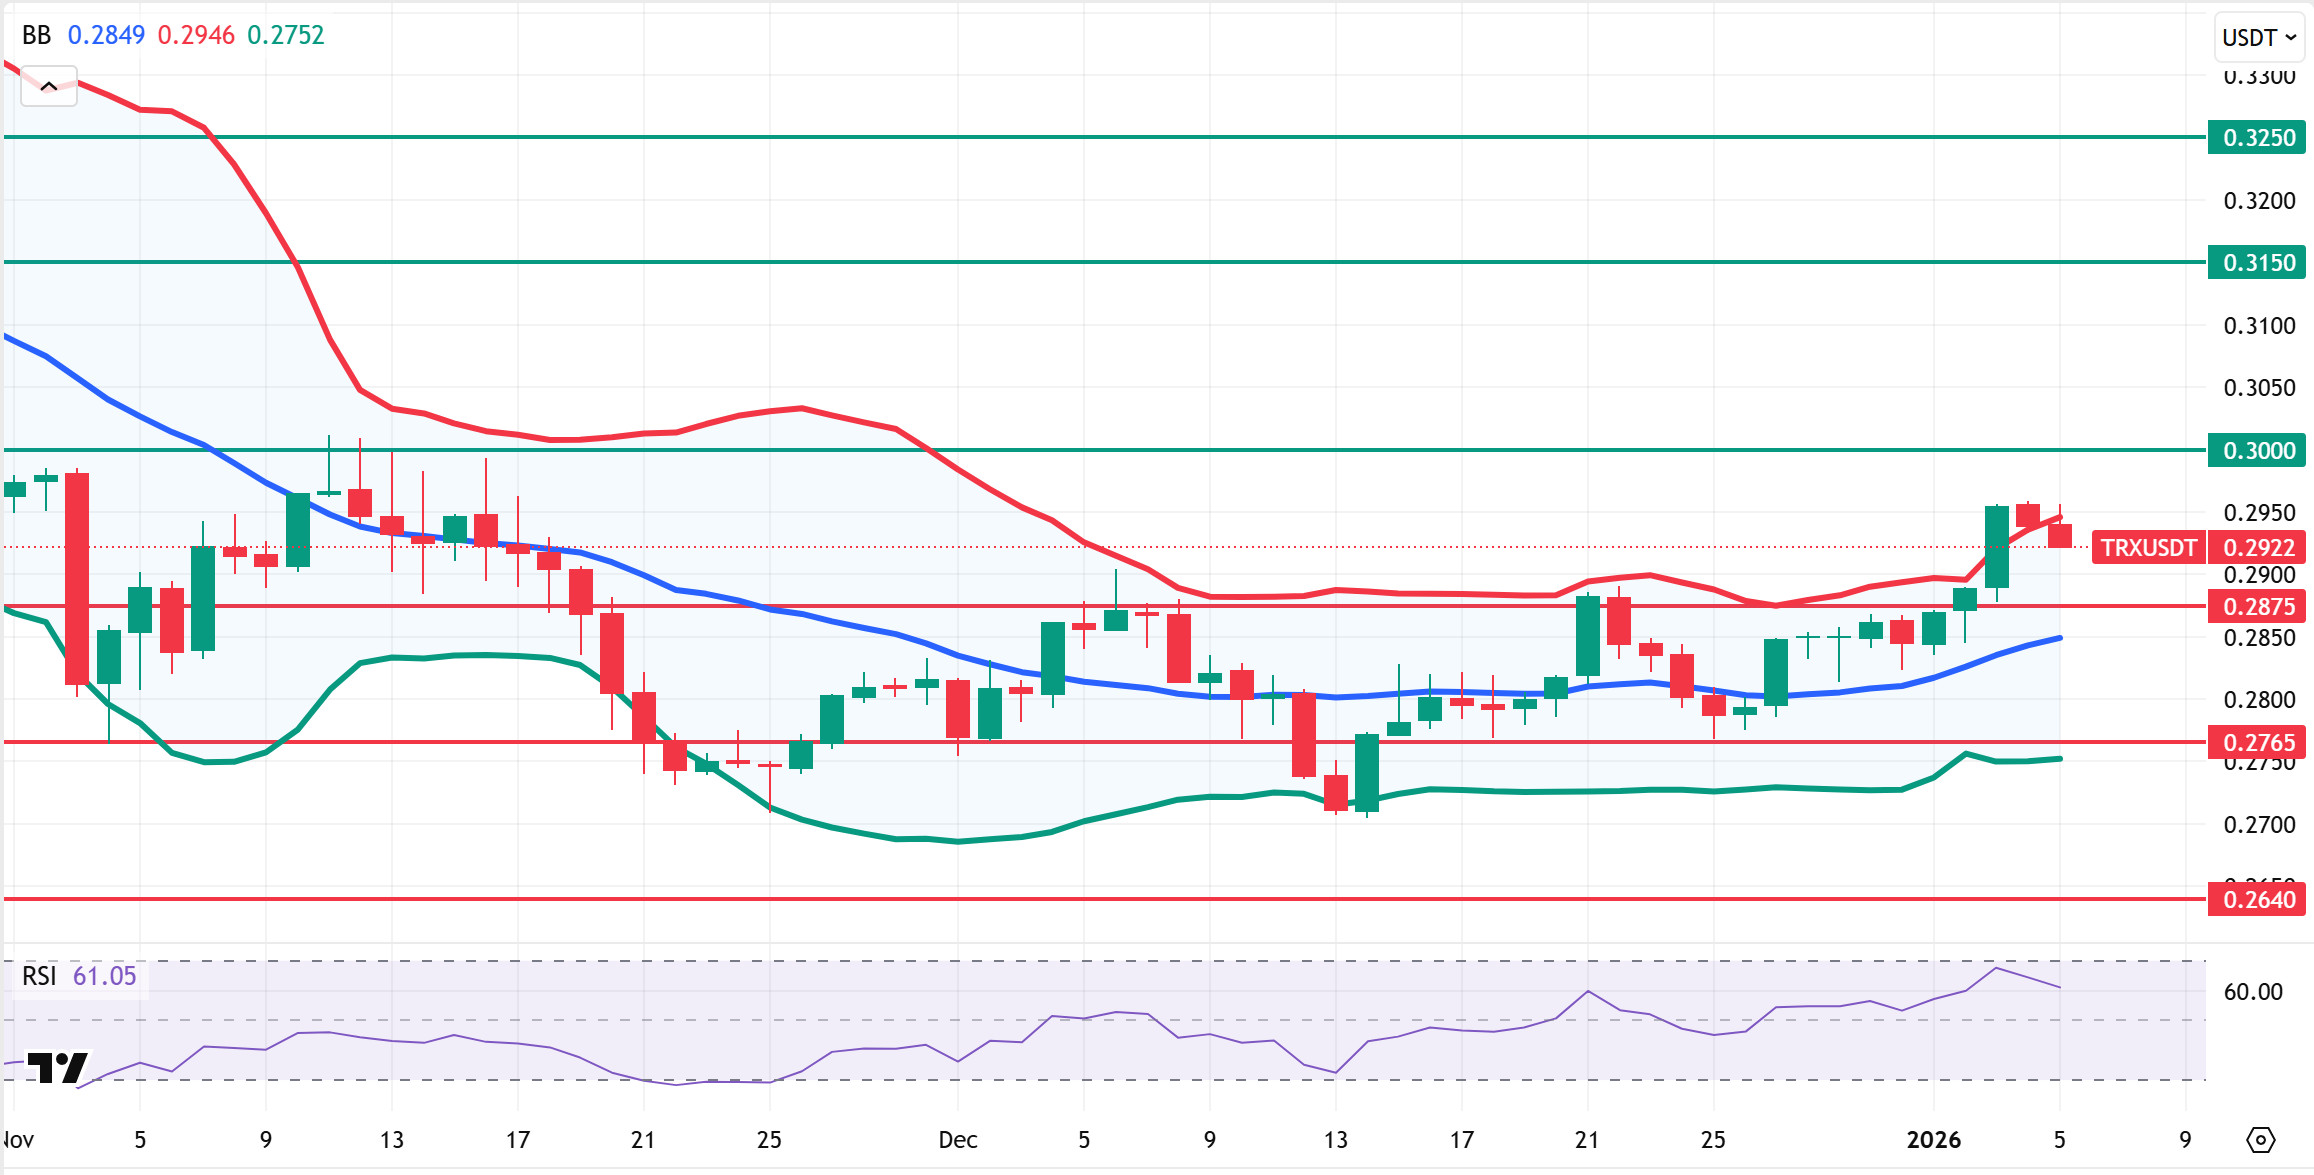
Technically speaking, TRX started last week at 0.2849 and gained approximately 3% in value throughout the week, closing at 0.2939. Thus, TRON ended the week with an increase, bringing its market value to $27.8 billion. Currently trading at 0.2922, TRX is at the upper Bollinger band on the daily chart. The Relative Strength Index (RSI) value is observed to be close to the overbought zone at the 61 level. Considering its position within the Bollinger band and the RSI indicator, the TRX price may pull back slightly. This indicates that it may move towards the Bollinger middle band. In such a case, it may test the 0.2875 support. If it closes below the 0.2875 support level on a daily basis, it may move towards the Bollinger lower band and test the 0.2765 support level. If it does not close below the 0.2875 support level on a daily basis and the positive market sentiment strengthens, it may rise with potential buying from the area in question. In such a case, it may attempt to break above the Bollinger upper band and test the 0.3000 resistance. The 0.2640 level is being monitored as a critical support point on the daily chart. Holding above this level may signal the continuation of the positive trend, while downward closes may lead to intensified selling pressure and an acceleration of the downward movement.
Supports: 0.2875 – 0.2765 – 0.2640
Resistances: 0.3000 – 0.3150 – 0.3250
AVAX/USDT
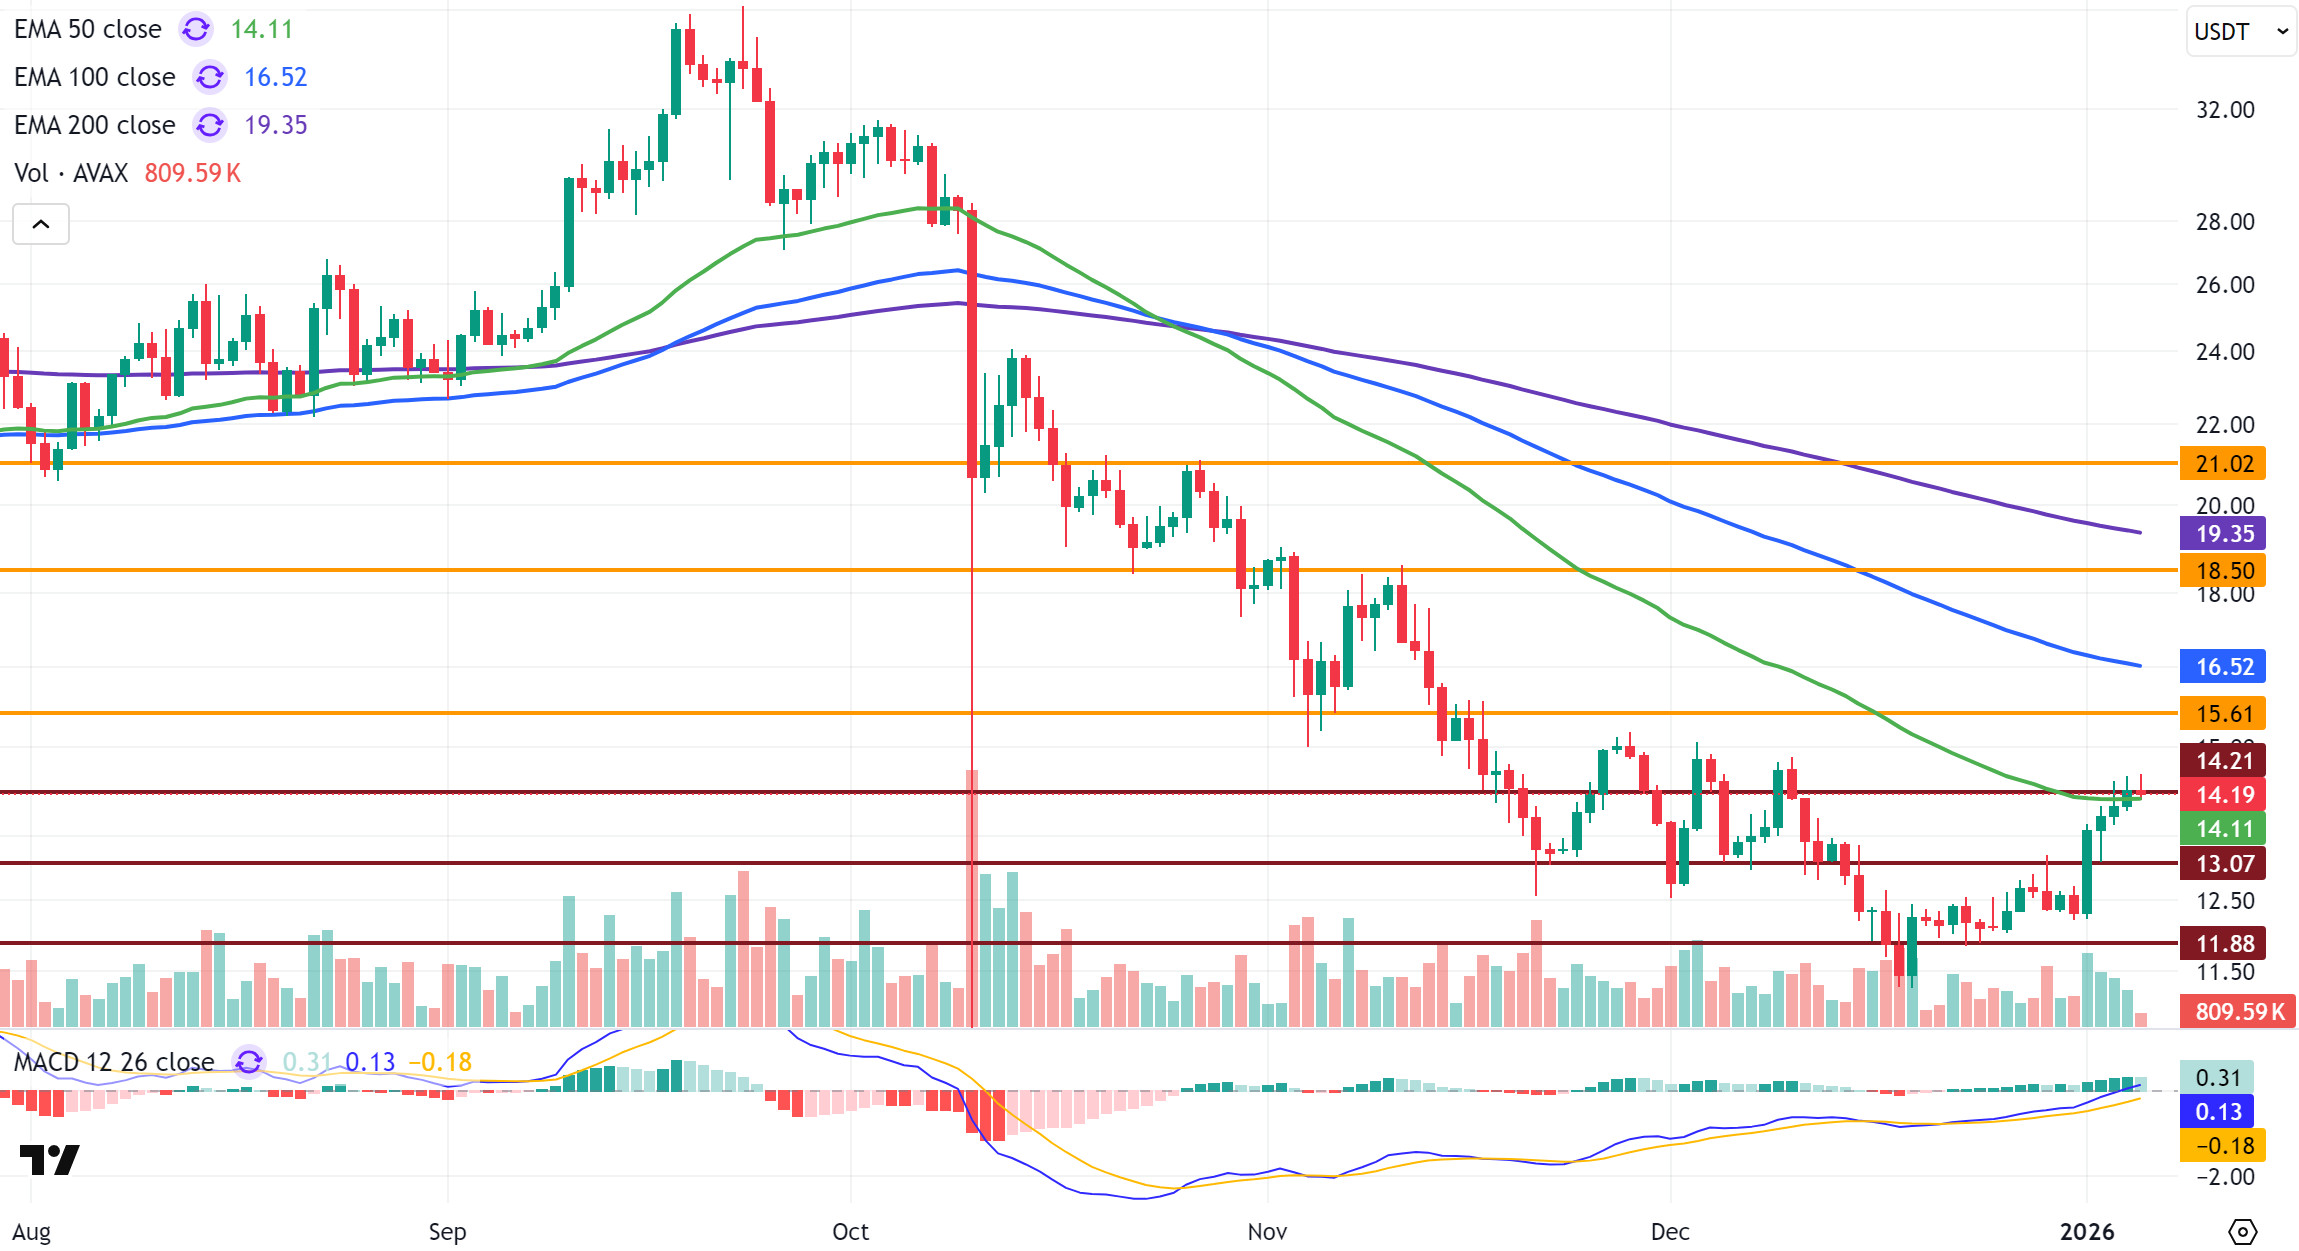
Starting last week at $12.64, AVAX performed well throughout the week as buying appetite increased. After falling to $12.21 last week, AVAX rose on buying from this level, closing the week at $14.25. AVAX’s price increased by approximately 12.74% on a weekly basis. Starting the new week with an uptrend, AVAX fell below the $14.21 support level after selling pressure following the rise and continues to trade below this level. Positive developments are also coming to the fore in the Avalanche ecosystem. The Arena platform sharing its January 2025 roadmap and announcing steps such as the transition from V1 token migration to V2 DEX, particularly with the iOS and Android mobile app, are among the developments supporting positive medium-term expectations for the ecosystem. However, the impact of these developments on pricing remains limited at this stage.
On the daily chart, the Moving Average Convergence/Divergence (MACD) line continues to trade above the signal line and in positive territory. The upward direction of the MACD indicates that positive momentum is maintained from a technical perspective. The MACD’s persistence in the positive zone is important in terms of breaking resistance levels during the continuation of the uptrend. The technical indicators currently show a positive outlook. On the Exponential Moving Average (EMA) side, AVAX managed to break the EMA50 level with its rise. However, the EMA100 and EMA200 levels are still above the price and stand out as critical resistance zones for upward movement. Breaking through these EMA levels is an important threshold for the uptrend to gain strength in the medium term.
From a technical perspective, the $15.61 level is the first important resistance zone for AVAX’s rise. If this level is broken, the $18.50 level becomes a major resistance level for the continuation of the rise. If the price closes above the $18.50 resistance level, the $21.02 level could come into play. In a downward scenario, the $14.21 level is the first critical support level. Closings below this level could cause the price to retreat back to the $13.07 and then $11.88 support levels ( ). In the overall outlook, the MACD being in positive territory and AVAX breaking above the EMA50 level supports the short-term outlook. However, continued trading below the EMA100 and EMA200 levels indicates that the uptrend has not yet fully transformed into a trend reversal. Therefore, unless there are closes above resistance levels accompanied by strong momentum and increased volume, the uptrend is likely to progress gradually and cautiously.
(EMA50: Green Line, EMA100: Blue Line, EMA200: Purple Line)
Supports: 14.21 – 13.07 – 11.88
Resistances: 15.61 – 18.50 – 21.02
SHIB/USDT
This week, the main topic dominating the Shiba Inu ecosystem was rebuilding trust following the Shibarium bridge attack and the accountability discussions surrounding it. Kaal Dhairya’s year-end letter dated December 29 directly addressed claims that the team had not initiated a formal complaint process, stating that he had been interviewed by three federal agents and referred to the relevant processes. In this context, the main message to the community was that they were entering a repair-focused period rather than one of hype, and that recovery would proceed in a more disciplined manner, both in terms of governance and technology.
Technologically, the reactivation of the Plasma Bridge and the migration of bridge security to a more robust architecture stood out. Measures in the new period, such as blacklisting, a 7-day withdrawal delay, and the migration of critical contracts to hardware storage, demonstrated that the recovery was not only to open services but also to permanently reduce the attack surface. Additionally, the week’s main topic of audit and process standardization involved Hexens reviewing changes and the checkpoint system becoming operational again.
SOU’s (Shib Owes You) framework, which aims to make compensation and receivables visible on-chain, was the most strategic announcement of the week. This model displays affected users’ receivables as verifiable NFT records on Ethereum. The principal balance decreases through payments and donations, and the fact that these records are combinable, divisible, and transferable offers options such as secondary market liquidity. The announcement specifically noted that the SOU interface is not yet live and warned against fraud risks. This signaled a hardening of communication skills during the recovery process. While significant momentum was observed on the on-chain burn side on the first day of the year, a significant normalization of the burn rate was observed in the days that followed. Another sign that news flow and configuration steps have made market positioning more sensitive in the short term was the increase in Derivatives’ open position size by approximately 20% to $103.87 million.
This week’s technical outlook shows that the effects of the downtrend are still ongoing, but the short-term recovery dynamics have clearly strengthened. The simultaneous rise in volume, momentum, and volatility signals increased market participation and higher energy in the movement compared to last week. This time, the Chaikin Money Flow (CMF) indicator moving into positive territory is a significant change, indicating strengthened net buyer liquidity and upward attempts beginning to be supported by more solid capital inflows.
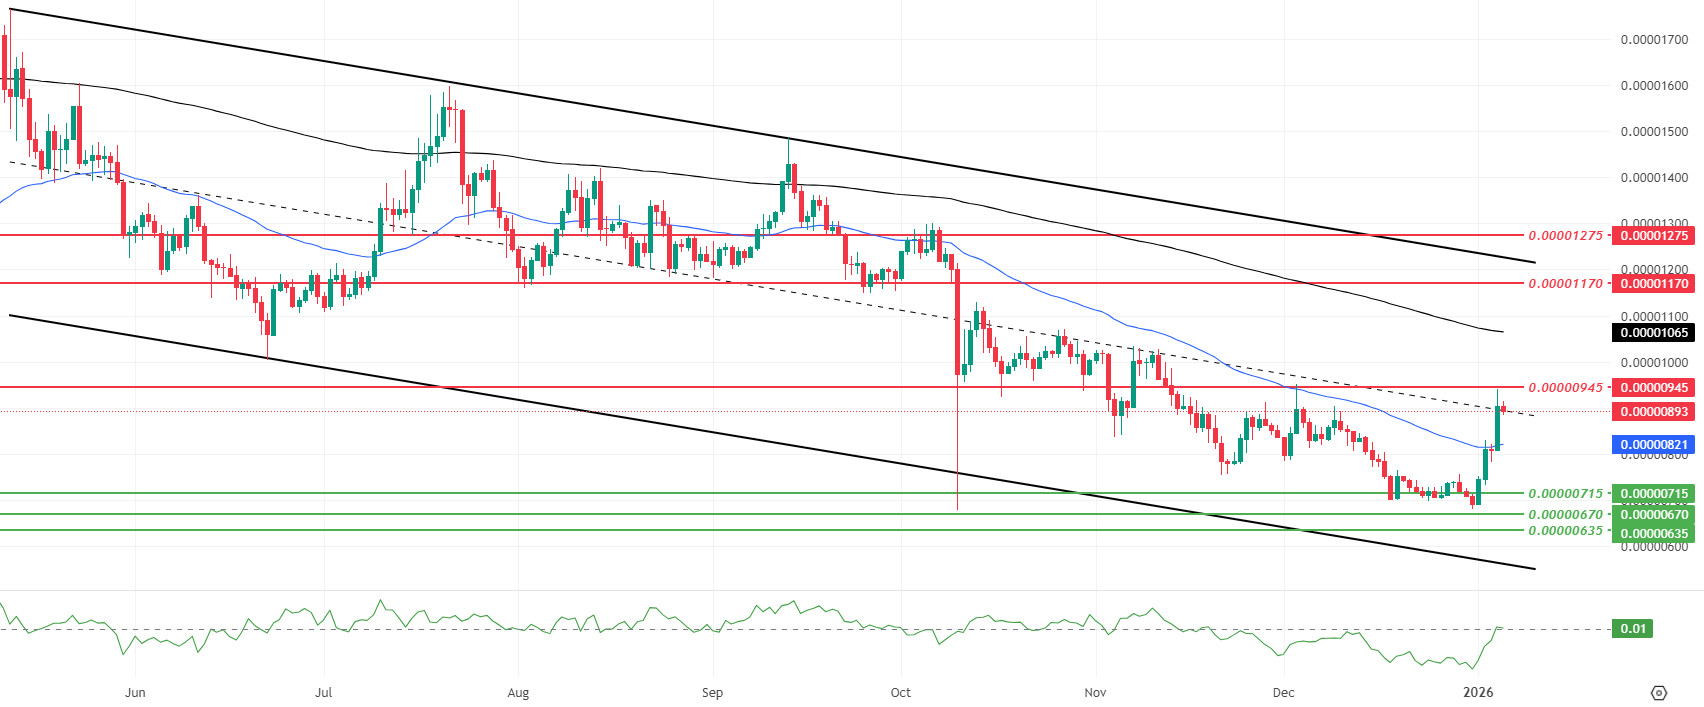
The price rising to the $0.00000945 resistance level and then reacting from there shows that supply is still coming into play in upward tests and that the market is not giving up this band easily. Nevertheless, the price rising above the 50-period Exponential Moving Average (EMA) signals a significant improvement in the short-term trend perception. The current price remaining between the EMA 50 and EMA 200 indicates that the market is in a transition zone. For the main trend to be considered truly changed, the price needs to show sustainability above the EMA 200. As long as this zone is not breached, the rallies may appear more like a strengthening reaction wave within a broader downtrend rather than a trend reversal. On the downside, the $0.00000715 support zone remains the key equilibrium reference. If the price falls below the EMA 50 and closes weakly for several days in a row, it would not be surprising to see the $0.00000715 level retested. If this support breaks, the $0.00000670 and $0.00000635 levels will regain importance. On the other hand, if a clearer hold is achieved above the $0.00000945 band, the upward movement area will widen and the possibility of acceleration towards the next resistance zones may increase. (EMA200: Black line, EMA50: Blue line)
Supports: 0.00000715 – 0.00000670 – 0.00000635
Resistances: 0.00000945 – 0.00001170 – 0.00001275
BNB/USDT
The latest BNB Chain data shows that user and transaction activity in the BNB ecosystem has strengthened compared to the previous week, while capital appears to be more cautious. During this period, BSC’s average daily active user count rose by 5.2% to 2.54 million, while opBNB recorded a limited but steady 2.4% increase in DAU. Similarly, transaction counts also increased on both networks, rising by 6% on BSC and 8% on opBNB. In contrast, total transaction volume declined by 2.8% on a weekly basis to $31.6 billion, indicating that the average transaction size decreased despite the increase in transaction counts. On the other hand, the total value locked (TVL) declined by 5.6% to $10.1 billion, indicating that profit-taking and risk reduction trends were prominent on the DeFi side.
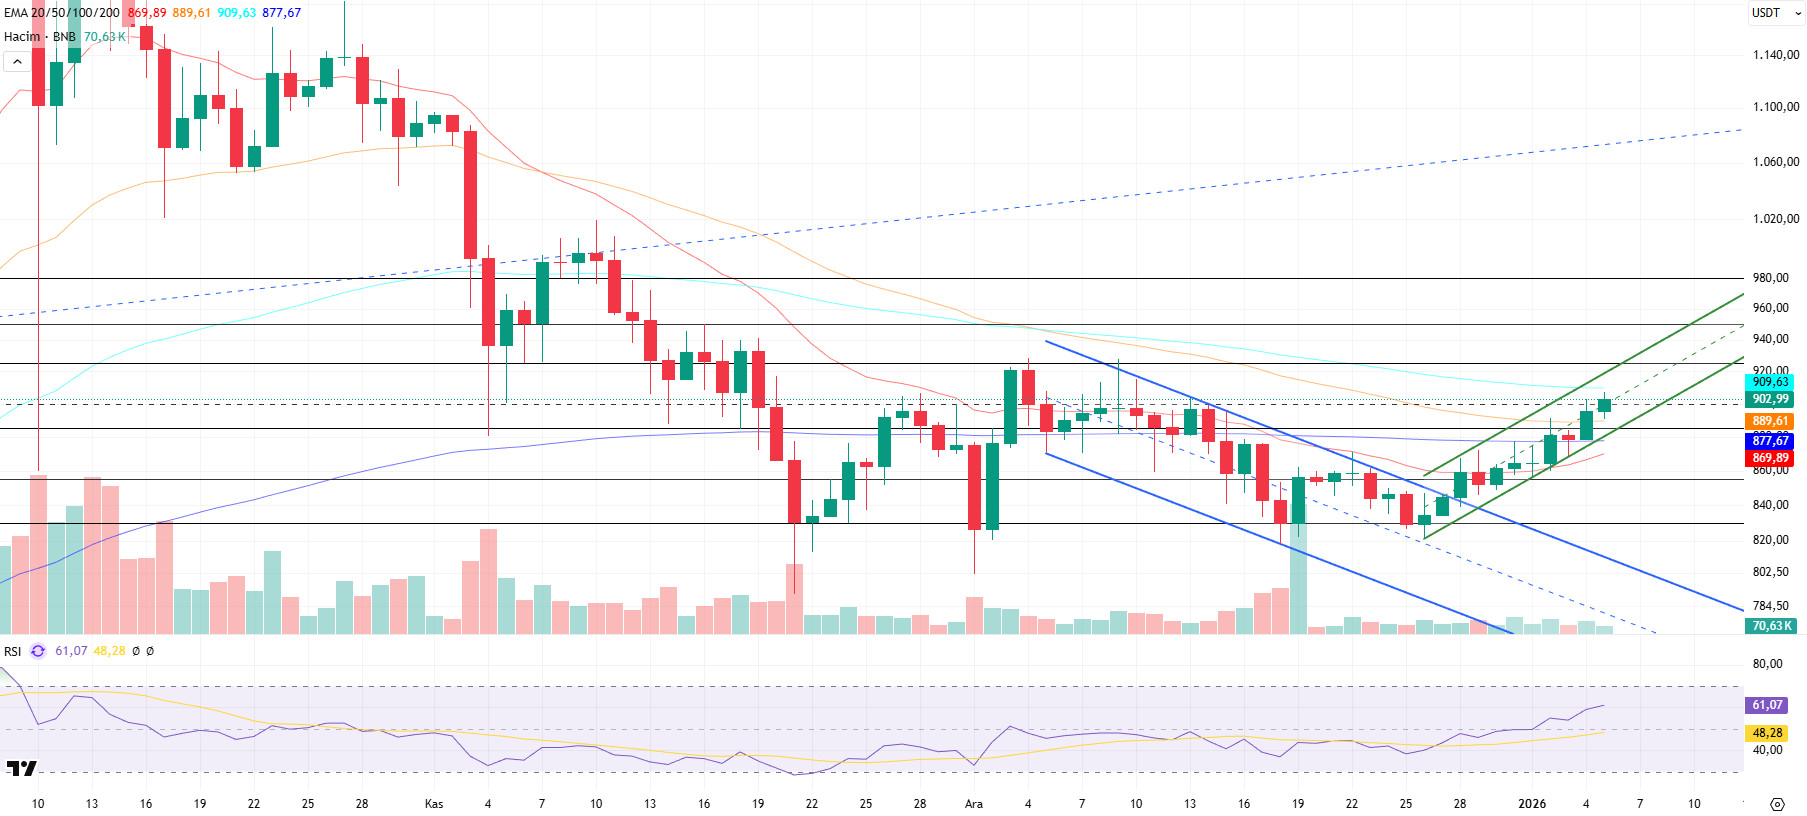
From a technical perspective, the correction that began after the all-time high (ATH) retreated to the $790 support zone indicated in our previous analyses. After consolidating at this level for a while and seeking support, BNB ended its downward momentum with the candlestick formations that formed and turned its direction upward again.
After the recovery process, the asset strengthened its upward momentum and managed to break above the upper band of the channel it was in. Accordingly, BNB exceeded its previously set target levels and reached the $900 mark. Although there is partial pressure at current price levels, the asset is considered to have maintained its overall positive structure within the rising channel.
BNB/USDT is showing a positive picture in terms of the overall outlook. If upward price movements continue, the current optimistic structure is expected to be reinforced.
Technical indicators for the asset, currently trading in the $885-$925 range, show that the increasing positive trading volume supports the upward momentum. In addition, the RSI (Relative Strength Index) indicator exceeding the 60 level is interpreted as important data supporting the technical outlook.
If buying appetite is maintained and market momentum strengthens, BNB is expected to retest the $925 resistance level in the first stage. If this level is exceeded, it appears possible to break above the falling trend line. If the trend breakout is confirmed and the price maintains stability above this region, a rise towards the $950 and $980 levels could be technically targeted.
If selling pressure increases, the price is expected to test the $885 support level first. If this level is broken downward, a pullback towards the $855 and $830 support zones may come into play.
Supports: 885 – 855 – 830
Resistances: 925 – 950 – 980
LTC/USDT
Litecoin (LTC) ended last week with a 4.48% increase against USDT and started the new week at $82.26. LTC also gained 0.45% against Bitcoin during the same period, leaving behind another positive week in terms of price performance.
Currently, Litecoin’s total market capitalization stands at approximately $6.2 billion, while it dropped one spot in the market cap rankings, falling from 19th to 20th place. On the futures front, the total open interest increased by 3.4% compared to the beginning of last week. In addition, the long/short ratio of 0.8825 at the beginning of the new week indicates that derivatives market participants are taking a more reasonable stance against possible pullbacks.
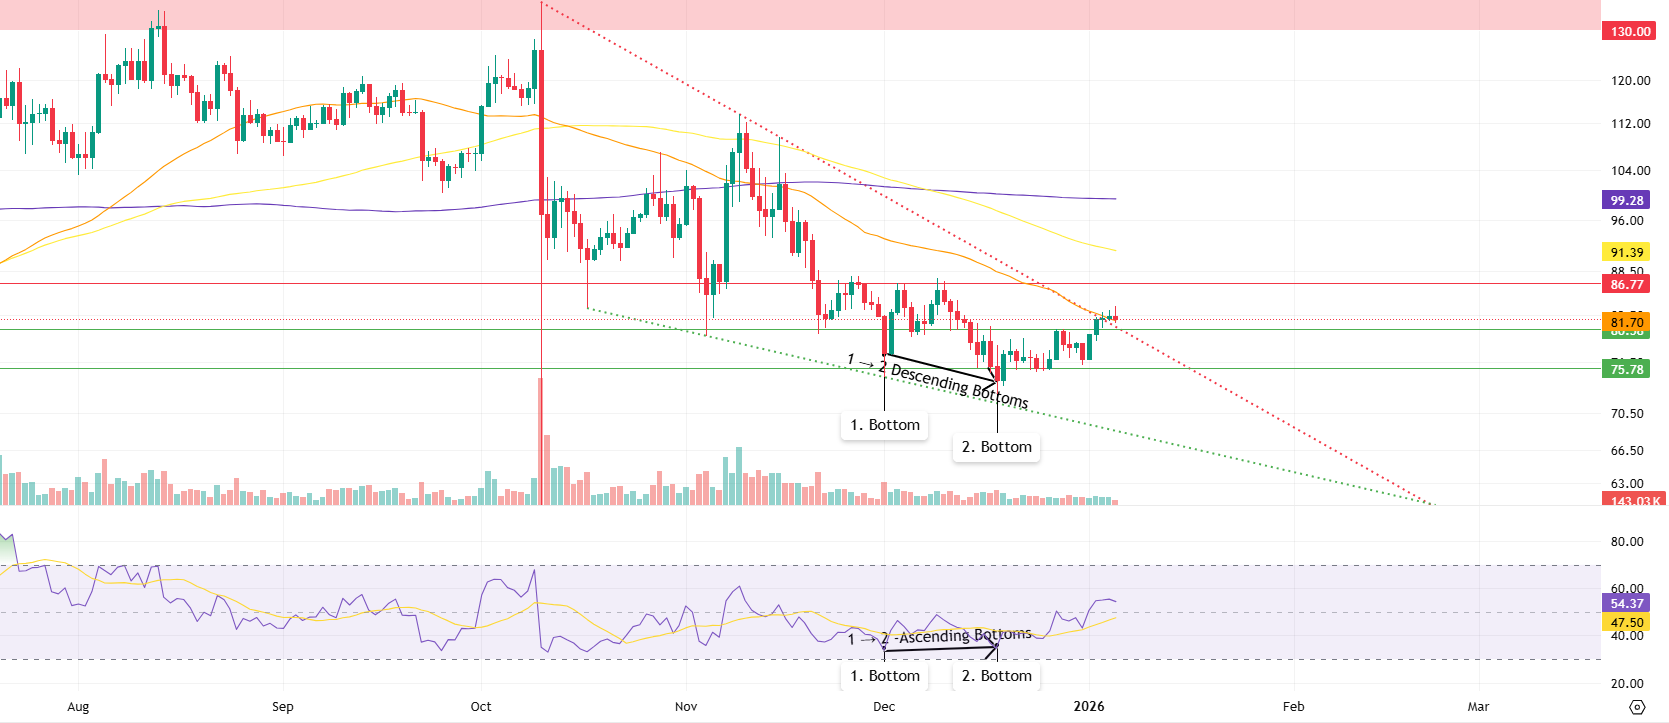
Looking at the daily candlestick chart, the Litecoin price is trading below the 100-period (yellow) and 200-period (purple) moving averages, but above the 50-period (orange) moving average. While this view could be seen as an indicator confirming that selling pressure has not yet been fully overcome, the fact that the price is forming descending bottoms on the chart, while the Relative Strength Index (RSI) values are forming rising bottoms in the same range, shows that momentum is not supporting price movement and that a bullish divergence is forming. This positive divergence stands out as one of the key technical indicators suggesting that selling pressure is weakening and the downtrend is nearing its end.
Contrary to the general expectations of derivatives market participants, the level of 86.77 horizontal resistance is being monitored as the first potential pause in any upward movement that may occur. If this level is breached, the 91.40 level, where the 100-period moving average is located, and subsequently the 99.28 level, where the 200-period moving average passes, can be monitored as potential selling pressure zones during the rise.
On the other hand, in the event of pullbacks that may occur if expectations prevail, the first reactionary buying is expected to come at the 81.70 level, where the 50-period moving average passes. This level is quite critical as a support level due to its proximity to the broken downtrend. If downward movements continue after the breakout, the 80.58 horizontal support and the 75.78 major support level stand out as the main areas where the price could hold during declines.
Supports: 81.70 – 80.58 – 75.78
Resistances: 86.77 – 91.40 – 99.28
LINK/USDT
Last week, Chainlink ETFs saw a weekly net inflow of $1.37 million, bringing the cumulative net inflow to $59.98 million. On the reserve side, as of January 2026, the dollar-based value of the reserve has reached $19.4 million, and the total reserve size has reached 1.42 million LINK. Considering the current price volatility, the average cost level of $17.07 indicates that the reserve has a relatively healthy cost structure.
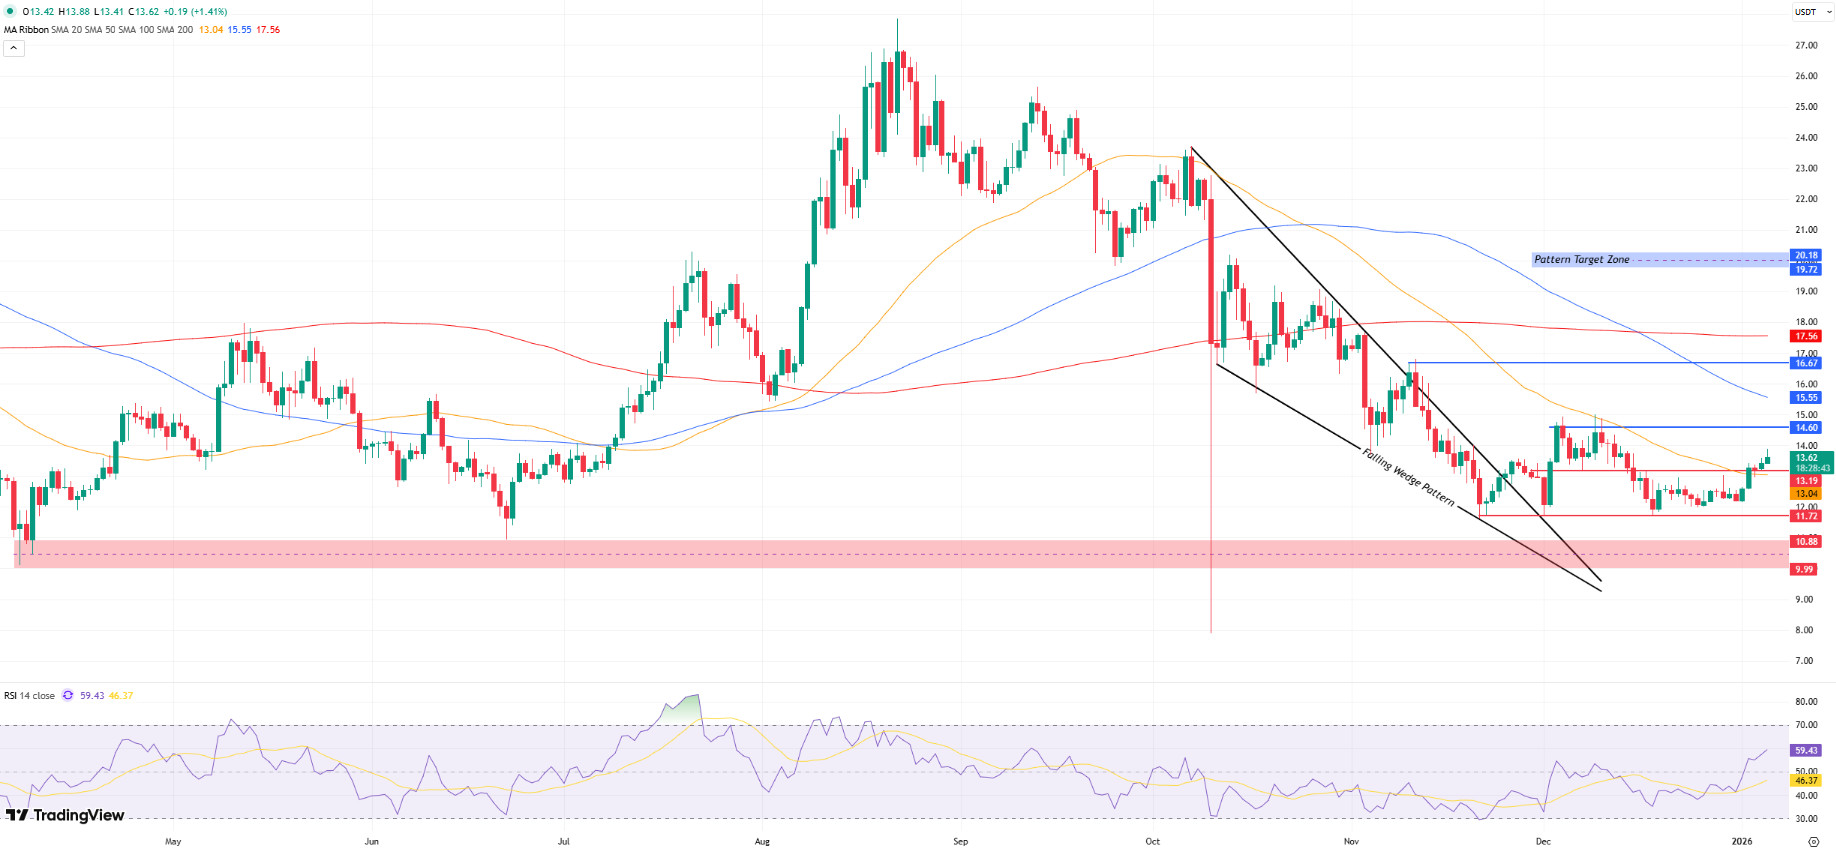
Technically speaking, the fact that the price has not fallen below the $11 region since the last week of November indicates that a strong bottom has formed in this region. Furthermore, it is possible to say that the target level of the formation structure we indicated on the chart has been maintained. With the upward formation breakout on November 25, the price retested on December 1 and did not fall below the $11.72 level, confirming the strength of this structure.
The current technical structure is quite solid. The price easily surpassing the $13.19 resistance level, positioning itself above the 50-day moving average, and maintaining stability above the $12.99 pivot level we are tracking, presents a strong picture in favor of buyers by increasing risk appetite in the markets.
At this point, the $14.60 resistance level comes to the fore for the continuation of the upward movement. This level is a strong psychological barrier that the price has tested twice in the recent past but retreated under seller pressure. Therefore, breaking above this level is critical for triggering a sharp upward movement. Otherwise, potential selling pressure encountered here could potentially pull the price back down to the $12.99 level. If the $14.60 level ( ) is broken, volatility could increase in favor of buyers, potentially reaching $16.67 first, followed by the $19 level in the medium term.
In a negative scenario, our $12.99 pivot level is particularly important as a key defense line. A loss of this level could initially cause a pullback to $11.72. If there are no signs of recovery here, the possibility of the price retreating to the $10 region could gain strength. The Relative Strength Index (RSI) is in positive territory at 58. When monitored alongside the price, if the RSI level falls below 50 in the event of a potential loss of the pivot level, momentum may weaken and selling pressure may increase.
Supports: 11.72 – 10.88 – 9.99
Resistances: 13.19 – 14.60 – 16.67
SUI/USDT
This week, there were significant and noteworthy developments in the Sui (SUI) ecosystem. On January 1, approximately 44 million Sui tokens were unlocked. This led to an increase in the circulating supply.
In addition, Sui plans to integrate native private transactions into the network. This feature aims to facilitate corporate payments while providing a privacy layer that is compliant with regulations.
Meanwhile, the Walrus integration update aims to enhance data storage quality, positioning Sui as a more attractive option for verifiable AI use cases. This development is expected to make Sui one of the leading networks in this field by providing a more robust and transparent data infrastructure, especially in verifiable AI applications.
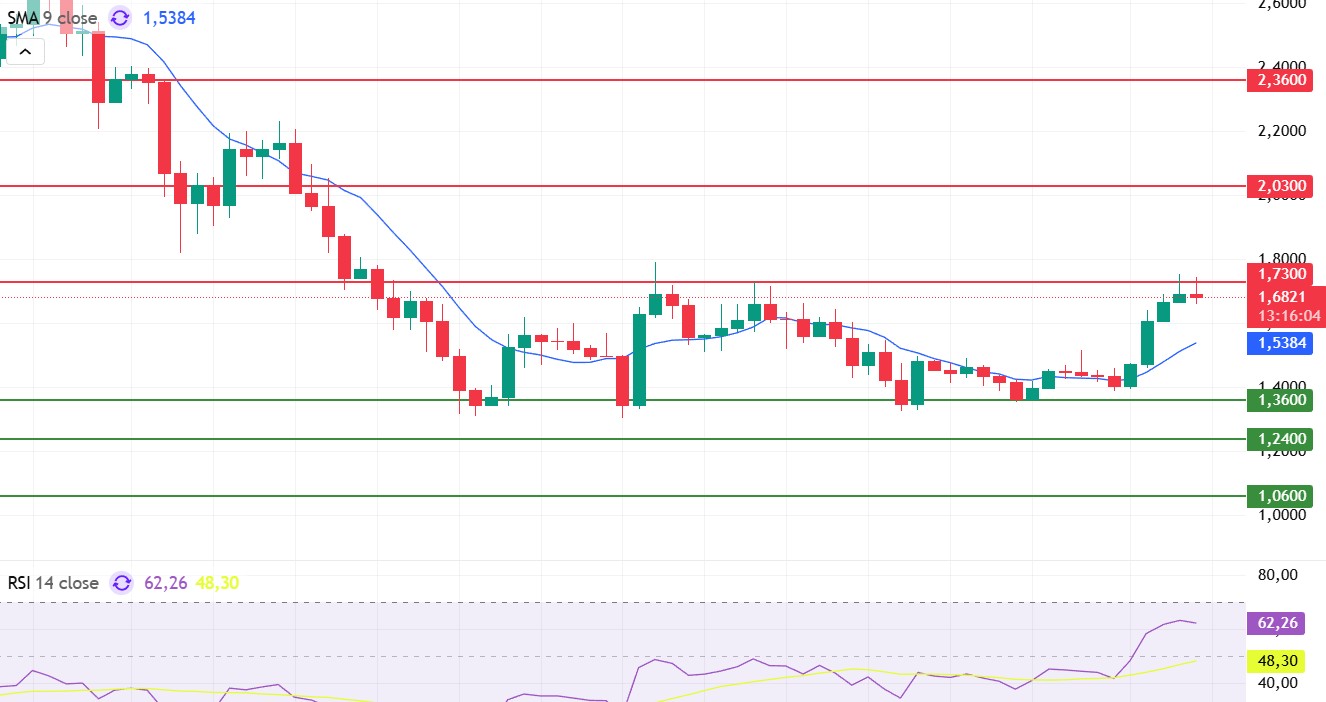
Looking at Sui’s technical outlook following recent developments, we see that the price has been moving sideways at around $1.68 on a weekly basis, influenced by fundamental developments. The Relative Strength Index is currently in the range of 62.26 – 48.30. This range indicates that the market is trading close to the sell zone; however, if the RSI continues above the 40.00 – 45.00 range in these areas, it could signal a potential sell. If the price moves upward, the resistance levels of $1.73, $2.03, and $2.36 can be monitored. However, if the price falls to new lows, it may indicate that selling pressure could deepen. In this case, the support levels of $1.36, $1.24, and $1.06 come to the fore. Based on the trend line, a pullback to $1.06 appears technically possible. According to Simple Moving Averages (SMA) data, Sui’s average price is currently at $1.53. The price remaining above this level indicates that the current uptrend could technically continue.
Support levels: 1.06 – 1.24 – 1.36
Resistances 1.73 – 2.03 – 2.36
ADA/USDT
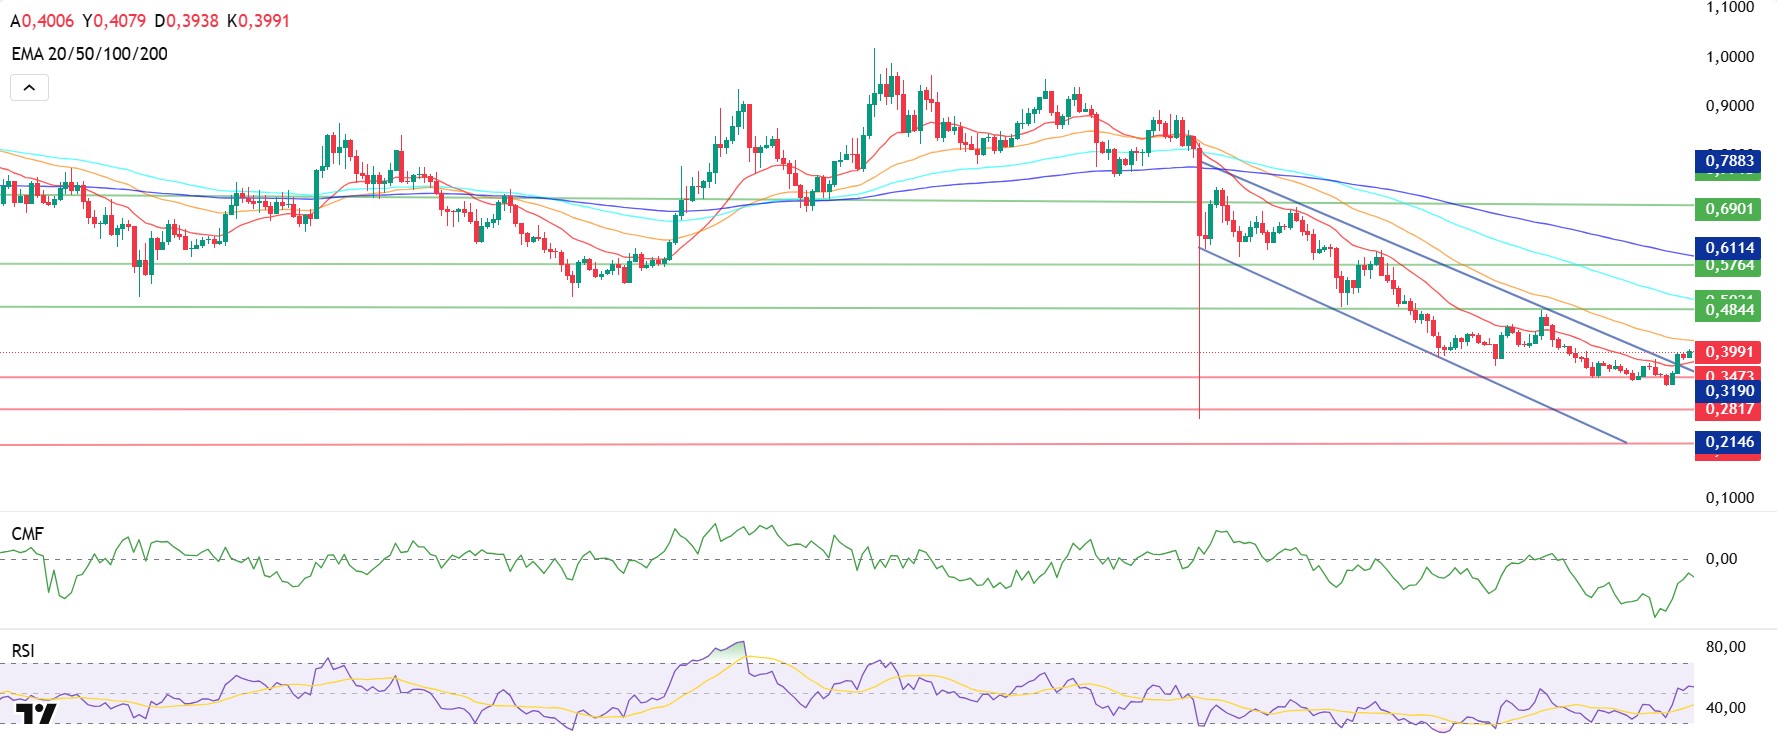
Since last week, the ADA price has gained 7.41% in value, rising to $0.3946. Cardano continues to price in line with market expectations in the first week of the new year. It is beginning preparations for more secure data transmission in 2026. Cardano users are currently facing a wallet phishing campaign, with claims that the new phishing campaign is linked to the new Eternl Desktop application. Cardano users, who provide remote access for hackers to carry out their activities on the ADA network, are now the target of a new wallet phishing campaign. The sophisticated phishing campaign is currently circulating within the community and poses significant risks for users looking to download the newly announced Eternl Desktop application. Hackers are crafting emails claiming to promote a legitimate wallet solution designed for secure Cardano staking and governance participation. Efforts are underway within Cardano groups to counter this.
Technically speaking, although the price continues to trade below the 50-day and 200-day Exponential Moving Average (EMA 50 – Orange Line) (EMA 200 – Blue Line), it is priced above the downtrend channel by closing above the 20-day EMA (Red Line). , the price level of $0.4844 can be monitored as the first resistance level to see if the price can maintain stability at these levels. If it rebounds from here, the upward movement is expected to continue to the second resistance point at the $0.5764 level. These levels indicate that ADA buyers are willing to buy at higher prices, showing that buying pressure is increasing over time. While the Relative Strength Index (RSI) continues to rise to 56 levels in the buying zone, the Chaikin Money Flow (CMF-20) remains at -0.07 levels, indicating that the price is trading in the selling zone. If the price falls as a result of the macroeconomic data expected to be announced this week and the statements to be made by US President Trump, the important levels we will follow are $0.3473 and $0.2817. If it closes below this level, the support point of $0.2146 may come to the fore.
Supports: 0.3473 – 0.2817 – 0.2146
Resistances: 0.6901 – 0.6114 – 0.4844
Legal Notice
The investment information, comments, and recommendations contained in this document do not constitute investment advisory services. Investment advisory services are provided by authorized institutions on a personal basis, taking into account the risk and return preferences of individuals. The comments and recommendations contained in this document are of a general nature. These recommendations may not be suitable for your financial situation and risk and return preferences. Therefore, making an investment decision based solely on the information contained in this document may not result in outcomes that align with your expectations.

