
Technical Analysis – January 14, 2026
BTC/USDT
Comments from Fed officials Musalem and Barkin indicating that an interest rate cut is not on the agenda in January showed that the Fed will not act hastily, despite moderate CPI and core inflation. While the tone from the Trump camp softened somewhat during the investigation into Powell, warnings emerged that the investigation could jeopardize Senate confirmation processes and market stability. Trump’s search for a new Fed chair, populist measures targeting credit card interest rates, and the escalation of military scenarios regarding Iran showed that both political and geopolitical risks remain high on the market agenda.
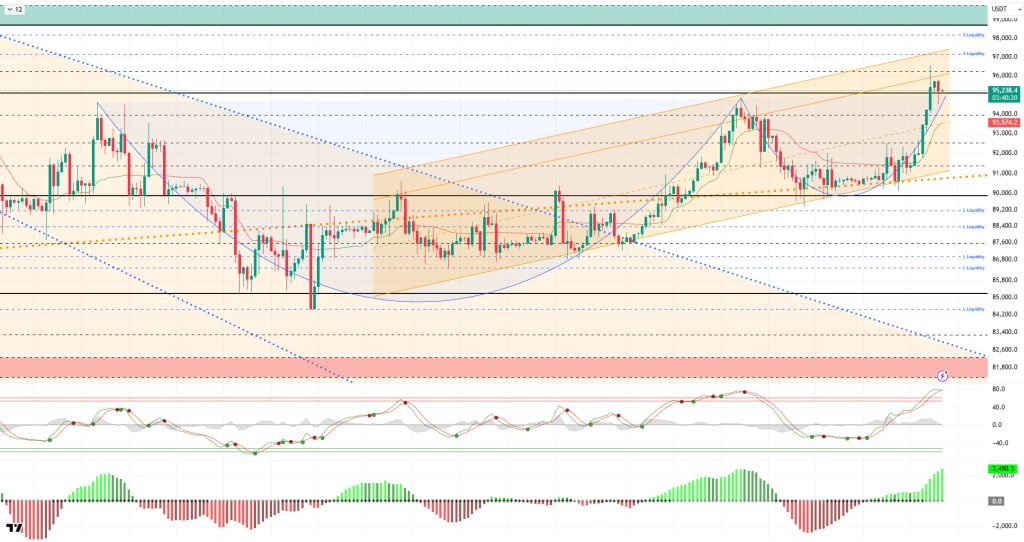
From a technical perspective, BTC broke above the 92,600 level, which was acting as resistance parallel to the upward channel, achieving an upward breakout. The price, which had been testing the major upward trend line for a long time but failed to close below this level, rose to around 96,400 with increasing momentum. This movement also completes the cup-and-handle formation, with BTC now attempting to maintain stability above the critical 95,000 level. In the short term, losing this level could trigger a correction in the price. In this scenario, the next important support level to watch will be 94,000.
Technical indicators show the Wave Trend (WT) oscillator moving above the overbought zone, preparing for a sell signal, while the histogram on the Squeeze Momentum (SM) indicator gained maximum momentum within the positive zone. The Kaufman Moving Average (KAMA) is currently trading below the price level at $93,574.
When examining liquidation data, the buy level first formed intense accumulation within the 88,000–90,000 band, then became a liquidity area at 93,300 with the latest rise. In contrast, the sell level was liquidated within the 92,600–96,500 band.
In summary, the US Senate revealed that Trump has adopted a more moderate tone in his statements regarding Powell, who is under investigation, on the grounds that market stability could be jeopardized. Following the release of macroeconomic data, expectations of a Fed interest rate cut appear to be shifting to a later date. On the other hand, while Trump maintains his populist rhetoric in his campaign statements, the possibility of military scenarios against Iran appears to be gaining momentum.
Looking at liquidation data, long-term sell-side transactions became the target and were liquidated following the recent breakout. In technical terms, BTC started the new year with positive momentum, continuing its parallel movement with the upward channel and rising to 94,800 levels. Although the price retreated to the 89,300 region with profit-taking, it managed to recover and tested the 96,400 level with the momentum it gained. The 95,000 level will be monitored as a critical reference area, with closes above it being an important indicator for regaining momentum. Otherwise, 94,000 will be the short-term support, while 93,300 will be monitored as a liquidity area.
Supports: 94,000 – 93,300 – 92,600
Resistances: 96,200 – 97,000 – 98,000
ETH/USDT
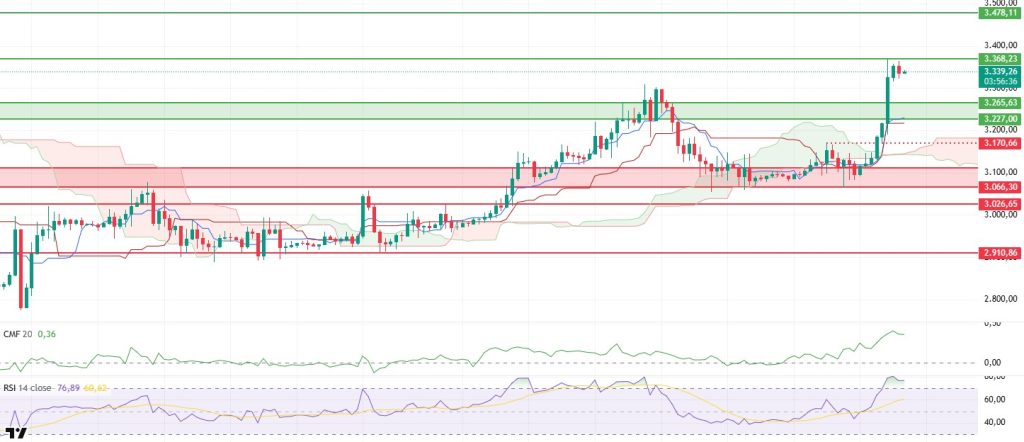
The ETH price strongly priced in the macro-driven relief yesterday evening. With US inflation data in line with expectations, risk appetite rose rapidly and the $3,170 intermediate resistance was clearly broken. After this breakout, buying intensified, pushing the price up to the $3,368 resistance level. Following profit-taking, the ETH price is currently seeking equilibrium around $3,330, pointing to a natural correction after a strong rally.
The liquidity picture is quite strong. The Chaikin Money Flow (CMF) recorded a sharp rise in positive territory, indicating that the rally was supported by strong liquidity inflows.
On the momentum front, the RSI has moved into the overbought zone, and a negative divergence increases short-term pullback risk. While momentum remains strong, a short-term breather should not be overlooked.
From an Ichimoku perspective, the outlook remains clearly positive. The price is above the Kumo cloud, trading above Tenkan and Kijun, confirming that the main trend remains upward.
However, caution is warranted. CVD spot has started to pull back, and the rapid rise in funding rates signals heavy long positioning, increasing sensitivity near resistance levels.
Overall, $3,368 is the key threshold. Failure to break above it keeps pullback risk alive, with $3,227 standing out as critical support. If the price holds above $3,368, downside risks largely fade and the uptrend may resume.
Supports: 3,265 – 3,227 – 3,066
Resistances: 3,368 – 3,478 – 3,657
XRP/USDT
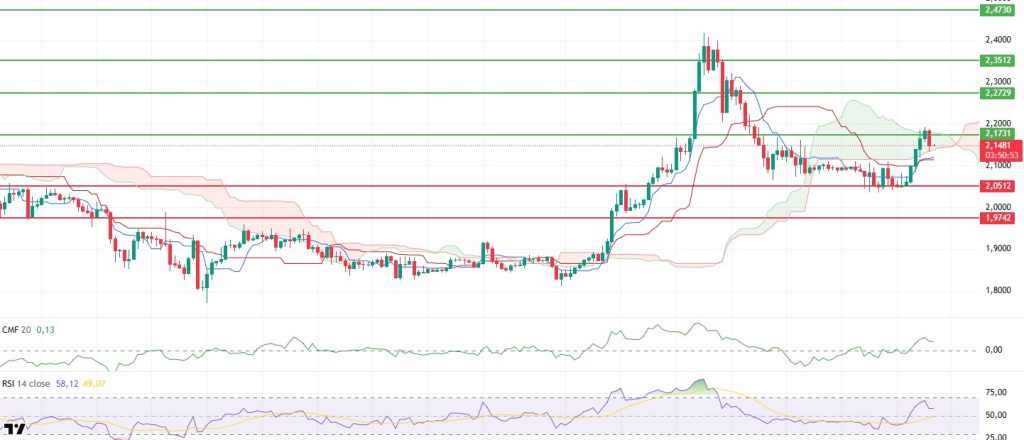
XRP moved upward from the $2.05 region, breaching the critical $2.17 level, but failed to hold above it. After selling pressure, the price stabilized around $2.15, showing indecision despite rising momentum.
Liquidity conditions improved, with CMF moving back into positive territory, supporting healthier buying activity.
Momentum also recovered as RSI rose above 50, signaling renewed buyer strength. Ichimoku indicators show the price above Tenkan and Kijun and inside the Kumo, easing short-term pressure.
Overall, $2.17 remains the key level. A clear break above it would support continuation, while staying below keeps downside pressure active.
Supports: 2.0500 – 1.9742 – 1.9005
Resistances: 2.1731 – 2.2729 – 2.3512
SOL/USDT
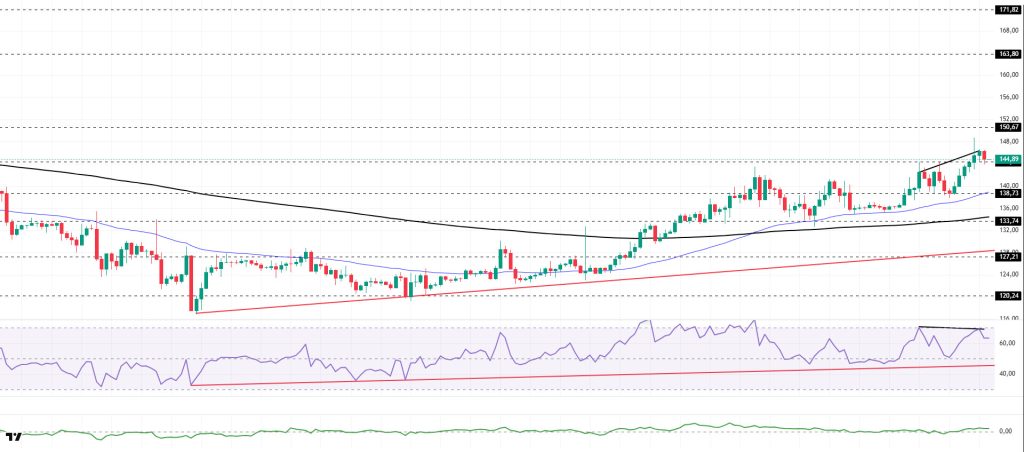
SOL maintained strength above the upward trend started on December 18, recovering from $138.73 support. Holding above $144.35 keeps the door open for a move toward $150.67.
On the 4-hour chart, 50 EMA remains above 200 EMA, signaling a developing medium-term uptrend. CMF moved into positive territory, while RSI remains above its uptrend, though negative divergence should be monitored.
A break above $163.80 would strengthen bullish continuation. Pullbacks toward $133.74 may present potential buying opportunities.
Supports: 144.35 – 138.73 – 133.74
Resistances: 150.67 – 163.80 – 171.82
DOGE/USDT
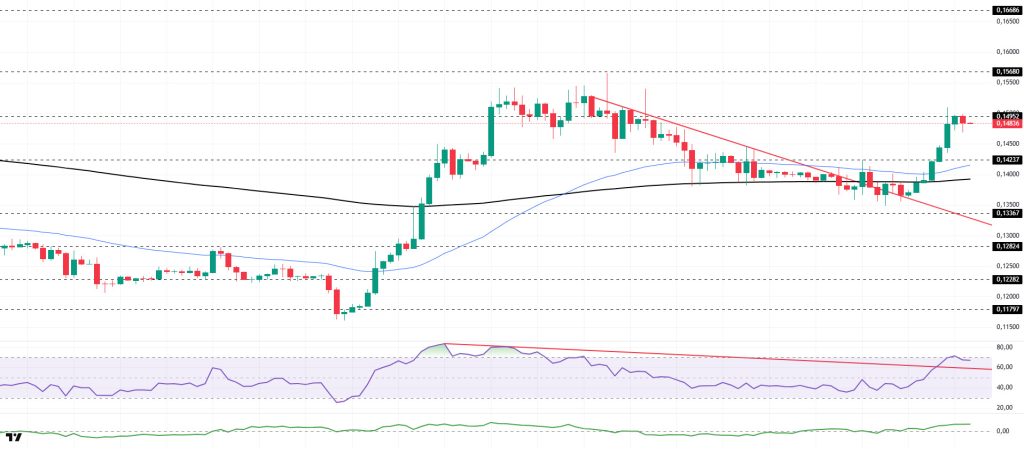
DOGE broke above both 50 EMA and 200 EMA, currently testing $0.14952 resistance. A close above this level could open the way to $0.15680.
On the 4-hour chart, EMA structure supports an emerging uptrend, CMF remains positive, and RSI moved into overbought territory, which may invite profit-taking.
A move toward $0.16686 is possible with positive news flow, while $0.13367 stands out as downside support.
Supports: 0.14237 – 0.13367 – 0.12824
Resistances: 0.14952 – 0.15680 – 0.16686
SHIB/USDT
The Shiba Inu ecosystem agenda focused on K9 Finance DAO’s post-Shibarium roadmap evaluation, signaling a data-driven approach to ecosystem sustainability.
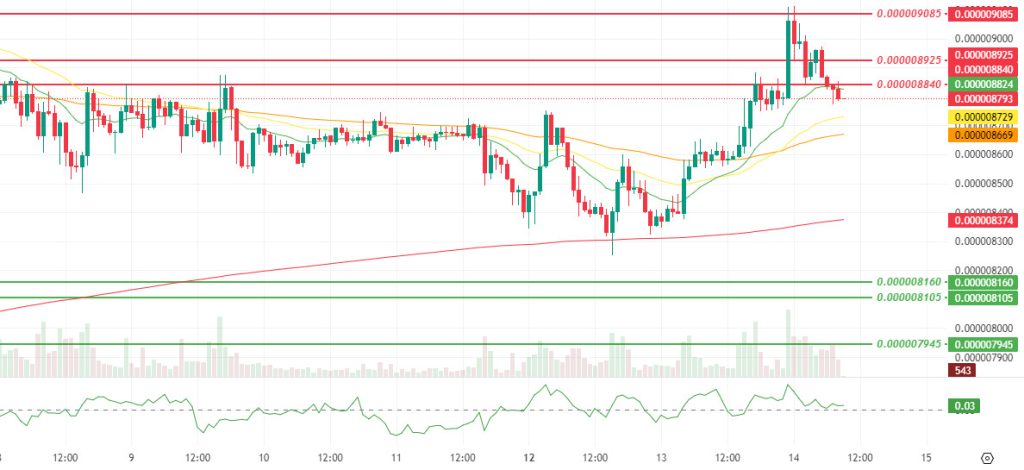
Technically, after breaking $0.000008625, price extended to $0.000009085 but failed to sustain, pulling back toward $0.000008840. Volume declined and momentum cooled, while CMF remained positive, indicating no full distribution.
Staying above $0.000008840 and reclaiming $0.000008925 could allow a second attempt at $0.000009085. Losing this level raises false breakout risk, with downside toward $0.000008625.
Supports: 0.000008160 – 0.000008105 – 0.000007945
Resistances: 0.000008840 – 0.000008925 – 0.000009085
Legal Notice
The investment information, comments, and recommendations contained herein do not constitute investment advice. Investment advisory services are provided individually by authorized institutions, taking into account individual risk and return preferences. The comments and recommendations are of a general nature and may not be suitable for your financial situation. Decisions made solely based on this information may not produce results in line with expectations.

