
BTC/USDT
Trump’s direct appeal to the Supreme Court, the Fed’s emphasis on independence, and strong US macro data were the highlights of the day. Trump’s rhetoric, which presented the trade deficit and growth performance as successes of tariff policies, intersected with the judicial process, while Fed officials pointed out that political pressure was essentially a monetary policy debate. Meanwhile, retail sales and PPI data exceeding expectations signaled vitality on the demand and cost sides, while messages from the Senate Banking Committee regarding the CLARITY Act indicated an acceleration in the search for clarity in crypto regulations.
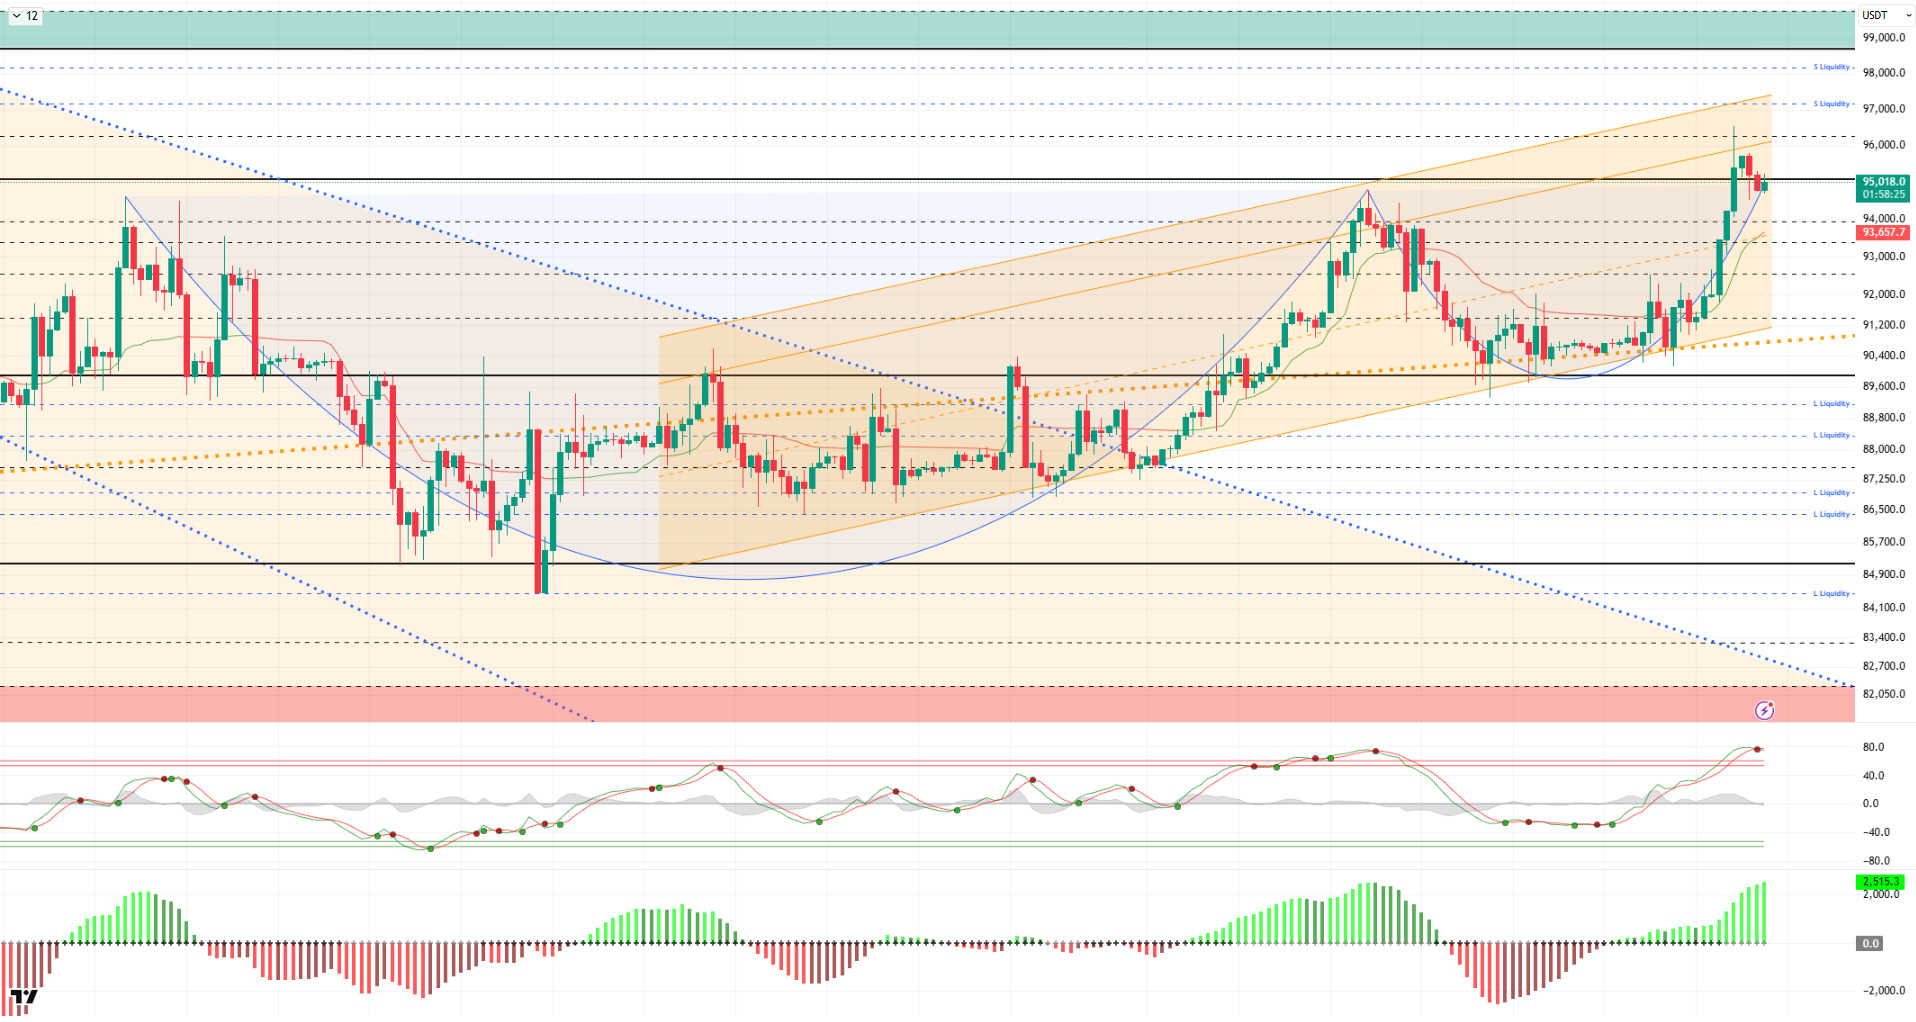
From a technical perspective, BTC broke above the 92,600 level, which was a parallel resistance level to the upward channel, achieving an upward breakout. The price, which had been testing the major upward trend line for a long time but failed to close below this level, rose to the 96,400 level with increasing momentum.With this movement, the cup-and-handle formation appears to have been completed, and BTC is trying to maintain stability above the critical level of 95,000 during the day. In the short term, losing this level could bring a correction movement to the price. In this scenario, the next important support level will be monitored at 94,000.
Technical indicators show the Wave Trend (WT) oscillator moving above the overbought zone, signaling a sell, while the histogram on the Squeeze Momentum (SM) indicator gained maximum momentum within the positive zone. The Kaufman Moving Average (KAMA) is currently trading below the price at $93.645.
When examining liquidation data, the buy level first formed intense accumulation within the 88,000–90,000 band, then became a liquidity area at 93,300 with the latest rise. In contrast, the sell level was liquidated within the 92,600–96,500 band.
In summary, Trump argued that the Supreme Court should evaluate the impact of tariffs, citing the announced macroeconomic data. While the Fed emphasized its independence, attention turned to details of the Clarity Act, which will be discussed in the Senate tomorrow. Looking at liquidation data, long-term sell-side transactions became the target and were liquidated following the recent breakdown.Technically, BTC started the new year with positive momentum, continuing its parallel movement with the upward channel and rising to the 94,800 level. Although the price retreated to the 89,300 region with profit-taking from this point, it managed to recover and tested the 96,400 level with the momentum it gained. In the next phase, the 95,000 level will be monitored as a critical reference area, with closes above it being an important indicator for regaining momentum. Otherwise, 94,000 will be the short-term support, while 93,300 will be monitored as a liquidity area.
Supports: 94,000 – 93,300 – 92,600
Resistances: 96,200 – 97,000 – 98,000
ETH/USDT
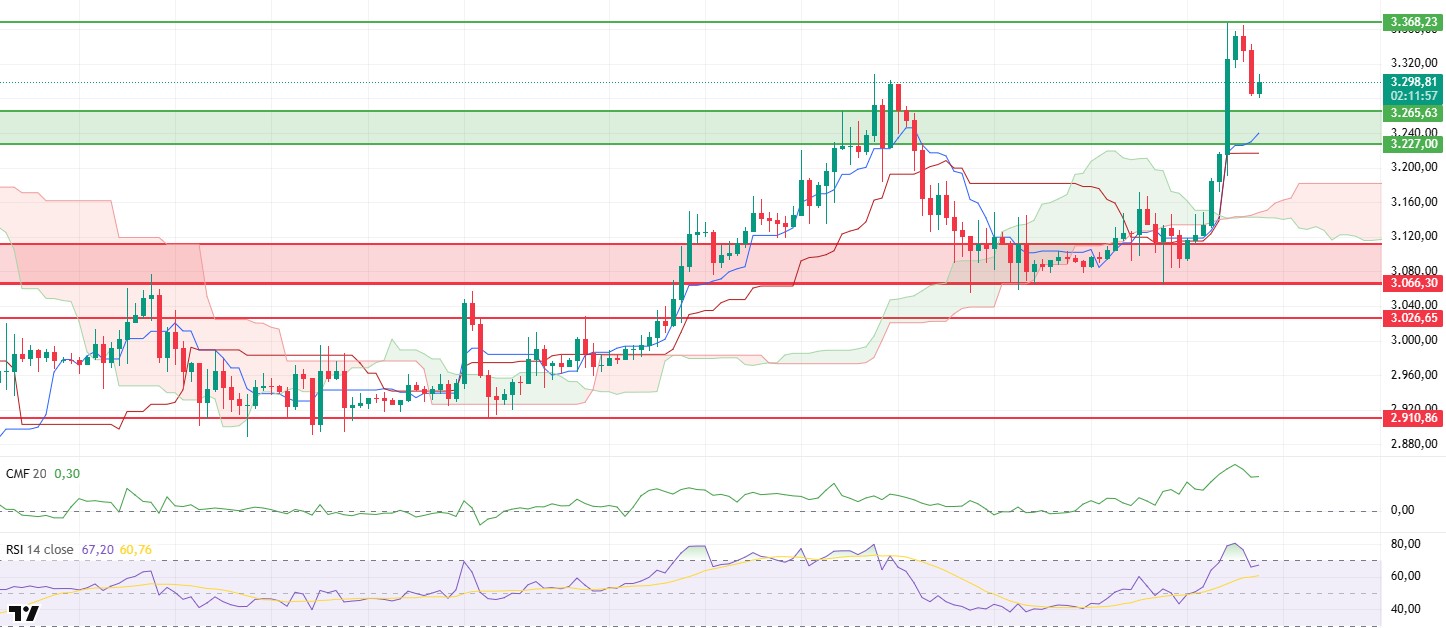
After testing a peak in the morning hours, the ETH price experienced an expected pullback during the day and fell to the $3,280 level. The price recovered as buying resumed in this region and is currently attempting to hold around $3,300. The controlled pullback indicates that the upward momentum has not completely disappeared and buyers are still active.
The liquidity outlook remains strong. The Chaikin Money Flow (CMF) continues to move in positive territory. This structure indicates that despite the pullback, the money entering the market is dominant and that sales have not turned into a liquidity-driven unwinding. Maintaining liquidity flow is an important factor that enables the price to find support more quickly at lower levels.
The momentum front has reached a more balanced point. Although the Relative Strength Index (RSI) has moved out of the overbought zone, it maintains its upward trend. The continued negative divergence on the RSI serves as a reminder to be cautious about upward price movements. Momentum remains strong, but the risk of short-term volatility and pullbacks has not completely disappeared.
The technical outlook has not changed from the Ichimoku indicator perspective and maintains its positive structure. The price continues to remain above the Kumo cloud. The Tenkan and Kijun levels are also in a supportive position. This picture indicates that the main trend is upward and that the recent pullback has remained within technical limits.
In general, price behavior is progressing in line with the scenario outlined this morning. The $3,368 level remains the main resistance level to be overcome on the upside. Until this area is breached, it is normal for the price to experience occasional pullbacks. On the downside, the support zone highlighted in green on the chart retains its importance. The $3.227 level, in particular, remains a critical threshold to monitor during the day.
Supports: 3,074 – 3,019 – 2,910
Resistances: 3,227 – 3,265 – 3,368
XRP/USDT
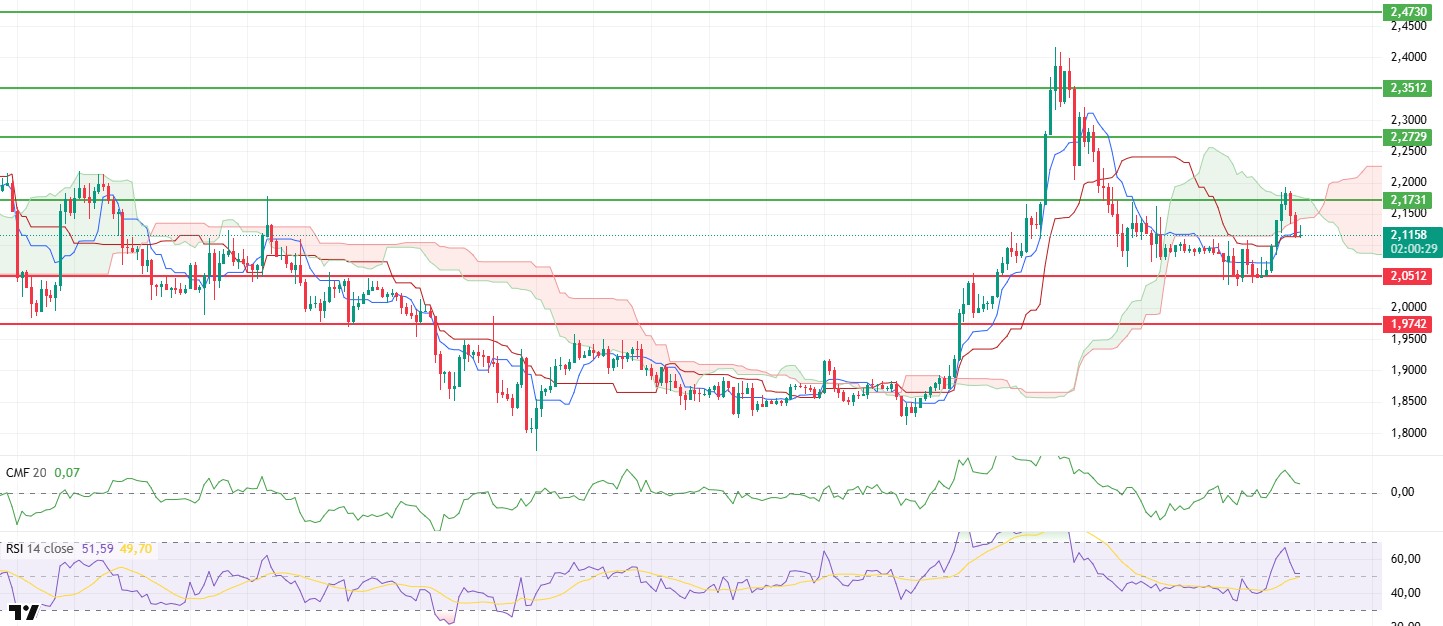
The XRP price failed to hold steady around the $2.17 level in the morning hours and continued to retreat under selling pressure, falling to the $2.11 level. The failure of the upward attempt to continue indicates that buyers have not been able to gather sufficient strength at this stage. The price returning to the lower bands suggests a cautious stance in the short-term outlook.
The liquidity picture is starting to weaken. The Chaikin Money Flow (CMF) is still in positive territory but appears to be turning downward. This trend indicates that money is starting to flow out of the market and that pressure on the liquidity side is gradually shifting to sellers. As liquidity support weakens, it becomes more difficult for the price to generate upward movement.
A similar deterioration is also noticeable on the momentum front. The Relative Strength Index (RSI) has fallen below the 50 level again. This movement indicates that momentum has lost its strength and buyers are beginning to relinquish control in the short term. This reversal in the RSI signals that recovery expectations have been postponed for now.
The technical outlook has also turned negative from the Ichimoku indicator perspective. The price has fallen below the Kumo cloud again and retreated to the Tenkan and Kijun levels. This pattern indicates increased short-term technical pressure and weak upward attempts. For a technical recovery to be discussed, these levels need to be surpassed again.
The main threshold in the overall picture has not changed. Unless the $2.17 level is exceeded, the XRP price is expected to continue its downward movement. However, if this region is clearly gained, the current negative structure could reverse and open up a new upward path for the price. At this stage, the XRP price remains under pressure and requires strong buyer confirmation for the trend to turn positive again.
Supports: 2.0500 – 1.9742 – 1.9005
Resistances: 2.1731 – 2.2729 – 2.3512
SOL/USDT
Upexi expanded the Solana treasury by 12% with a $36 million Hivemind agreement.
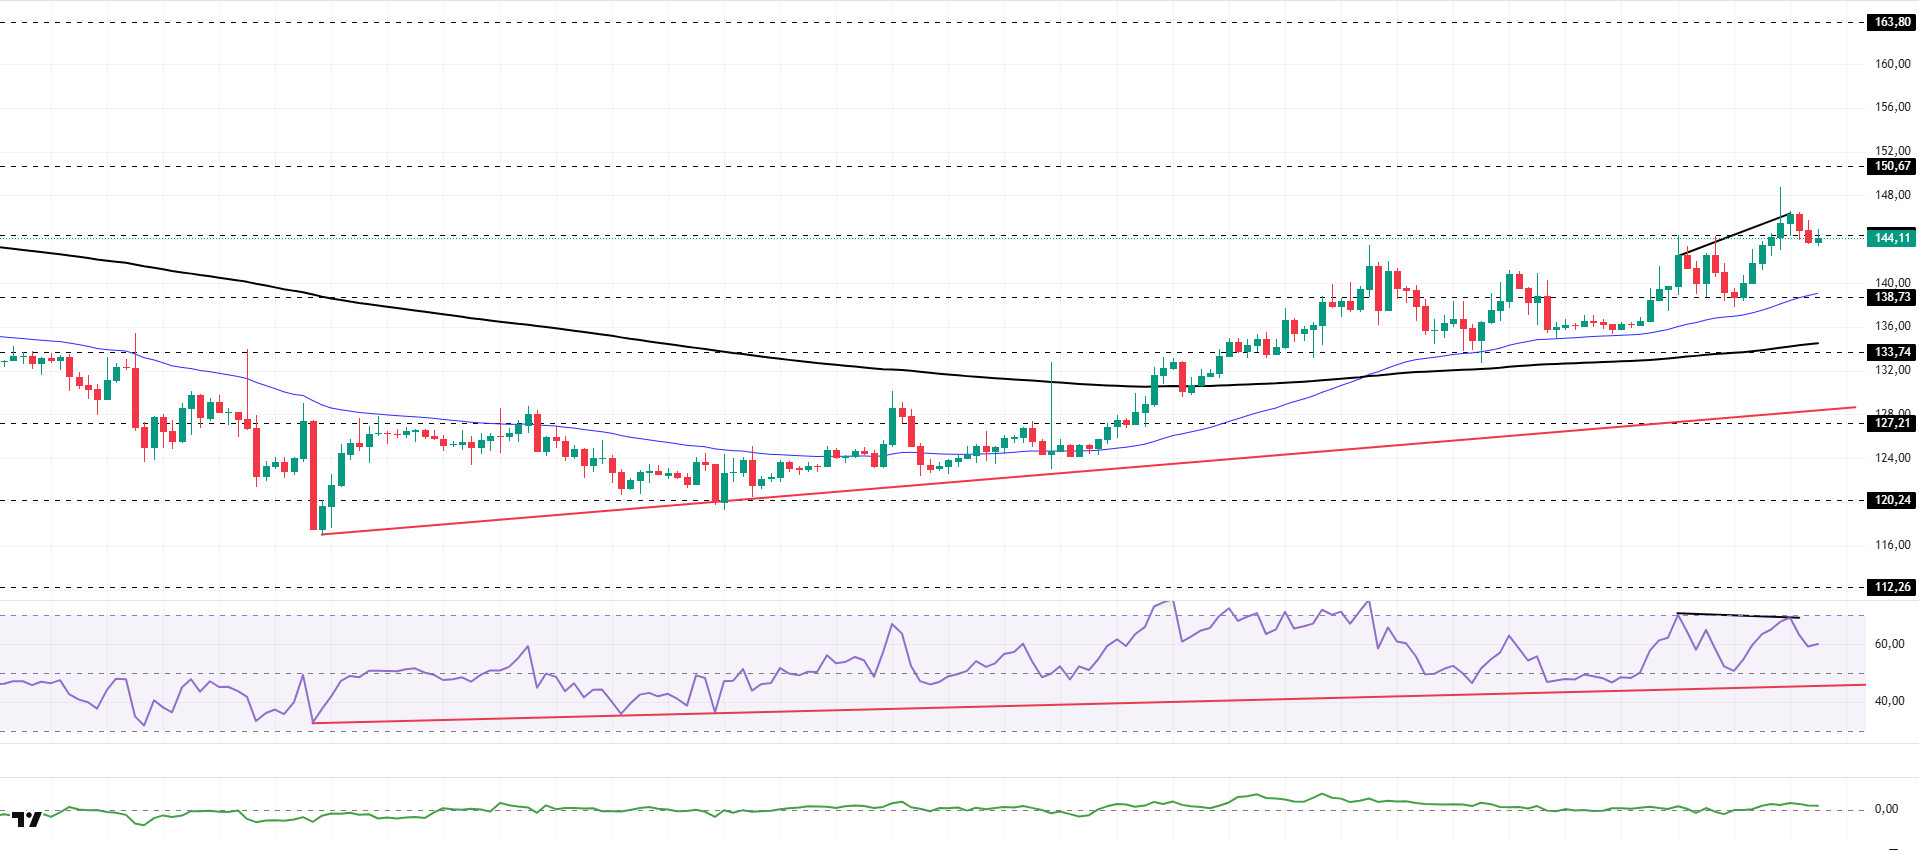
SOL price remained flat during the day. The asset continued to trade in the upper region of the upward trend that began on December 18. Testing the $138.73 level as support, the price recovered its losses and showed an upward trend. Currently testing the strong resistance level of $144.35, the price could test the $150.67 level if it manages to stay above this level. In case of a pullback, it could test the 50 EMA (Blue Line) moving average as support.
On the 4-hour chart, the 50 EMA (Exponential Moving Average – Blue Line) remained above the 200 EMA (Black Line). This indicated that an uptrend could begin in the medium term. At the same time, the price being above both moving averages signaled that the asset was trending upward in the short term. The Chaikin Money Flow (CMF-20) remained in positive territory. However, a decrease in money inflows could push the CMF into negative territory. The Relative Strength Index (RSI-14) continued to remain above the upward trend that began on December 18. On the other hand, negative divergence should be monitored. In the event of an upward movement due to macroeconomic data or positive news related to the Solana ecosystem, the $163.80 level stands out as a strong resistance point. If this level is broken upwards, the rise is expected to continue. If pullbacks occur due to developments in the opposite direction or profit-taking, it may test the $133.74 level. If it falls back to these support levels, an increase in buying momentum may present a potential upside opportunity.
Supports: 138.73 – 133.74 – 127.21
Resistances: 144.35 – 150.67 – 163.80
DOGE/USDT
A Senate bill could exempt Dogecoin from SEC securities laws based on its current ETF trading status.
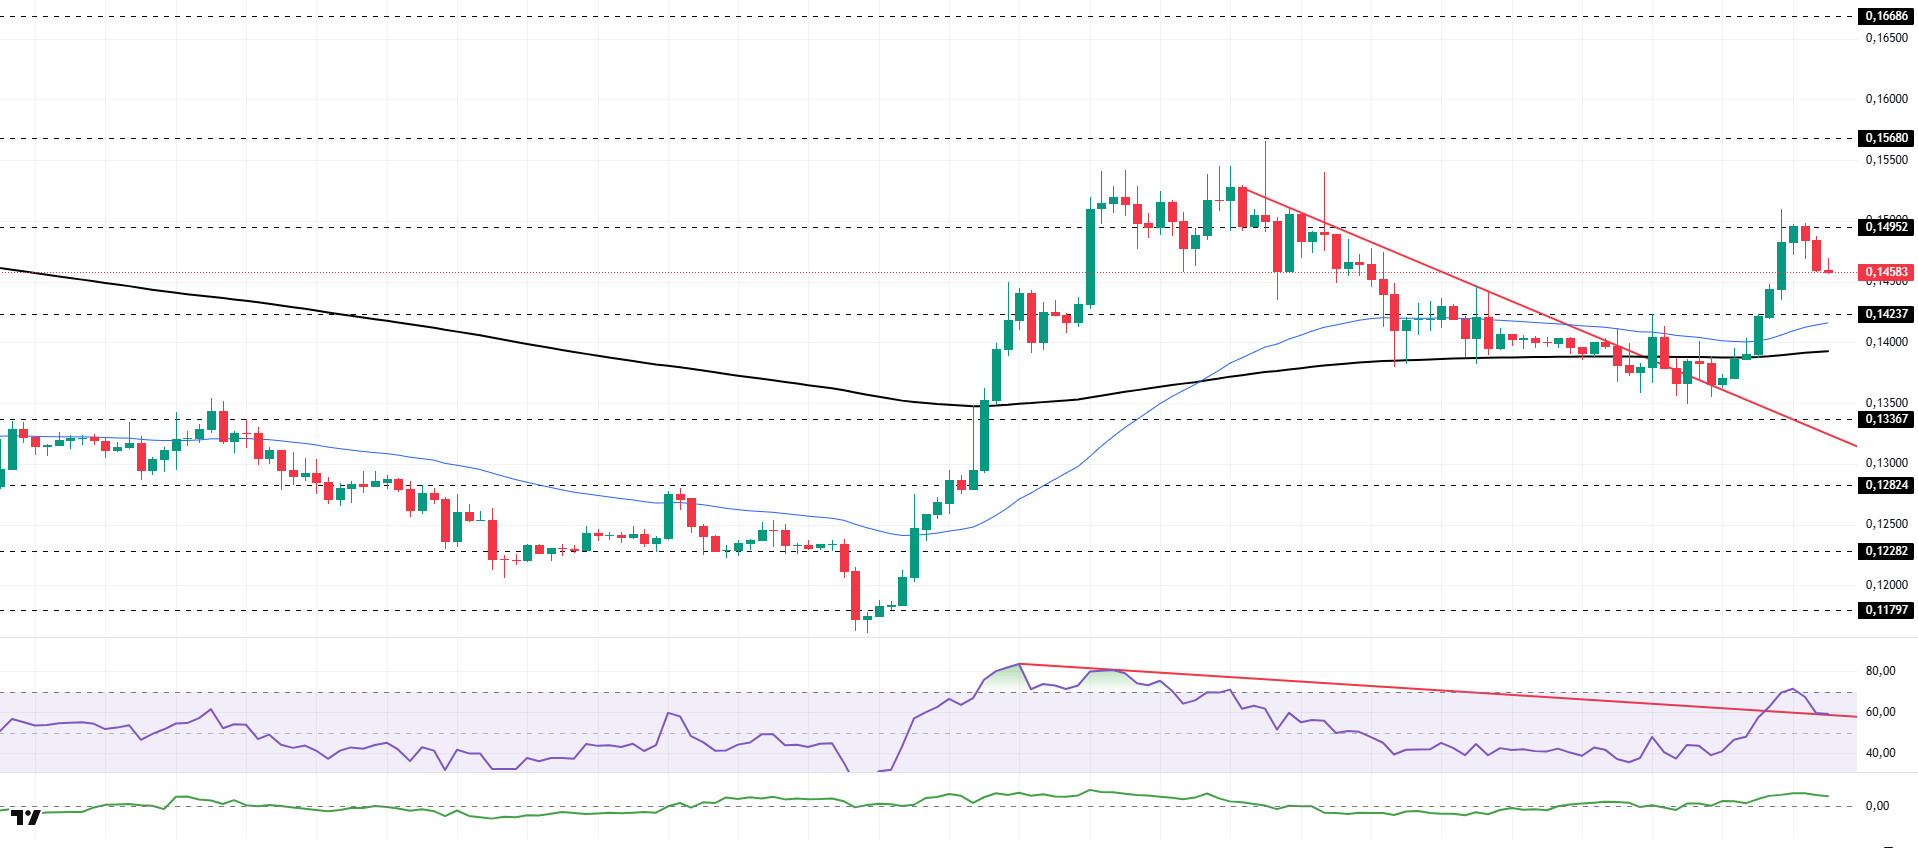
The DOGE price lost slight value during the day. The asset continued to trade in the upper region of the downtrend that began on January 6. However, after breaking above the 200 EMA (Black Line) and 50 EMA (Blue Line) moving averages, the asset experienced a slight pullback from the strong resistance level of $0.14952. If it closes above this level, it could test the $0.15680 level as resistance. If the pullback continues, it could test the 50 EMA moving average or the $0.14237 level as support.
On the 4-hour chart, the 50 EMA (Exponential Moving Average – Blue Line) remained above the 200 EMA (Black Line). This indicated that an uptrend was forming in the medium term. The price being above both moving averages indicates that the price is trending upward in the short term. The Chaikin Money Flow (CMF-20) managed to stay in positive territory. Additionally, a decrease in cash inflows could push the CMF into negative territory. The Relative Strength Index (RSI-14) rose from neutral levels to the overbought zone. This could trigger profit-taking. It is also currently testing the downward trend that began on January 3. A break below this level could lead to selling pressure. In the event of an uptrend driven by political developments, macroeconomic data, or positive news flow in the DOGE ecosystem, the $0.16686 level stands out as a strong resistance zone. Conversely, in the event of negative news flow, the $0.13367 level could be triggered. A decline to these levels could increase momentum and initiate a new wave of growth.
Supports: 0.14237 – 0.13367 – 0.12824
Resistances: 0.14952 – 0.15680 – 0.16686
SHIB/USDT
Later in the day, a chain vote clarified the practical scope of Option 5 in the K9 Finance DAO forum within the Shiba Inu ecosystem. The opened thread reframes the two-phase plan to shut down Shibarium operations to reduce costs and reissue the KNINE supply lost to exploitation on a new chain, specifically emphasizing that the upcoming vote will only focus on where the stolen supply will be minted and does not imply a new product launch or a new roadmap. In this context, while Base and BNB Chain options are highlighted, the door is open for the community to propose alternative chains with justification.
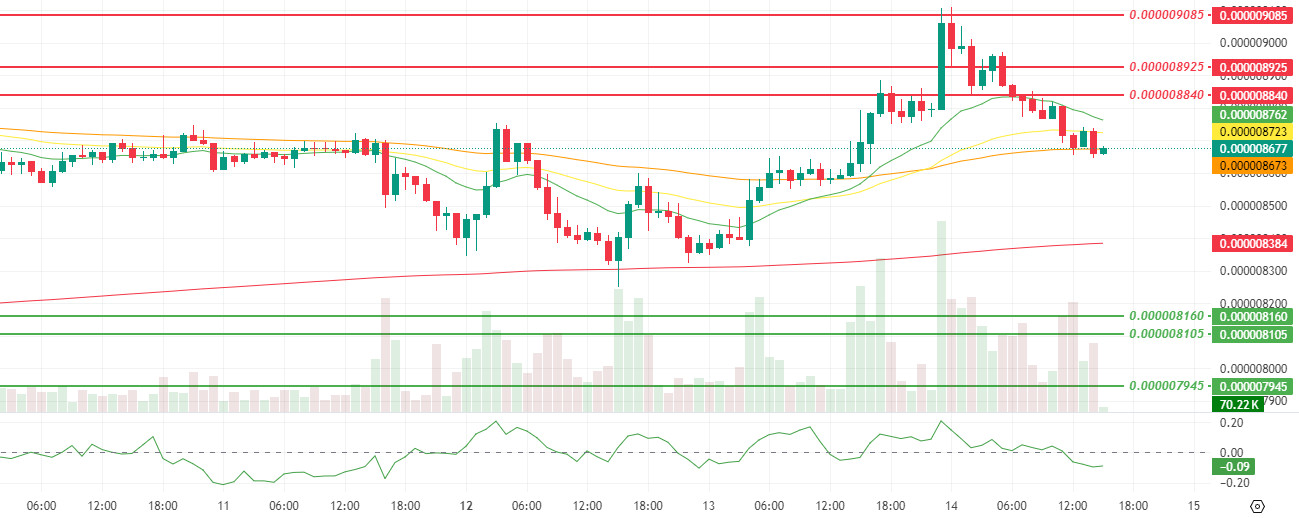
The technical chart shows that the attempt to hold at $0.000008840, observed in the morning report, has weakened, and the price has gradually retreated to the Smoothed Moving Average (SMMA) 50 level. The momentum, volume, and volatility indicate that buyer appetite has cooled after the upward attempt and that the market has entered a more cautious rebalancing phase in the short term. The Chaikin Money Flow (CMF) indicator moving into negative territory serves as a critical warning, confirming that this pullback is no longer supported by net capital inflows and that the flow has shifted toward selling. At this point, the reaction around the SMMA 50 could be decisive in determining the direction.
If the price holds above the SMMA 50 and maintains this level at intraday closes, the pullback could be interpreted as a healthier correction, and a rebound attempt towards the resistance band between $0.000008840 and $0.000008925 could come into play. Conversely, if persistence forms below the SMMA 50and the CMF deepens in negative territory, the movement may evolve from a reaction wave to a correction phase, initially retesting the $0.000008625 level. If this band is also lost, the $0.000008160 and $0.000008105 support levels may be retested. (SMMA9: Green Line, SMMA21: Yellow Line, SMMA50: Orange Line, SMMA 200: Red Line)
Supports: 0.000008160 – 0.000008105 – 0.000007945
Resistances: 0.000008840 – 0.000008925 – 0.000009085
Legal Notice
The investment information, comments, and recommendations contained herein do not constitute investment advice. Investment advisory services are provided individually by authorized institutions taking into account the risk and return preferences of individuals. The comments and recommendations contained herein are of a general nature. These recommendations may not be suitable for your financial situation and risk and return preferences. Therefore, making an investment decision based solely on the information contained herein may not produce results in line with your expectations.

