
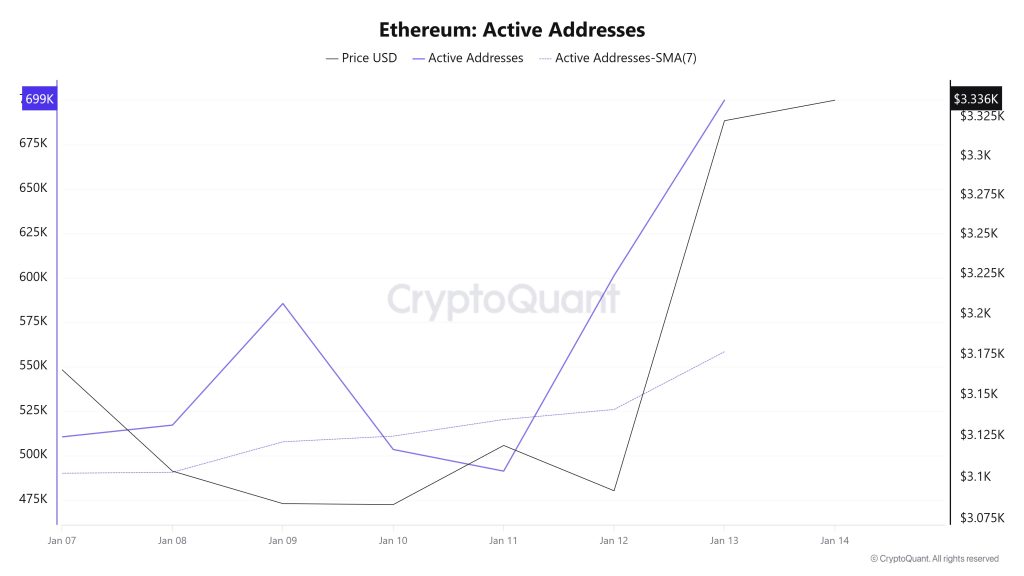
Active Addresses
Between January 7 and January 14, a total of 699,904 active addresses were added to the Ethereum network. During this period, the Ethereum price rose from $3,165 to $3,336. On January 11, in particular, when the price reached the active address point, a significant increase was observed in both the number of active addresses and the price point. When examining the 7-day simple moving average (SMA), it can be seen that the Ethereum price is generally trending upward.
Active Sending Addresses
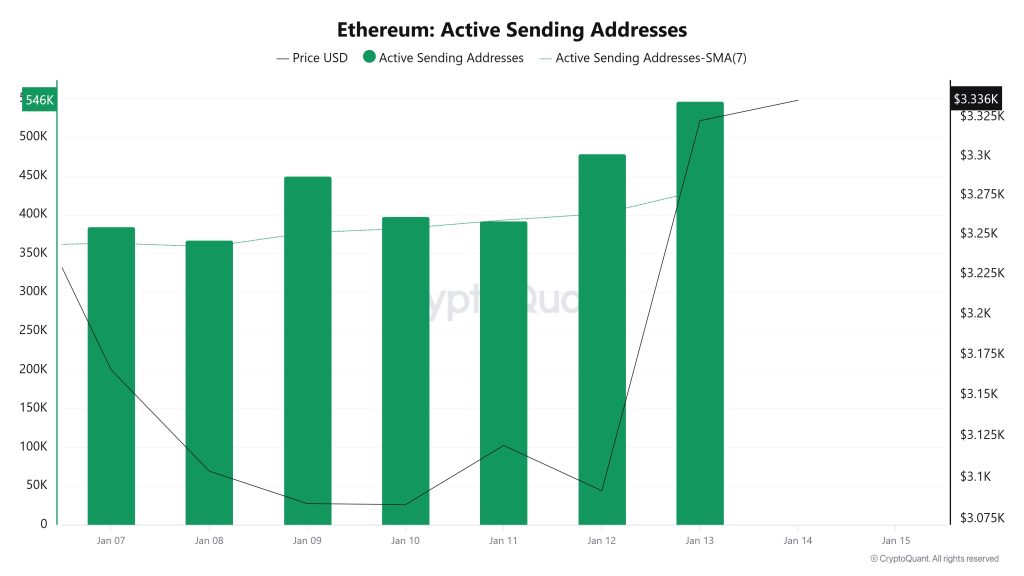
Between January 7 and January 14, high levels of active sending activity were observed at active sending addresses along with the Black Line (price line). On the day the price reached its highest level on a weekly basis, active sending addresses reached 546,715.
Active Receiving Addresses
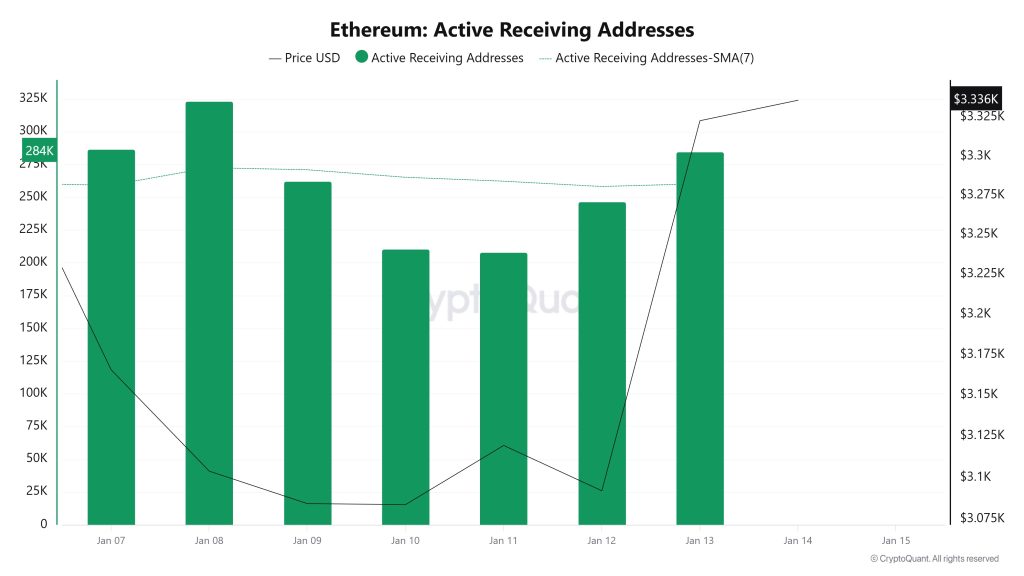
Between January 7 and January 14, while there was no significant increase in active receiving addresses, the price was seen to move upward. On the day the price reached its highest level, active receiving addresses reached 323,249, indicating an increase in purchases.
Total Value Staked
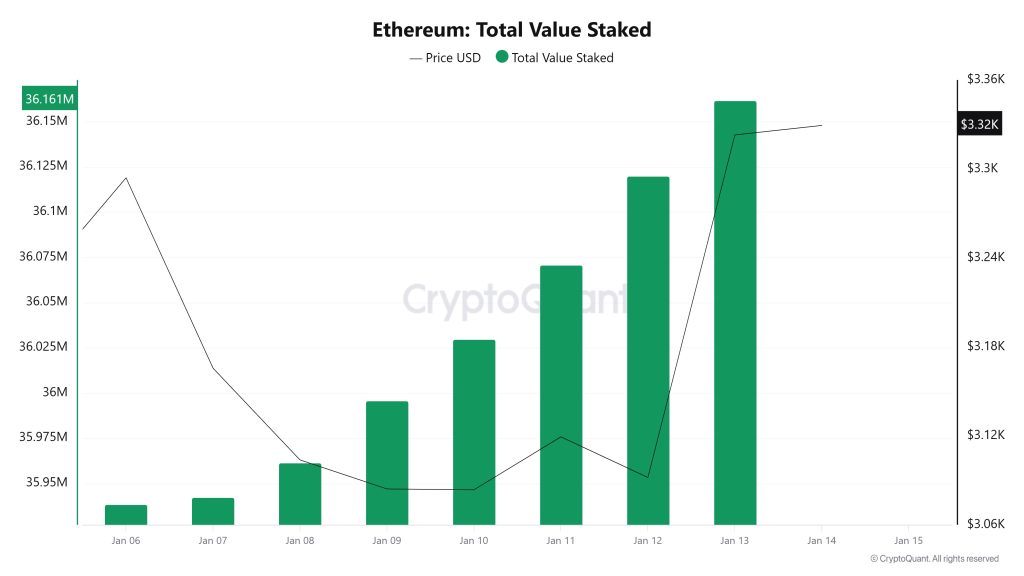
On January 7, the ETH price was trading at $3,165, while the Total Value Staked was at 35,942,399. As of January 13, the ETH price rose to $3,322, recording a 4.96% increase, while the Total Value Staked rose to $36,161,990, recording a 0.61% increase. The increase in Total Value Staked indicates that the total amount of ETH staked during this weekly period has grown and that the supply lock-up for staking has strengthened. The rise in Total Value Staked alongside the price increase suggests that the uptrend is not solely price-driven but also reflects continued position shifts on the network side, while also indicating a limited reduction in pressure on the circulating liquid supply.
Staking Inflows
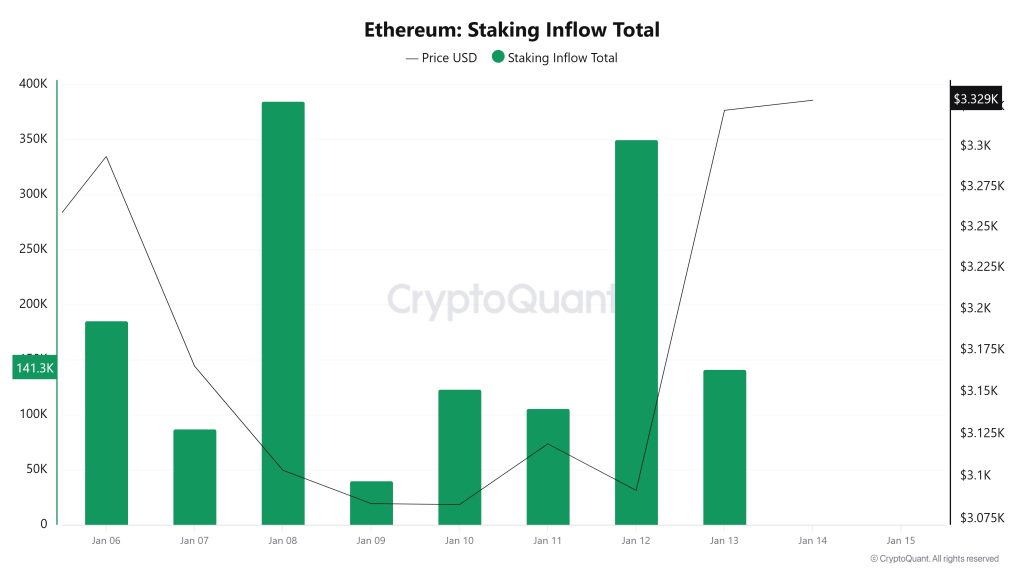
On January 7, while the ETH price was trading at $3,165, Staking Inflow stood at 87,094. This increase serves as a flow-based confirmation supporting the upward movement of Total Value Staked, while in the short term, it may create a limiting ground for selling pressure on the spot side due to the shift of supply from the liquid market to staking.
Derivatives
Open Interest
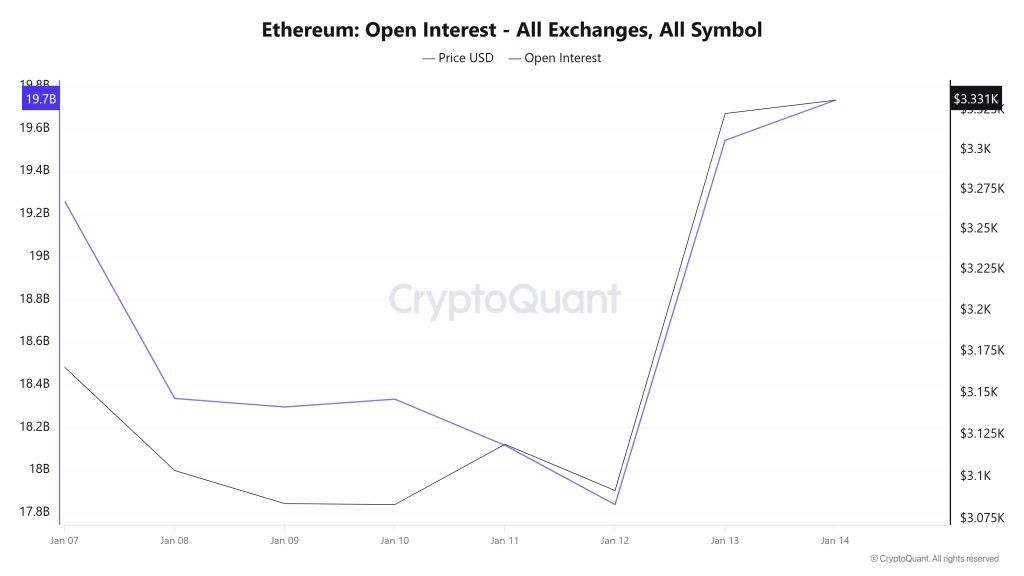
When examining the chart, it is evident that ETH open interest gradually declined between January 7 and 12, and during this period, the price remained under limited pressure. The decrease in leveraged positions during this period indicates that the market was moving more cautiously. After January 12, however, there was a sharp rebound in open interest. This rapid increase from the $18 billion range to around $19.7 billion, accompanied by the ETH price rising above $3,300, indicates that new long positions are entering the market at an accelerated pace.
In summary, the simultaneous rise in open interest and price indicates that the current uptrend is supported by the futures market. However, such a rapid increase in position density also signals that volatility and liquidation risk may increase in the coming period.
Funding Rate
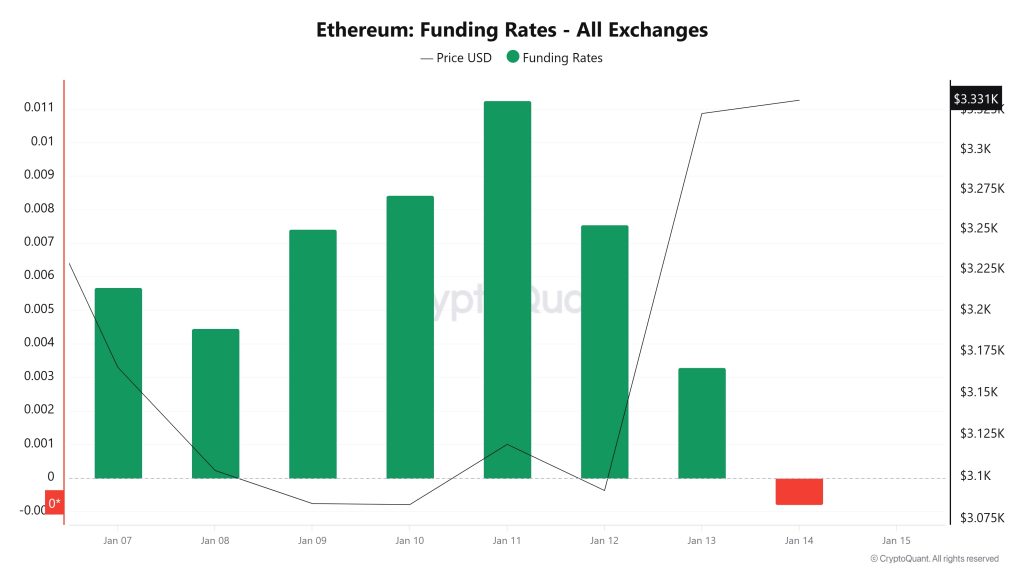
During this period, when the ETH price rose to around $3,300, the funding rate remained generally positive, indicating that long positions continued to dominate the futures markets. The funding rate’s continued rise until midweek suggests that price movements are also finding support on the futures side. The pullback observed in the funding rate over the past two days, however, suggests that some long positions have been closed and a short-term cautious stance has come to the fore. Although short-term negative values indicate a temporary increase in short-side trades, the overall structure remains intact. In summary, the funding rate outlook reveals that the structure supporting the ETH price persists despite short-term fluctuations, and no clear sign of deterioration has yet emerged in the market.
Long & Short Liquidations
With the ETH price rising from $3,050 to $3,360, a total of approximately $306 million in short positions were liquidated. During the same time period, nearly $412 million in long positions were also liquidated.
|
Supply Distribution
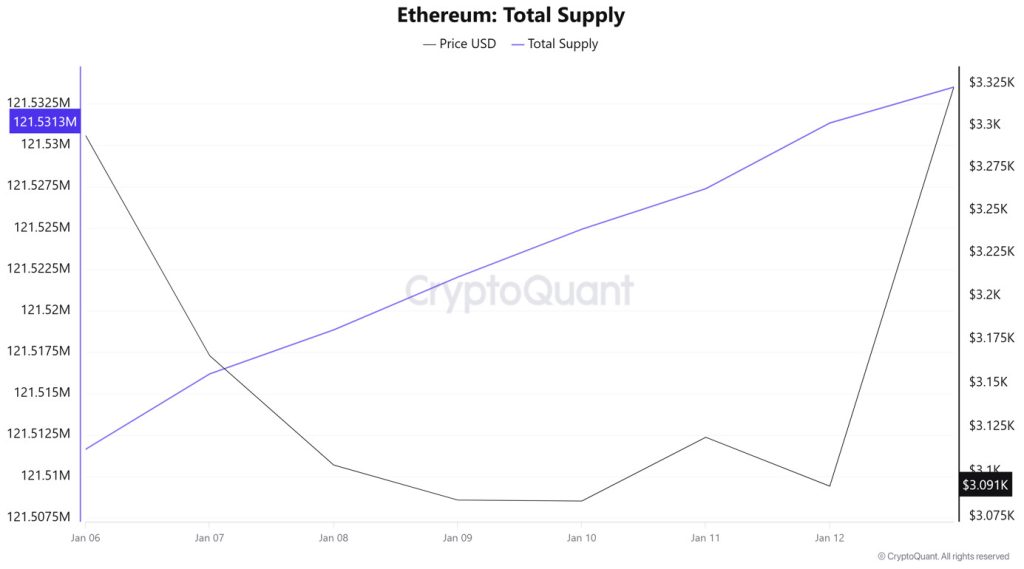
Total Supply: Reached 121,531,347 units, an increase of approximately 0.016% compared to last week.
New Supply: The amount of ETH produced this week was 19,702.
Velocity: The velocity, which was 9.96 last week, reached 9.97 as of January 13.
|
The pullback seen in the 10k–100k ETH range indicates that buying appetite remains weak in this segment and that the risk reduction trend continues. The decline in the 1k–10k ETH group also suggests that mid-sized investors are reluctant to buy, preferring to reduce or maintain their positions. The more pronounced decline in the largest wallets holding 100k+ ETH points to large players adopting a cautious stance and the possibility of a partial distribution process being underway.
Exchange Reserve
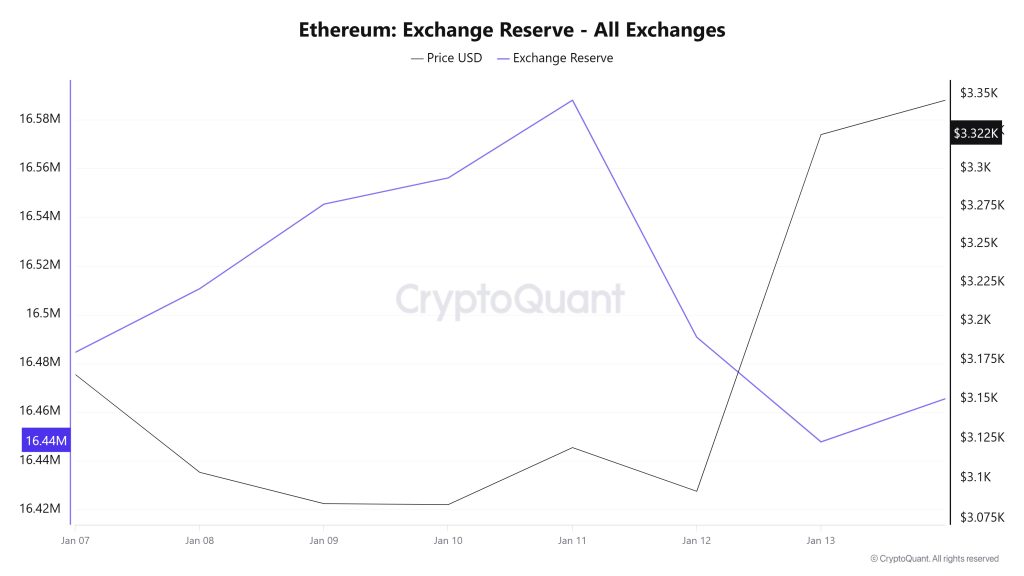
Between January 7 and 13, 2026, Ethereum reserves on exchanges rose from 16,422,029 ETH to 16,447,759 ETH, resulting in a net inflow of 25,730 ETH. During this period, exchange reserves increased by approximately 0.16%, while the ETH price rose from $3,295 to $3,323, an increase of 0.84%. While the ETH price fluctuated but generally followed a flat trajectory, the limited increase in reserves indicated that investors remained cautious at these levels. During this process, a balanced market structure prevailed rather than strong selling pressure. In the short term, price movements may remain limited, and the market may continue to search for direction.
|
Fees and Revenues
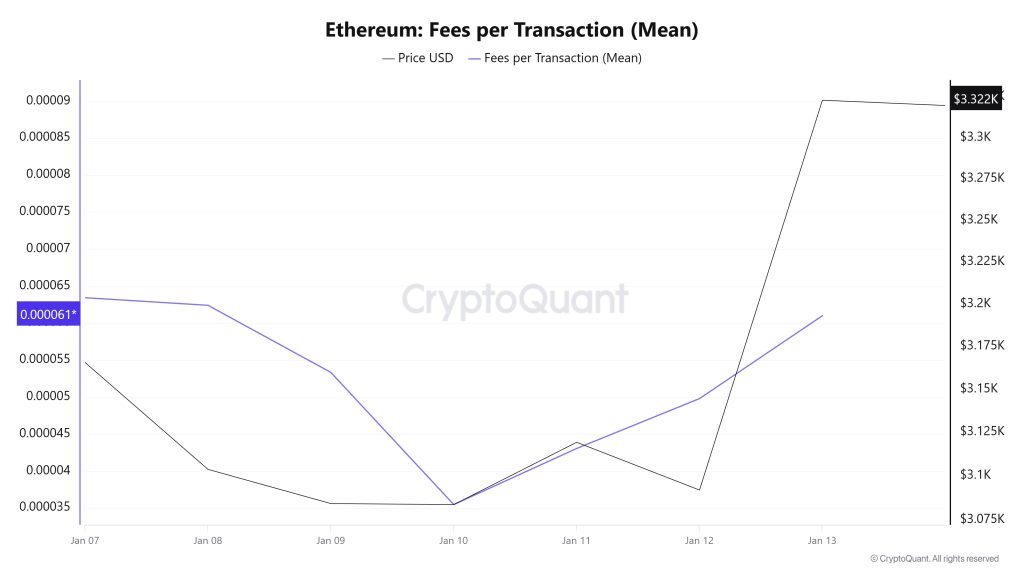
When examining the Ethereum Fees per Transaction (Mean) data between January 7 and 13, it is seen that on January 7, the first day of the week, the indicator reached 0.000063435051678632.
A decline was observed until January 10, when the indicator recorded the week’s lowest value at 0.000035479046865854.
In this context, as of January 10, the indicator regained momentum as a result of increased price volatility in Ethereum, and followed a positive trend due to the impact of price volatility.
On January 13, the last day of the weekly period, the indicator closed the week at 0.000061002227870097.
Ethereum: Fees (Total)
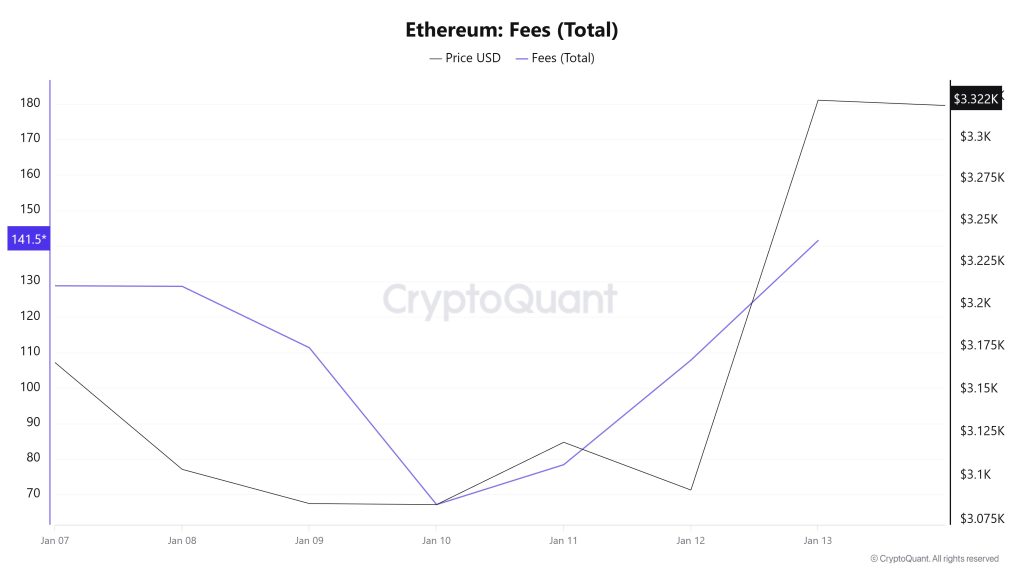
Similarly, when examining the Ethereum Fees (Total) data for January 7-13 at , it can be seen that on January 7, the first day of the week, the indicator stood at 128.77607292000033.
A decline was observed until January 10, and on this date, the indicator recorded the week’s lowest value at 67.11294559048092.
In this context, as of January 10, the indicator regained momentum as a result of increased price volatility in Ethereum, and followed a positive trend due to the impact of price volatility.
On January 13, the last day of the weekly period, the indicator closed the week at 141.52120351381365.
Blocks Mined
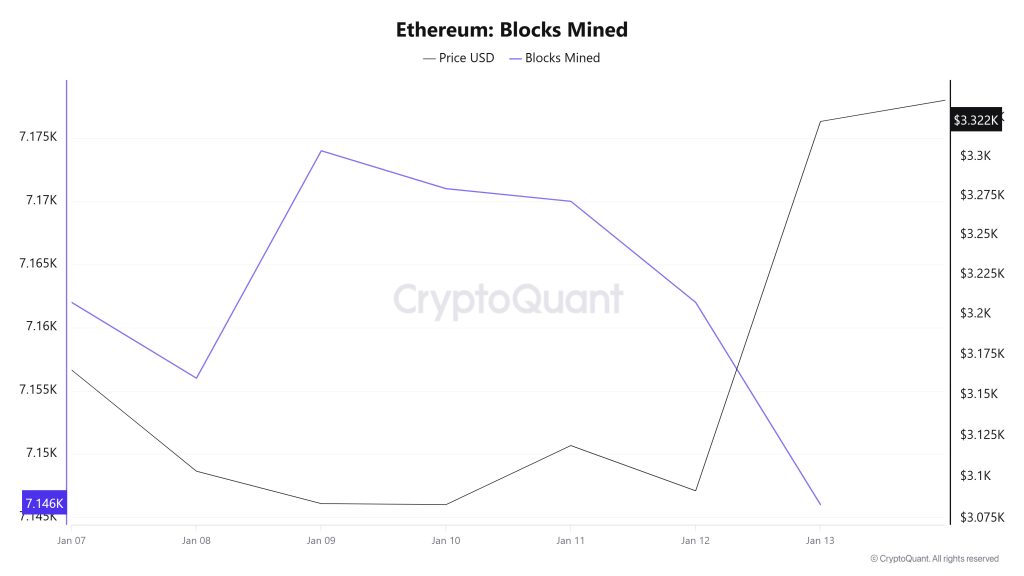
When examining Ethereum block production data between January 7 and 13, a decrease was observed throughout the week. While 7,162 blocks were produced on January 7, this number declined to 7,146 by January 13.
During the period in question, a time-dependent correlation structure was observed between the Ethereum price and the number of blocks produced. However, the general trend indicates that a negative correlation between these two variables is dominant.
Block Size
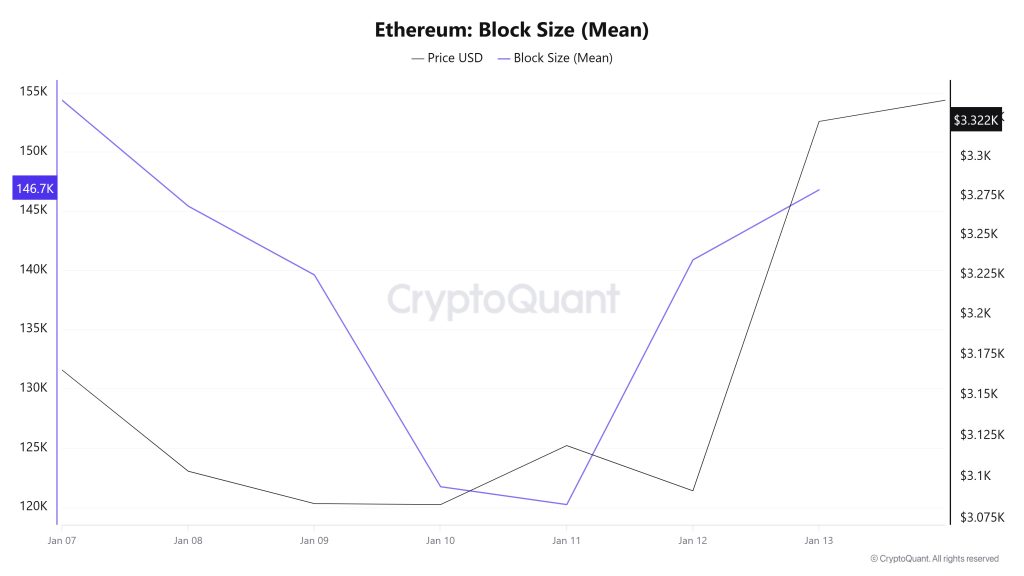
When examining Ethereum block size data between January 7 and 13, a decrease was observed throughout the week. While the average block size was measured at 154,354 bytes on January 7, this value declined to 146,791 bytes by January 13.
During the relevant period, a time-dependent correlation structure was observed between block size and Ethereum price. However, the general trend indicates that a positive correlation between these two variables is dominant.
Block Interval
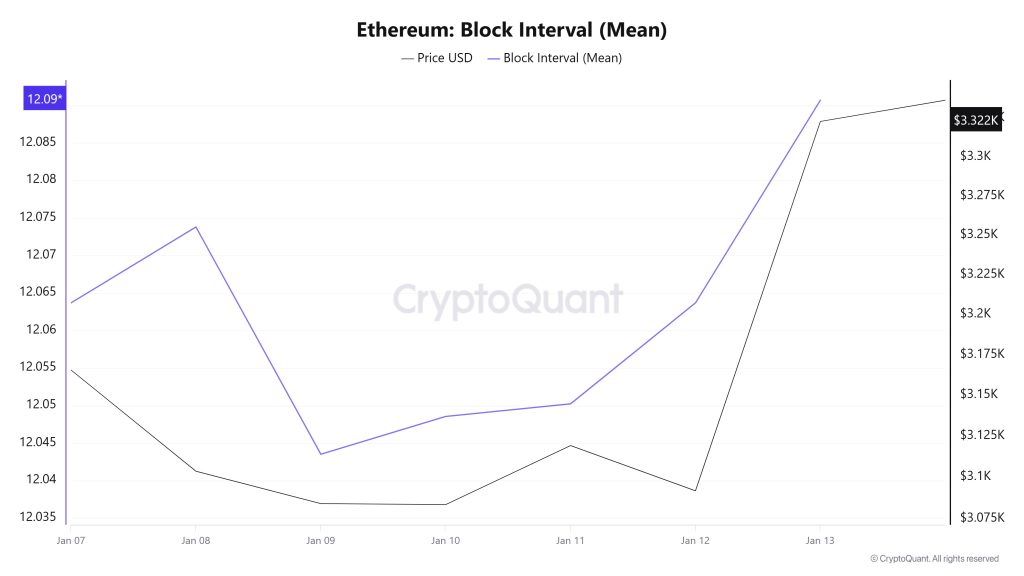
When examining the Ethereum block time between January 7 and 13, an increase was observed throughout the week. While the average block time was recorded as 12.06 seconds on January 7, this time increased to 12.09 seconds as of January 13.
During the period in question, a time-dependent correlation structure was observed between Ethereum block time and price movement. However, the general trend indicates that a positive correlation between these two variables is dominant.
Transaction
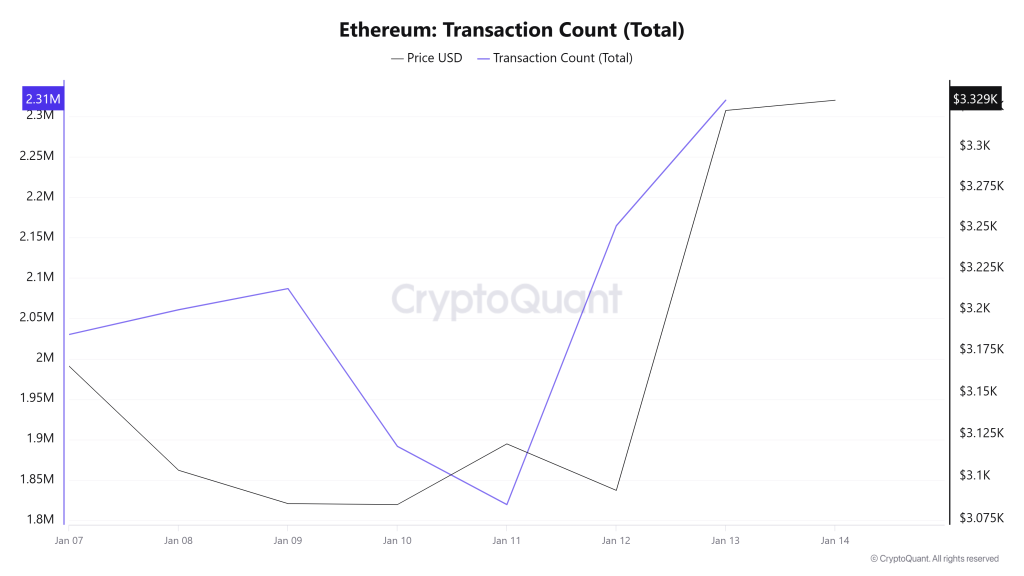
Last week, 12,111,308 transactions were executed on the Ethereum network, while this week the number of transactions increased by approximately 18.7% to 14,373,332. The highest transaction volume for the period was recorded on January 13 at 2,319,935, while the lowest transaction volume was recorded on January 11 at 1,819,598. Although the correlation between the number of transactions and the price showed a mixed picture at times throughout the period, it is understood that the negative trend was dominant overall. However, the acceleration in network activity compared to the previous period indicates a recovery in transaction volume momentum on the Ethereum side, and this increase in network activity is expected to indirectly reflect on Ethereum prices.
Tokens Transferred
The total amount of ETH transferred last week was 9,872,38 ETH, while this week the value rose to 10,500,473 ETH, recording an increase of approximately 6.36%. The highest transfer volume during the period was 2,241,430 ETH on January 8, while the lowest value was 700,420 ETH on January 11.
When considering the up to 300% fluctuation in daily transfers, the increase in transaction volume, and the decline in the average amount of Ethereum per transaction, it appears that a structure has been formed on the network that could widen the price fluctuation range. This outlook indicates that more small-scale investors have joined the network compared to the previous period, providing a positive foundation for network health and a solid basis for pricing. However, without a resurgence in high-volume transfers, it seems difficult for the price to break out of its indecisive structure. In the short term, the chain is dynamic and lively, but the market is showing a cautious outlook.
Estimated Leverage Ratio
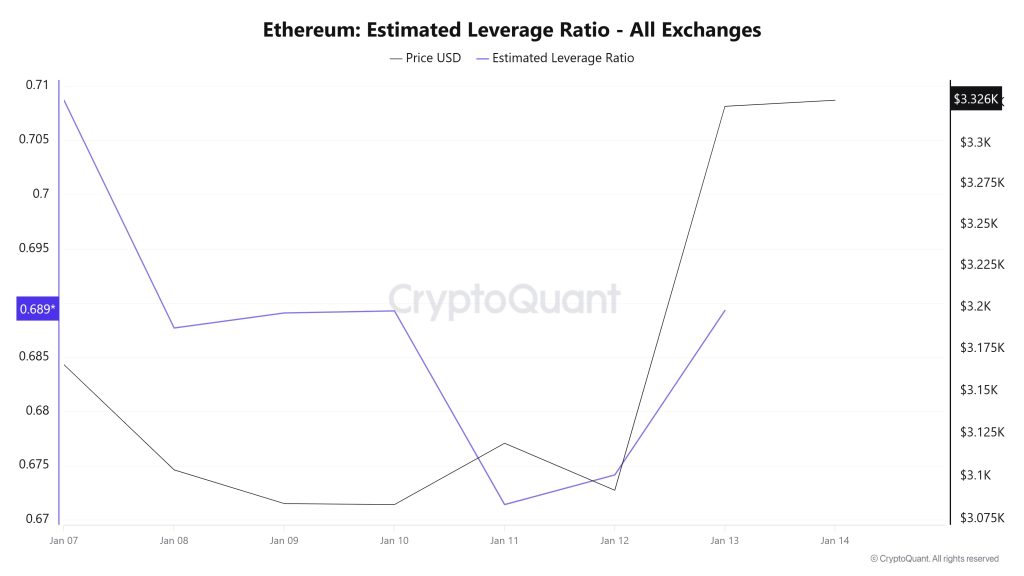
Over the 7-day period, the metric experienced a pullback until the middle of the process. On January 7, the first day of the process, the metric was at 0.708, which was also the peak of the process. The metric experienced a pullback until January 11, forming the lowest point of the process and falling to 0.671. The metric then began to rise for the remainder of the process and currently stands at 0.689. A higher ELR means that participants are willing to take on more risk and usually indicates bullish conditions or expectations. The increases may also be due to a decrease in reserves. Looking at Ethereum reserves, there were 16.48 million reserves at the beginning of the process, and this figure rose during the rest of the process but has now fallen back to 16.46 million, returning to the level seen at the start of the process. At the same time, Ethereum’s Open Interest was seen at $41.64 billion at the beginning of the process. As of now, volume has remained flat during the process, and the open interest value stands at $41.67 billion. With all this data, the ELR metric followed a downward trend for most of the process. The asset’s price fluctuated between $3,070 and $3,360 with all this data. In conclusion, the flat trend in open interest data throughout the process, along with reserves moving within a narrow band, explains the flat movement in the ELR metric. This indicates that investors’ risk appetite has not fully increased, but they are not pessimistic either.
ETH Onchain Overall
|
*The metrics and guidance provided in the table do not alone explain or imply any expectation regarding future price changes in any asset. Digital asset prices can fluctuate based on numerous variables. The on-chain analysis and related guidance are intended to assist investors in their decision-making process, and basing financial investments solely on the results of this analysis may lead to unfavorable outcomes. Even if all metrics produce positive, negative, or neutral results simultaneously, the expected outcomes may not materialize depending on market conditions. It would be beneficial for investors reviewing the report to take these warnings into consideration.
Legal Notice
The investment information, comments, and recommendations contained in this document do not constitute investment advisory services. Investment advisory services are provided by authorized institutions on a personal basis, taking into account the risk and return preferences of individuals. The comments and recommendations contained in this document are of a general nature. These recommendations may not be suitable for your financial situation and risk and return preferences. Therefore, making an investment decision based solely on the information contained in this document may not result in outcomes that align with your expectations.
NOTE: All data used in Ethereum on-chain analysis is based on CryptoQuant.
