
BTC/USDT
Trump stated that he has lowered the possibility of military intervention in Iran in the short term, while the US Beige Book report pointed to economic growth and limited price increases; Fed officials emphasized that an interest rate cut is not on the agenda in January. While the House of Representatives approved the Treasury and State Department budgets, Trump’s insistence on Greenland and his tariff messages targeting the Supreme Court heightened geopolitical tensions in the region; Denmark and some European countries sending military reinforcements to the island also reinforced security concerns.
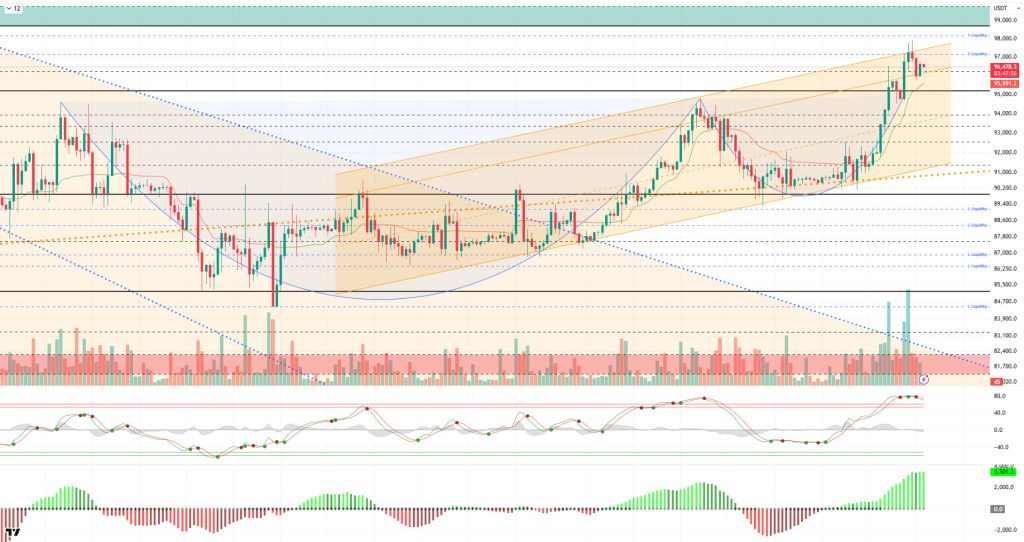
From a technical perspective, BTC managed to hold above the 95,000 level, which we are tracking as a reference level, after its recent rise and regained momentum. The price, which rose relentlessly along the upward channel, reached the 98,000 level, exceeding the trend extension. Although BTC then retreated slightly to the 95,700 level after failing to break through this level on its first attempt, it is currently seeking equilibrium at the 96,500 level, accompanied by increased volume and volatility.
Technical indicators show the Wave Trend (WT) oscillator moving above the overbought zone, signaling a potential trend reversal, while the histogram on the Squeeze Momentum (SM) indicator gained maximum momentum within the positive zone. The Kaufman Moving Average (KAMA) is currently trading below the price at $95,616.
When examining the liquidation data, the buying level first formed a concentrated accumulation within the 88,000–90,000 band, then became a liquidity area at 93,300 with the latest rise. In contrast, while transactions opened in the last three months were targeted in the selling tier, the 98,400 level became the selling tier again in the short term.
In summary, while Trump reduced the possibility of military intervention against Iran, the Fed’s January Beige Book indicated that overall conditions in the US economy had improved. Fed officials sent cautious messages regarding interest rates. Meanwhile, while the US Supreme Court did not rule on Trump’s tariffs, the House of Representatives approved funding. On the crypto front, eyes turned to details of the Clarity Act, which will be discussed in the Senate today. Looking at liquidation data, long-term sell orders became the target and were liquidated after the recent breakout.Technically, BTC started the new year with positive momentum, first reaching the 95,000 level and then continuing its parallel movement to the upward channel, rising to the 98,000 level. Facing short-term profit-taking at these levels, the price managed to maintain its upward momentum. After this stage, while the price’s corrective movements within the trend channel are seen as healthy for the continuation of the rise, the 95,000 level has become the price’s decision point. Not losing this level is an important indicator for regaining momentum, while a breakout could lead to an increase in sell positions.
Supports: 96,000 – 96,200 – 94,000
Resistances: 97,000 – 98,000 – 99,100
ETH/USDT
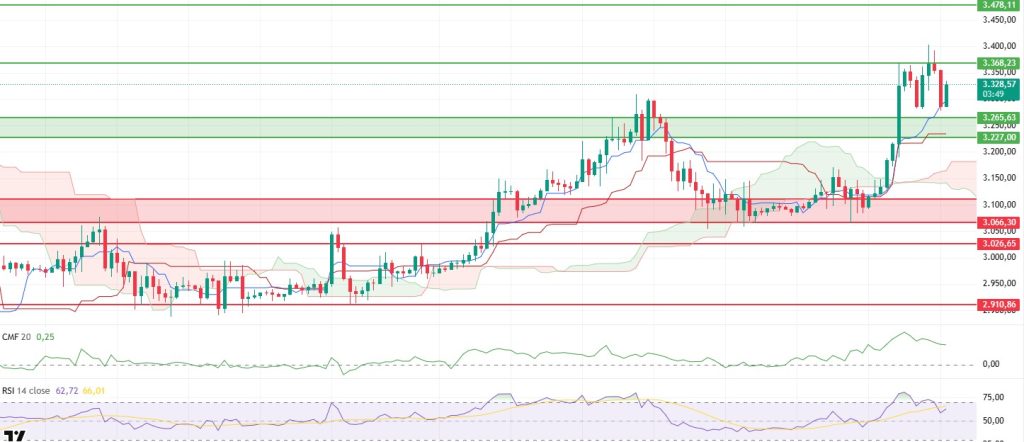
The ETH price rose to $3,400 yesterday evening after strong buying pushed it past the $3,368 resistance level. Profit-taking in this region caused the price to retreat to $3,279 in the morning. However, this decline was not permanent, and buying from the support level pushed the ETH price back up to $3,330. The price finding equilibrium quickly indicates that upward momentum remains strong.
The liquidity picture remains intact. The Chaikin Money Flow (CMF) continues to stay in positive territory. Despite the pullback, the lack of significant deterioration in this indicator suggests that the money entering the market remains strong and that selling has not turned into a liquidity-driven unwinding. This structure facilitates support for the price during downward movements.
There is a more balanced picture on the momentum front. Although the Relative Strength Index (RSI) has moved out of the overbought zone, it continues its upward trend. The RSI’s position suggests that market appetite remains high, but short-term fluctuations should be considered normal. Momentum is strong, but it seems likely that the price will move in a zigzag pattern rather than a straight line.
The technical outlook is clearly positive from the Ichimoku indicator perspective. The price continues to stay above the kumo cloud. The Tenkan and Kijun levels are in supportive positions. Furthermore, the upward expansion of the kumo cloud confirms that the main trend remains strong.
The overall picture remains unchanged. As long as the support area shown by the green rectangle in the chart holds, the upward scenario remains valid. The ETH price is expected to retest the $3,368 level during the day. If this resistance is broken, the upward momentum could gain strength. On the downside, the $3,227 level should be monitored as critical support. If the price falls below this level, short-term pressure may increase. At this stage, the ETH price is maintaining its strong trend but is showing a volatile structure.
Below the Form
Supports: 3,265 – 3,227 – 3,066
Resistances: 3,368 – 3,478 – 3,657
XRP/USDT
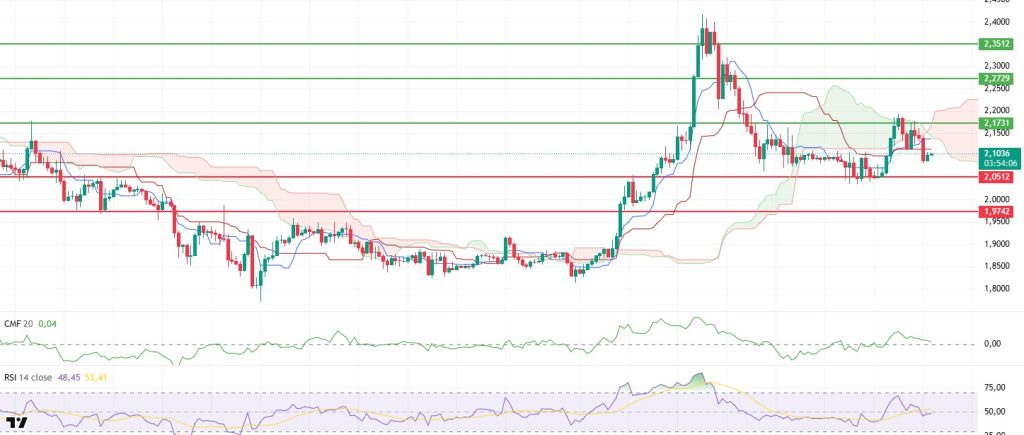
The XRP price attempted an upward move yesterday evening, rising to the $2.17 resistance level. However, buyers failed to follow through in this region, and selling pressure returned. With the selling pressure, the price retreated again, falling back to the $2.10 level. This second unsuccessful attempt at the resistance zone indicates that sellers are still more eager in the short term.
The liquidity outlook is weakening, similar to the previous chart. Although the Chaikin Money Flow (CMF) remains in positive territory, it continues its downward trend. This structure suggests that the amount of money entering the market is decreasing and the selling side is becoming increasingly dominant. Unless liquidity support strengthens, it seems difficult for the price to generate upward movement.
There is no significant recovery on the momentum front either. The Relative Strength Index (RSI) continues to remain below the 50 level. This situation indicates that buyers have not been able to regain momentum and that upward moves remain weak. This structure in the RSI signals that the pressure on the price has not yet dissipated.
The technical outlook remains negative from the Ichimoku indicator perspective. The price is trading below the Kumo cloud, and its position below the Tenkan and Kijun levels has not changed. This scenario indicates that short-term risks persist and that the technical conditions for a recovery have not yet materialized.
The focus in the overall assessment remains on the $2.17 level. As long as this level is not surpassed, downward pressure on the XRP price is expected to persist. However, if $2.17 is clearly gained, the current weak structure could reverse, and an upward trend could re-emerge for the price. At this stage, the XRP price remains under pressure, and for the trend to change, buyers need to demonstrate a stronger stance.
Supports: 2.0500 – 1.9742 – 1.9005
Resistances: 2.1731 – 2.2729 – 2.3512
SOL/USDT
Tether-backed Oobit is bringing Solana wallets to Visa payments by adding Phantom support. Solana Mobile will distribute 1.8 billion SKR tokens to users and 141 million SKR tokens to developers.
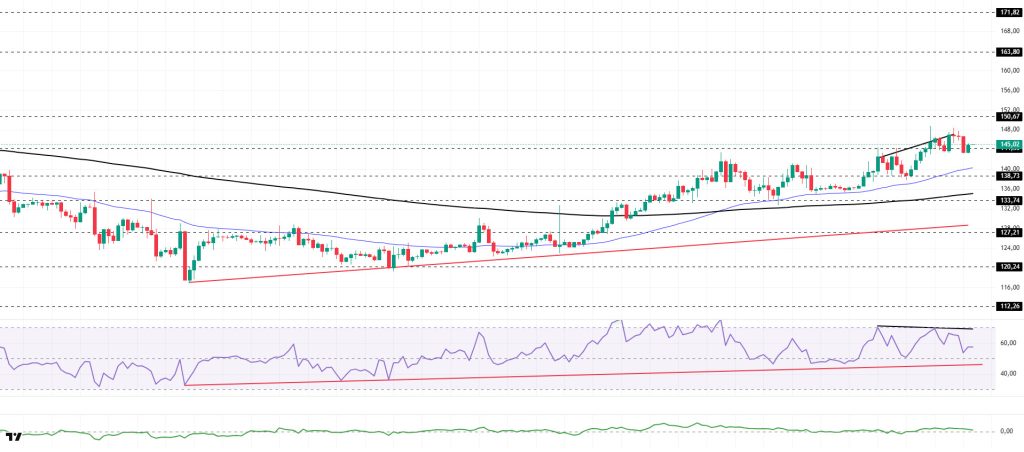
The SOL price traded sideways. The asset remained in the upper region of the upward trend that began on December 18. Testing the $138.73 level as support, the price recovered its losses and rose. Currently testing the strong resistance level of $144.35, the price could test the $150.67 level if it maintains its position above this level. In case of a pullback, it could test the 50 EMA (Blue Line) moving average as support.
On the 4-hour chart, the 50 EMA (Exponential Moving Average – Blue Line) remained above the 200 EMA (Black Line). This indicated that an uptrend could begin in the medium term. At the same time, the price being above both moving averages signaled that the asset was trending upward in the short term. The Chaikin Money Flow (CMF-20) remained in positive territory. However, a decrease in money inflows could push the CMF into negative territory. The Relative Strength Index (RSI-14) continued to remain above the upward trend that began on December 18. On the other hand, negative divergence should be monitored. In the event of an upward movement due to macroeconomic data or positive news related to the Solana ecosystem, the $163.80 level stands out as a strong resistance point. If this level is broken upwards, the rise is expected to continue. If pullbacks occur due to developments in the opposite direction or profit-taking, it may test the $133.74 level. If it falls back to these support levels, an increase in buying momentum may present a potential upside opportunity.
Supports: 144.35 – 138.73 – 133.74
Resistances: 150.67 – 163.80 – 171.82
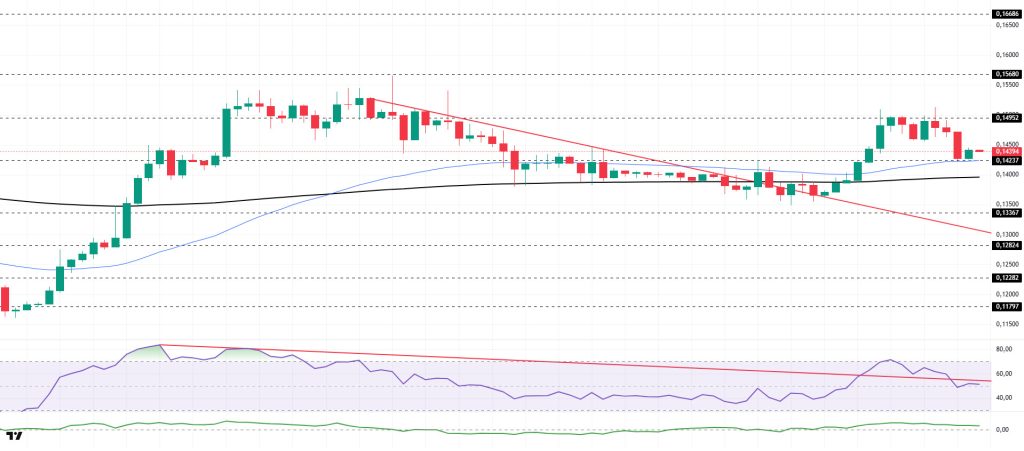
DOGE/USDT
The DOGE price continued to lose value. The asset remained in the upper region of the downward trend that began on January 6. However, after breaking above the 200 EMA (Black Line) moving average and the 50 EMA (Blue Line) moving average, the asset experienced a slight pullback from the strong resistance level of $0.14952. Currently testing the 50 EMA moving average as support, the price could test the $0.15680 level as resistance if it closes above this level. If the pullback continues, it could test the 50 EMA moving average or the $0.14237 level as support.
On the 4-hour chart, the 50 EMA (Exponential Moving Average – Blue Line) remained above the 200 EMA (Black Line). This indicated that a medium-term uptrend was forming. The price being above both moving averages also showed that the price was trending upward in the short term. The Chaikin Money Flow (CMF-20) managed to stay in positive territory. Additionally, a decrease in money inflows could push the CMF into negative territory. The Relative Strength Index (RSI-14) retreated from the overbought zone to neutral levels. At the same time, it crossed below the downward trend line that began on January 3, signaling selling pressure. In the event of potential increases driven by political developments, macroeconomic data, or positive news flow within the DOGE ecosystem, the $0.16686 level stands out as a strong resistance zone. Conversely, in the event of negative news flow, the $0.13367 level could be triggered. A decline to these levels could increase momentum and initiate a new wave of growth.
Supports: 0.14237 – 0.13367 – 0.12824
Resistances: 0.14952 – 0.15680 – 0.16686
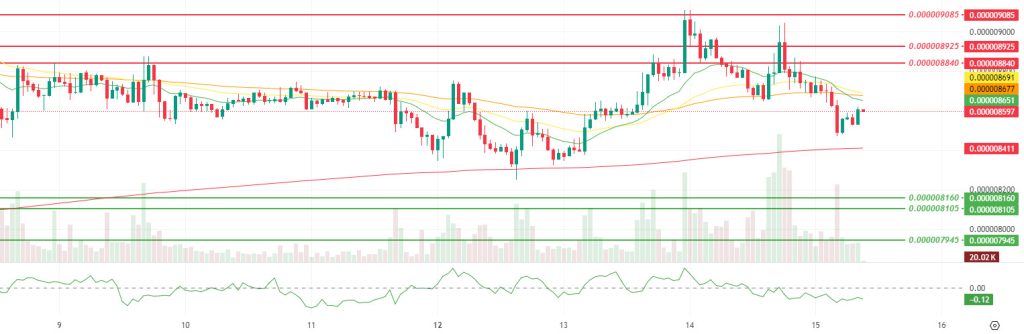
SHIB/USDT
The post-exploit agenda on the K9 Finance DAO forum did not remain confined to the chain vote, and two new proposals shifted the discussion to a more strategic ground. A new proposal from Bonecrusher developers requesting a migration assessment document covering 5 to 10 different chains within KNINE aims to clarify the pros and cons, high-level technical requirements, timeline, and cost items for each chain. It also brings to the table a potential collaboration path that would strengthen the KNINE utility and revenue streams on the selected chain. The ShibCrusher proposal, opened in parallel, suggests moving SHIB to a liquid staking-like structure on Ethereum, allowing users to deposit SHIB and maintain liquidity with the knSHIB derivative, distribute returns based on stablecoins, and implement security control points such as a 24-hour unstake delay during the process. The draft also positions mechanisms such as buybacks and burns from fee revenues, along with governance and lock-based yield enhancement on the KNINE side, as central benefit layers. These two proposals demonstrate that while the ecosystem continues to seek direction post-Shibarium, it is attempting to broaden its decision set and reframe sustainability not only through chain selection but also through product design.
The technical chart shows that the reaction around the SMMA 50 observed in the previous report remained weak, and the price fell below the Smoothed Moving Average (SMMA) 9.21 and 50 periods, highlighting short-term trend pressure. The decline in momentum and volume indicates that buyer appetite has retreated and upward attempts are struggling to gain traction at this stage, while the more limited decline in volatility suggests that sales occurred in a market that can still generate rapid reactions rather than one where selling has completely subsided. The Chaikin Money Flow (CMF) indicator remaining in negative territory carries critical warning implications, confirming that net capital flows still favor selling and that the current weakness is not merely a technical correction but a cooling supported by flows.
On the other hand, the price remaining above the 200-period SMMA stands out as a balancing factor, indicating that the main structure has not completely broken down in the broader picture and that support around the 200-period must be lost for the downward scenario to accelerate. In this context, for the short-term recovery scenario to gain strength, the price may first need to reclaim the SMMA 9.21 and 50 bands, then settle above the $0.000008840 resistance level and open up space towards the $0.000008925 and $0.000009085 levels. Conversely, if the hold above the SMMA 200 weakens and the price dips below the dynamic support around $0.000008410, a pullback towards the $0.000008160 and $0.000008105 levels. If this band is also lost, the 0.000007945 level is expected to become the main equilibrium area again. (SMMA9: Green Line, SMMA21: Yellow Line, SMMA50: Orange Line, SMMA 200: Red Line)
Supports: 0.000008160 – 0.000008105 – 0.000007945
Resistances: 0.000008840 – 0.000008925 – 0.000009085
Legal Notice
The investment information, comments, and recommendations contained herein do not constitute investment advice. Investment advisory services are provided individually by authorized institutions taking into account the risk and return preferences of individuals. The comments and recommendations contained herein are of a general nature. These recommendations may not be suitable for your financial situation and risk and return preferences. Therefore, making an investment decision based solely on the information contained herein may not produce results in line with your expectations.

