
BTC/USDT
Trump says he has no intention of firing Powell despite the investigation into him, while conflicting interest rate messages from Fed officials keep policy uncertainty alive.
While military options remain on the table regarding Iran, the White House’s “wait-and-see” approach continues;
in parallel, the US is increasing its military preparations in the region and new sanctions against Tehran are being implemented.
On the crypto front, while talks continue between the White House and the Senate, the hearing was postponed due to some provisions in the Clarity Act draft text not receiving support from centralized exchanges.
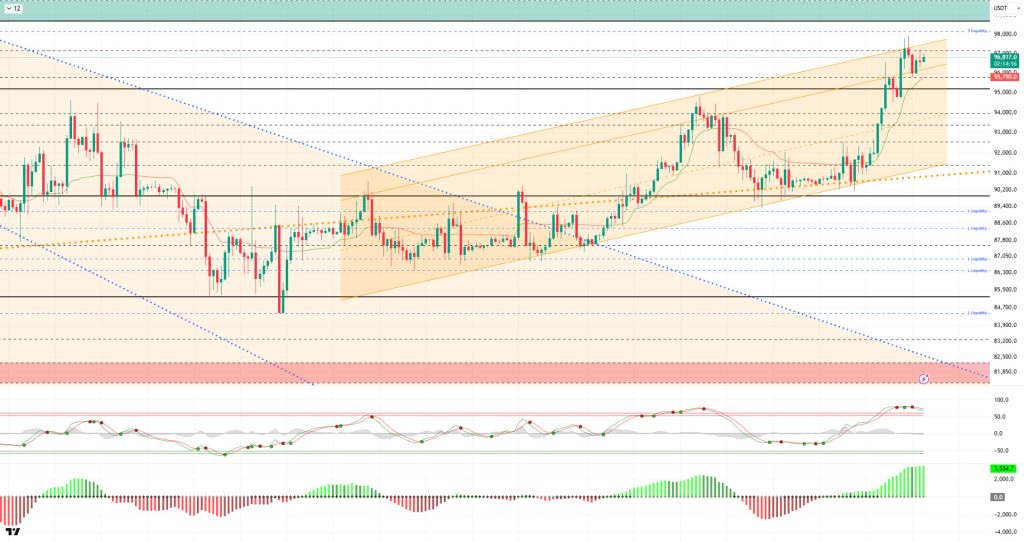
From a technical perspective, BTC continues its price movements parallel to the upward channel, but failed to break through the critical 98,000 level on its first attempt. The price then retreated slightly and tested the reference level of 95,000. Currently finding support in this region, BTC continues to trade at the 95,600 level. The OBO pattern formed in BTC, which created a rising peak after the cup-and-handle formation in its price, is noteworthy. For the OBO, a trend reversal pattern, to remain valid, the price is expected to form a lower peak after the correction movement.
Technical indicators show that the Wave Trend (WT) oscillator crossed above the overbought zone, signaling a sell after a buy signal, while the histogram on the Squeeze Momentum (SM) indicator weakened after gaining maximum momentum within the positive zone. The Kaufman Moving Average (KAMA) is currently trading at $95.742.
When examining liquidation data, the buy level first formed intense accumulation within the 88,000–90,000 band, then became a liquidity area at 93,300 with the latest rise. In contrast, while trades opened in the last three months were targeted on the sell side, the 98,400 level has once again become a sell zone in the short term.
In summary, Trump continues his military preparations despite lowering the possibility of military intervention against Iran. While conflicting interest rate messages continue to emerge from Fed officials, the Clarity legislative effort has been postponed. Looking at liquidation data, long-term sell-side transactions became the target and were liquidated following the recent breakdown.In technical terms, BTC started the new year with positive momentum, first reaching the 95,000 level and then continuing its parallel movement to the upward channel, rising to the 98,000 level. Facing short-term profit-taking at these levels, the price managed to maintain its upward momentum. After this stage, while the price’s corrective movements within the trend channel are seen as healthy for the continuation of the rise, the 95,000 level has become the price’s decision point. Not losing this level is an important indicator for regaining momentum, while a breakout could lead to an increase in sell positions.
Supports: 96,000 – 93,200 – 94,000
Resistances: 97,000 – 98,000 – 99,100
ETH/USDT
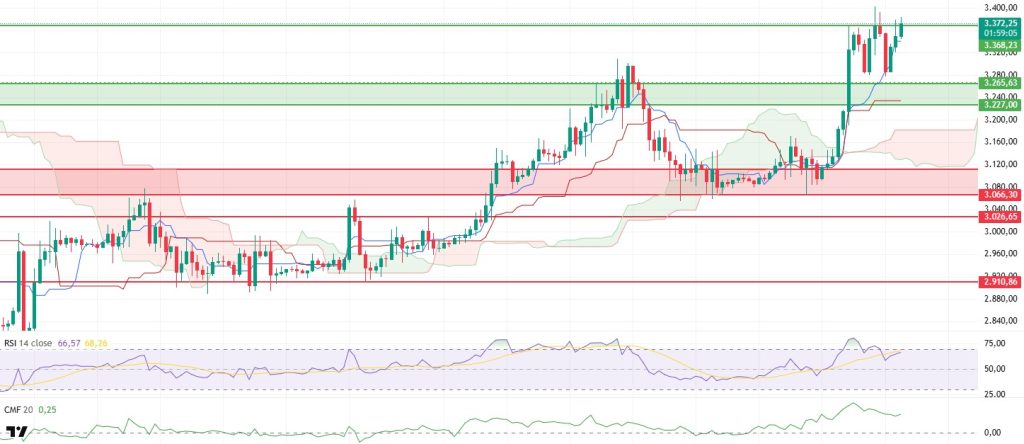
The ETH price failed to hold above the $3,368 level yesterday evening and retreated back to the $3,300 range due to selling pressure. The failure of the breakout to become permanent on the upside indicates that this area remains a strong decision zone. The continuation of selling pressure even during a period of positive spot ETF flows suggests that the price may move more erratically and cautiously over the weekend.
The liquidity picture is not completely ruined, but the weakening compared to the previous day is noteworthy. Chaikin Money Flow (CMF) remains in positive territory, but the downward slope indicates that spot buying appetite has declined somewhat. Since the liquidity flow has not completely dried up, there is no sign of a sharp decline, but it is important to see a renewed strengthening on the CMF side for the uptrend to continue comfortably.
There is a similar cooling on the momentum front. The Relative Strength Index (RSI) continued to correct, retreating to 54 levels. This pullback indicates that buyers’ momentum is waning. However, the fact that the RSI remains in a reasonable range suggests that the movement is more of a natural correction process than a trend reversal.
From the Ichimoku indicator perspective, the positive structure remains intact. The loss of the Tenkan level creates short-term weakness, but the price maintaining its position above the Kumo cloud has not completely disrupted the technical picture. As long as the Kijun level and the supportive structure of the cloud are maintained, the primary trend remains upward.
In the overall assessment, the critical level remains at the $3,368 region. If the ETH price can reclaim this area and maintain stability above it, upward attempts could regain strength. On the downside, the $3,227 level is being monitored as the main support. If it falls below this level, selling pressure could increase significantly. The current outlook remains positive, but the possibility of volatility and correction in the short term is still on the table.
Below the Form
Supports: 3,074 – 3,019 – 3,910
Resistances: 3,227 – 3,265 – 3,368
XRP/USDT
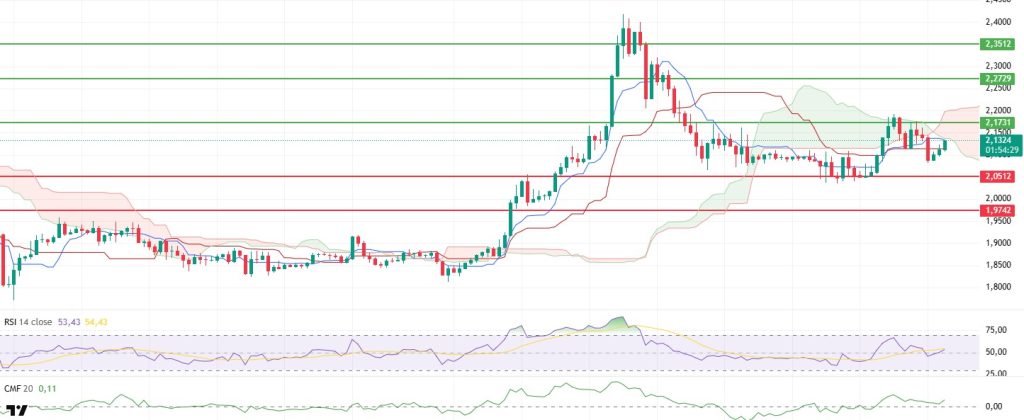
The XRP price failed to maintain its momentum after its latest upward attempt and gradually retreated back to the $2.05 support level. Although the price returning to this area indicates that buyers remain cautious, the support holding suggests that selling has not yet turned into an uncontrolled structure. In the short term, the outlook points to the price seeking equilibrium around $2.05 once again.
On the liquidity side, there are more constructive signals. The Chaikin Money Flow (CMF) has turned upward from a region close to the zero line and has begun to recover. This movement indicates that money inflows into the market have started to increase and that the buyer side has not completely retreated. The recovery of the CMF is an important detail that strengthens the likelihood of the price holding above support.
The momentum outlook is mixed but not entirely negative. Although the Relative Strength Index (RSI) has fallen below the 50 level, it has begun to form an upward trend again. This recovery in the RSI suggests that the price may attempt to rise again. However, it is difficult to say that momentum has clearly gained strength without a sustained return above the 50 level.
On the technical side, the Ichimoku indicator remains weak. The price being below the Tenkan, Kijun, and kumo cloud levels indicates that the downward pressure persists. The Tenkan level remaining below the Kijun level also confirms that the technical outlook has not yet recovered. This structure suggests that upward moves may face greater difficulty.
In the overall assessment, the $2.05 level is positioned as a short-term equilibrium point. If this support level is not lost during the day, upward attempts may come back into focus. On the upside, unless the $2.17 level is breached and the price rises above the Kumo cloud, it seems difficult for the recovery to become permanent. If the price falls below $2.05, the decline is likely to become more severe due to the negative structure on the Ichimoku side.
Supports: 2.0500 – 1.9742 – 1.9005
Resistances: 2.1731 – 2.2729 – 2.3512
SOL/USDT
Forward Industries surpassed 6.97 million SOL.
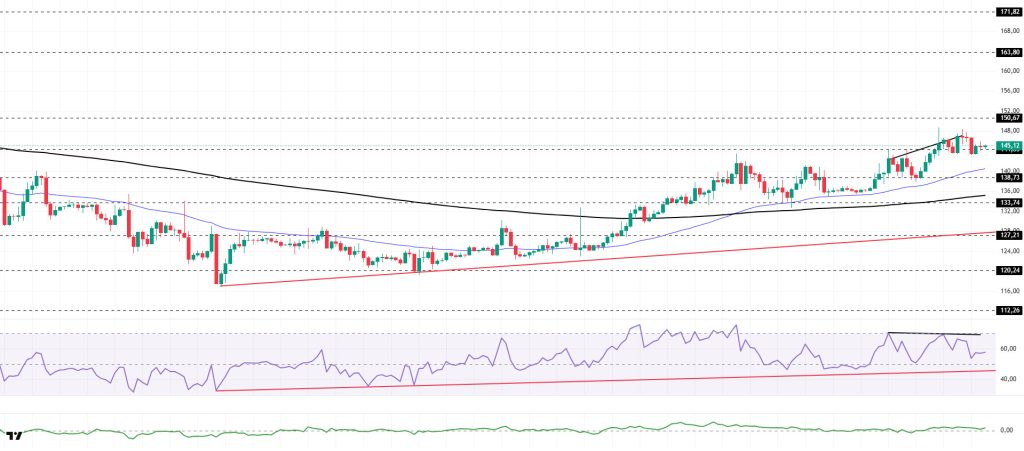
The SOL price experienced a slight decline. The asset continued to remain in the upper region of the upward trend that began on December 18. The price tested the $144.35 level as support but failed to hold there and continued to retreat. It is currently testing the 50 EMA (Blue Line) moving average as support. If the pullback continues, it may test the 200 EMA (Black Line) moving average as support. If it gains momentum and rises, the $150.67 level should be monitored as resistance.
On the 4-hour chart, the 50 EMA (Exponential Moving Average – Blue Line) remained above the 200 EMA (Black Line). This indicated that an uptrend could begin in the medium term. At the same time, the price being above both moving averages signaled that the asset was trending upward in the short term. The Chaikin Money Flow (CMF-20) remained in positive territory. However, the balance of money inflows and outflows may keep the CMF in positive territory. The Relative Strength Index (RSI-14) is currently testing the upward trend that began on December 18 as support. If there is an uptrend due to macroeconomic data or positive news related to the Solana ecosystem, the $163.80 level stands out as a strong resistance point. If this level is broken upwards, the uptrend is expected to continue. In the event of pullbacks due to developments in the opposite direction or profit-taking, it may test the $133.74 level. A decline to these support levels could increase buying momentum, presenting a potential upside opportunity.
Supports: 138.73 – 133.74 – 127.21
Resistances: 144.35 – 150.67 – 163.80
DOGE/USDT
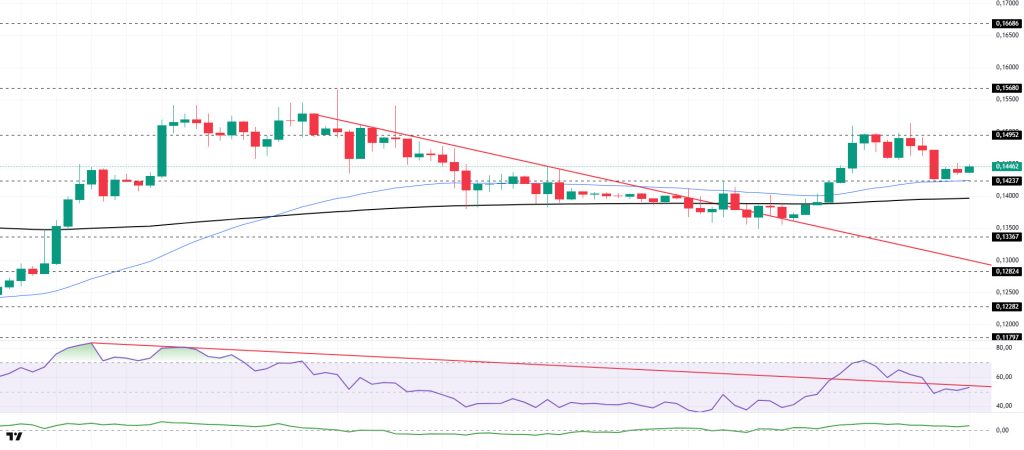
The DOGE price has lost value. The asset crossed below the 50 EMA (Blue Line) moving average and moved into the resistance zone. At the same time, the price, which also crossed below the upward trend line that began on December 31, is currently testing the 200 EMA (Black Line) moving average as support. If the pullback continues, the $0.13367 level can be monitored as support. If the uptrend resumes, the $0.14952 level could be retested as resistance.
On the 4-hour chart, the 50 EMA (Exponential Moving Average – Blue Line) remained above the 200 EMA (Black Line). This indicated that an uptrend was forming in the medium term. The price being between both moving averages indicates that the price is in a decision phase in the short term. Chaikin Money Flow (CMF-20) managed to stay in the positive zone. Additionally, an increase in cash inflows could push the CMF to the upper levels of the positive zone. The Relative Strength Index (RSI-14) fell slightly from neutral levels into negative territory. It is also located below the downward trend that began on January 3. A break above this level could increase buying pressure. In the event of potential increases driven by political developments, macroeconomic data, or positive news flow within the DOGE ecosystem, the $0.16686 level stands out as a strong resistance zone. Conversely, in the event of negative news flow, the $0.12824 level could be triggered. A decline to these levels could increase momentum and initiate a new wave of growth.
Supports: 0.13367 – 0.12824 – 0.12282
Resistances: 0.14237 – 0.14952 – 0.15680
SHIB/USDT
The focus of the Shiba Inu ecosystem has shifted to the K9 Finance DAO front, where the post-Shibarium exit plan has evolved into a more concrete migration and restructuring proposal. The new proposal highlighted in the DAO forum aims to select Arbitrum as the canonical operational chain, redistribute approximately 23% of the supply shortage associated with the bridge event to stakeholders on Arbitrum through a demand mechanism, and transfer treasury operations to this network with tighter control and reporting policies. This approach broadens the discussion beyond just chain selection to include revenue generation. It highlights two business lines that could generate sustainable fee income through yield vaults and DAO-owned liquidity models leveraging Arbitrum’s mature DeFi infrastructure. On the communication front, Lucie’s messages, reminiscent of the SOU framework, keep the narrative alive, while the acceleration seen in the burn flow over the last 24 hours has re-emerged as a complementary factor that could make supply dynamics more sensitive in the short term.
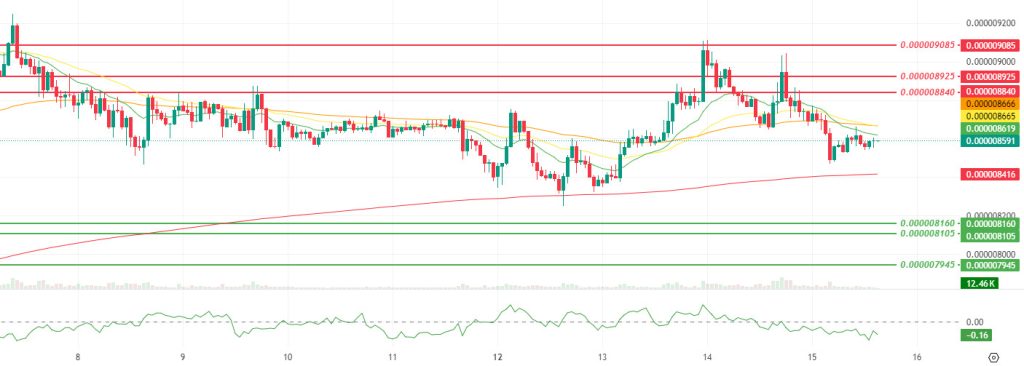
The technical chart shows that the break below the 200 Smoothed Moving Average (SMMA) highlighted in the previous report did not prove sustainable this time, and the price quickly rebounded to settle back above this average. The increase in volume and momentum indicates that this reversal is supported by stronger participation, while the decline in volatility suggests that the recovery is progressing in a more controlled manner compared to previous sharp swings. The Chaikin Money Flow (CMF) indicator returning to positive territory confirms that net capital flow has shifted to the buyer side, representing a significant change that suggests the hold above SMMA200 may be a repositioning supported by flow, not merely a technical reaction.
However, despite the price approaching the SMMA 9, 21, and 50 bands, its failure to clearly retake this zone and establish sustainability indicates that the short-term trend pressure has not been completely broken and that the upward movement is in a confirmation phase. In this context, if the price continues to close above SMMA 200 and recaptures the SMMA 9, 21, and 50 bands, resistance levels at $0.000008840 and $0.000008925 are likely to be retested. and if these bands are broken, the $0.000009085 level could become the next main target area. Conversely, if the hold above SMMA 200 weakens and the price falls back to around $0.000008415 and stabilizes there ( ), the recovery movement may turn into a reactionary one, increasing the risk of a pullback towards the support levels of $0.000008160 and $0.000008105. and if this band is also lost, the $0.000007945 level will once again come to the fore as the main equilibrium zone. (SMMA9: Green Line, SMMA21: Yellow Line, SMMA50: Orange Line, SMMA 200: Red Line)
Supports: 0.000008160 – 0.000008105 – 0.000007945
Resistances: 0.000008840 – 0.000008925 – 0.000009085
LEGAL NOTICE
The investment information, comments, and recommendations contained herein do not constitute investment advice. Investment advisory services are provided individually by authorized institutions taking into account the risk and return preferences of individuals. The comments and recommendations contained herein are of a general nature. These recommendations may not be suitable for your financial situation and risk and return preferences. Therefore, making an investment decision based solely on the information contained herein may not produce results in line with your expectations/

