
Fear & Greed Index
Source: Alternative.me
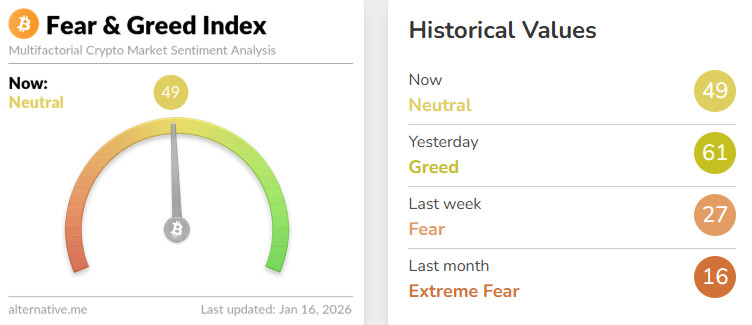
Change in Fear and Greed Value: +22
Last Week’s Level: 27
This Week’s Level: 49
The Fear and Greed Index rose from 27 to 49 this week, showing that sentiment has clearly recovered from the fear zone to neutral territory and that risk appetite has once again been supported by institutional flows and price momentum. On the crypto side, the clearest contribution to the index came from strong net inflows into US spot Bitcoin ETFs, which accelerated on January 13 and 14. In particular, the net inflow of approximately $843.6 million on January 14 alone reinforced the perception that institutional demand was returning, supporting buying appetite in the spot market. This inflow effect also reflected on the price side, with Bitcoin climbing above the $97,000 level midweek, contributing to the unwinding of the risk-off mode seen in recent weeks. On the US macro front, the December inflation data released on January 13 came in line with expectations, signaling a limited cooling in the core inflation, while weekly jobless claims remained low on January 15, weakening the scenario of a sharp deterioration and opening space for risk assets. However, as this data set did not completely undermine the narrative that the Fed would remain cautious in the near term, the improvement in the index progressed in a gradual and selective manner rather than an aggressive surge in risk appetite.
Crypto Fund Flows
Source: Coinshares
Overview:
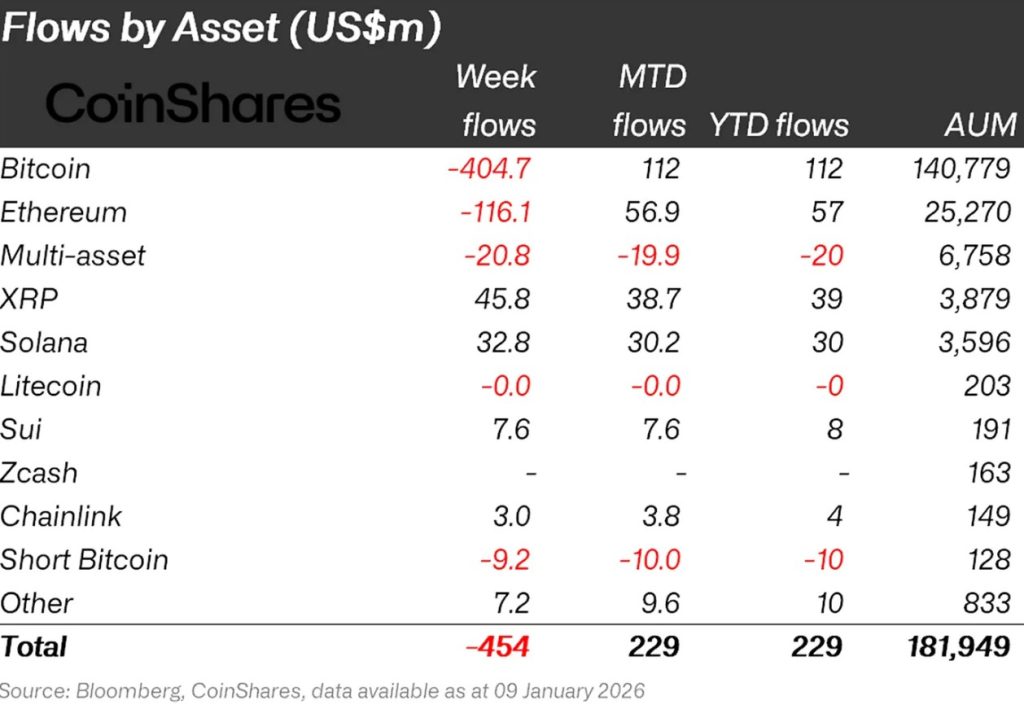
Crypto markets spent the week awaiting details of the US operation against Iran. Bitcoin and altcoins saw limited sideways movement. As a result, Bitcoin lost approximately 2% of its value over the week.
- Chainlink (LINK): Chainlink saw an inflow of $3.0 million.
- Solana (SOL): Solana saw an inflow of $32.8 million.
- Ripple (XRP): XRP saw $45.8 million in fund inflows this week.
- SUI: Sui saw an inflow of $7.6 million.
- Other: Sector- and project-based declines in altcoins, along with the general market sentiment, brought about $7.2 million in inflows in the fund flow data.
Fund Outflows:
- Bitcoin (BTC): Bitcoin experienced outflows from investors this week. Bitcoin-focused funds saw outflows of $404.7 million.
- Ethereum (ETH): Alongside spot ETH inflows, there was a $116.1 million outflow from Ethereum this week.
- Short Bitcoin: Short Bitcoin saw an outflow of $10.1 million.
- Multi-asset: Outflows were observed in the multi-asset group.
Total MarketCap
Source: Tradingview
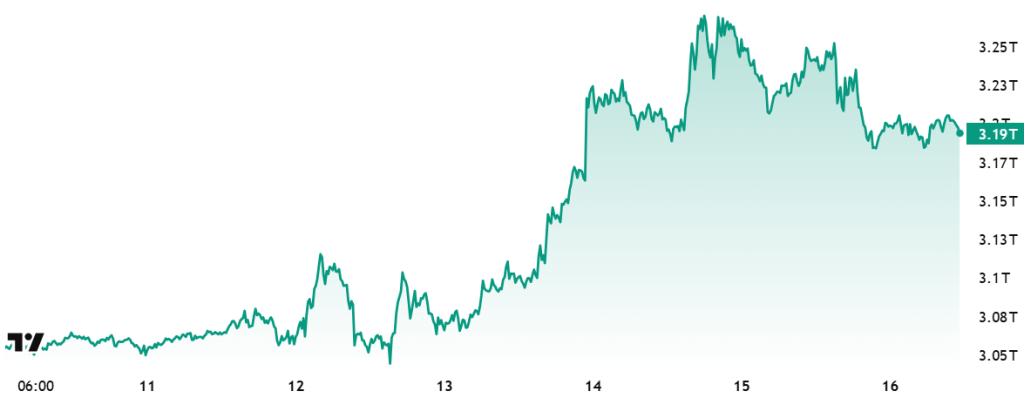
- Last Week’s Market Value:07 Trillion Dollars
- This Week’s Market Value: $3.19 Trillion
This week, the cryptocurrency market recorded an increase of approximately $122 billion, achieving a 4% rise, and the total market value stands at $3.19 trillion. The week’s peak was $3.29 trillion, while the lowest level was $3.04 trillion. Thus, the market was seen to move within a $250 billion band, indicating an 8.3% period-based volatility. While the increase in volatility compared to last week’s range is noteworthy, the weekly average candle size scale in the cryptocurrency market is seen to have returned to its normal volatility.
Total 2
Starting the week with a market value of $1.26 trillion, the Total 2 index rose 2.55% during the week, gaining approximately $31 billion in value and ending the period at around $1.29 trillion. The weekly high was recorded at $1.33 trillion, while the low was $1.24 trillion. The index fluctuated within a band of $96 billion, corresponding to a volatility of approximately 7.8% for the period. With this outlook, Total 2 continues to trade approximately $480 billion below its all-time high. The required rate of increase to reach its previous peak from current levels appears to be approximately 37.31%.
Total 3
Starting the week with a total market value of $879.21 billion, the Total 3 index grew by approximately $10 billion during the week, rising by 1.14% and closing the period at $889.21 billion. Volatility between the week’s highest and lowest values was 6.45%. With this outlook, Total 3 will have a more stable week than other market indices in relative terms.
The fact that the index-volatility ranking is proportionally “Total > Total 2 > Total 3” shows that volatile price movements are primarily concentrated on the Bitcoin side, followed by Ethereum and then the average of other altcoins. Additionally, Ethereum’s expansion in total market share during the current period (based on the difference between Total 2 and Total 3) is noteworthy.
Altcoin Season Index
Source: Coinmarketcap
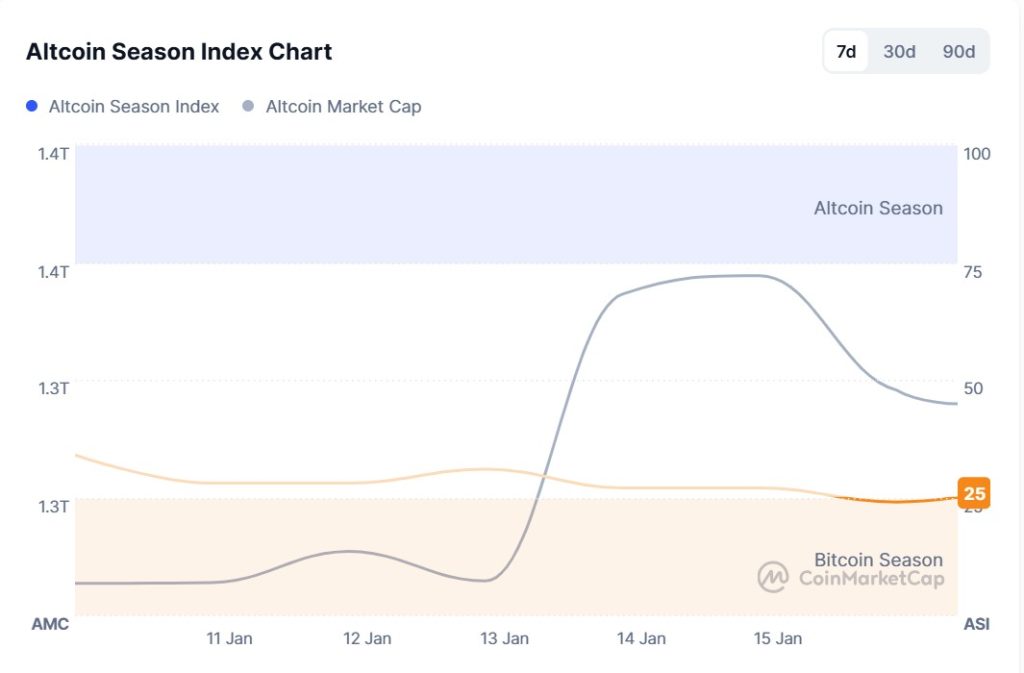
- Last Week’s Index Value: 42/100
- This Week’s Index Value: 25/100
Between January 10 and January 15, 2026, a decline was observed in the correlation between altcoin market dominance (Altcoin Market Cap) and the Altcoin Season Index. The graph shows that the index peaked at 31 on January 13 , with the Altcoin Market Cap reaching 1.34T. As the week drew to a close, selling pressure increased, leading to a decline in market dominance. The top 5 coins leading the index’s rise this week were XMR, DASH, MYX, ZEC, and H. US President Trump’s statements this week regarding Iran and his plan to remove Fed Chairman Powell from office caused a decline in the Altcoin Season Index, showing that the total market value of altcoins experienced a relative decrease compared to Bitcoin.
Bitcoin Dominance

Source: Tradingview
Weekly Change
- Last Week’s Level:14%
- This Week’s Level:70%
Bitcoin dominance, which started the week at 59.11%, continued to rise throughout the week and is currently at 59.70%.
This week, Strategy purchased 13,627 Bitcoin, DDC Enterprise purchased 200 Bitcoin, and Strive purchased 123 Bitcoin. Additionally, data on Bitcoin spot ETFs shows a total net inflow of $1.81 billion to date.
Weekly data reveals that Strategy, the world’s largest Bitcoin treasury company, has continued to increase its purchases. This outlook indicates not only the preservation of current positions but also a gradual resurgence of risk appetite on the institutional side. This trend, led by Strategy, is accompanied by other companies slowly but steadily beginning to take long positions. It appears that the wait-and-see period is beginning to fade, giving way to a cautious but buy-oriented accumulation process. On the investor front trading through ETFs, strong cash inflows recorded this week are noteworthy, reaching their highest level in the last three months. Global geopolitical tensions and the Fed interest rate decision to be announced at the end of the month are causing a cautious stance to be maintained in the markets. While this situation is relatively suppressing trading volumes, it maintains the potential for sharp price movements due to geopolitical risks. On the other hand, Bitcoin continues to show strength, and demand appears to be stable. Although Ethereum and major altcoins occasionally show limited positive divergence, no significant break in Bitcoin dominance is expected given the current market structure. In this context, Bitcoin dominance is expected to continue in the 58%–61% range next week.
Ethereum Dominance
Source: Tradingview
Weekly Change:
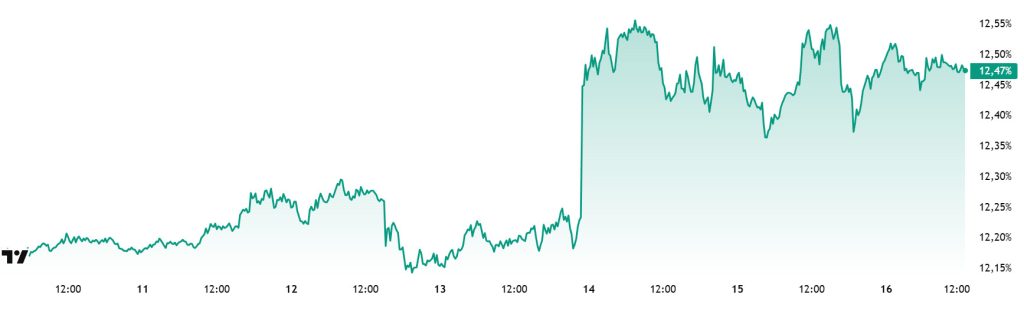
- Last Week’s Level: 12.26%
- This Week’s Level: 1 2.47%
Ethereum dominance, which rose to 15% levels in mid-August, lost momentum in the following period and entered a downward trend. This negative outlook was balanced by a positive correction until the last week of November, and in the following period, it reversed its direction and recorded an increase.
In this context, Ethereum dominance ended last week at 12.26% and is currently trading at around 12.47%. During the same period, Bitcoin dominance has also followed a positive trend alongside Ethereum dominance.
The key developments affecting Ethereum dominance are as follows:
Activity on the Ethereum network has increased significantly over the past month. This increase is attributed to new addresses interacting with the chain for the first time, rather than existing users conducting more frequent transactions. Monthly user tracking data pointed to a strong increase in the number of wallets interacting with the blockchain for the first time. Unlike previous periods, this increase revealed a broadening interest in DeFi, stablecoin transfers, NFTs, and new applications.
BitMine announced that it purchased 24,266 Ethereum last week. With this purchase, the company’s total Ethereum holdings reached 4,167,768 ETH. The current amount is equivalent to approximately 3.45% of the total Ethereum supply. The company also holds 193 Bitcoin and approximately $988 million in cash assets. BitMine’s total asset value is reported to have reached $14 billion.
Bitcoin Spot ETF
Source: Darkex Research Department
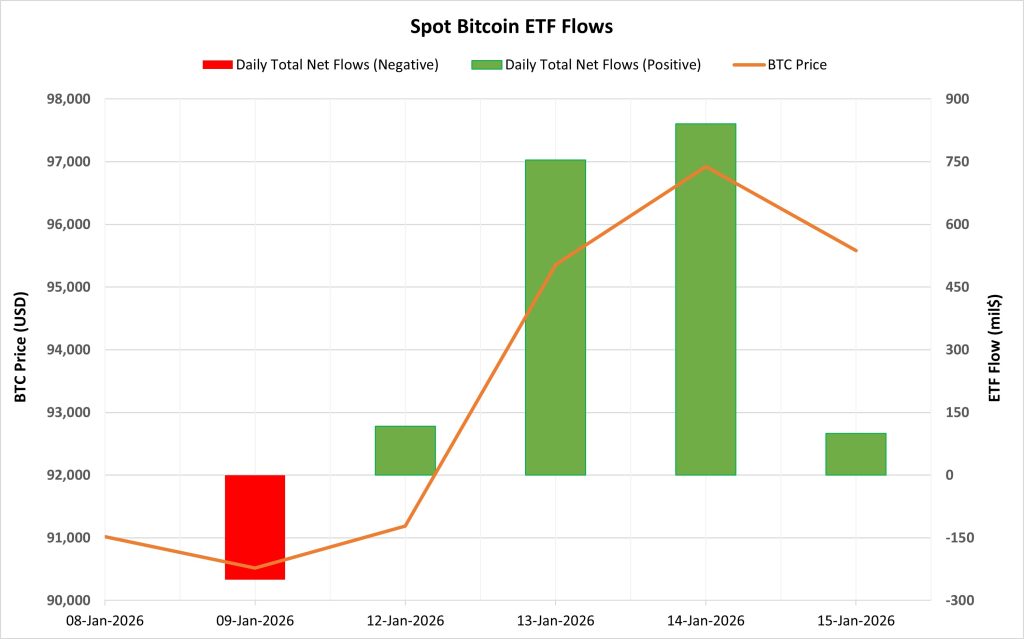
Netflow Status: Between January 9-15, 2026, a total of $1.56 billion in net inflows occurred into Spot Bitcoin ETFs. The four-day series of negative net flows ended as of January 12. During this period, the positive flow series rose to four days. Strong inflows, particularly $753.8 million on January 13 and $840.6 million on January 14, significantly supported the week’s total. Looking at the funds, inflows were mainly from BlackRock IBIT and Fidelity FBTC.
Bitcoin Price: Bitcoin opened at $91,021 on January 9 and closed at $95,583 on January 15. During this period, the BTC price rose by 5.01%. The strong 4.57% increase seen on January 13 coincided with high inflows into ETFs.
Cumulative Net Inflow: At the end of the 503rd trading day, the cumulative total net inflow of Spot Bitcoin ETFs rose to $58.196 billion.
|
Institutional demand for Spot Bitcoin ETFs regained momentum during this period. The end of the negative flow series and successive high-value inflows indicated that market confidence had recovered in the short term. The correlation between price and ETF flows revealed that the uptrend was based on a healthier foundation compared to previous periods. If positive flows continue on the ETF side in the coming period, Bitcoin prices are expected to maintain their upward momentum.
Ethereum spot ETF
Source: Darkex Research Department
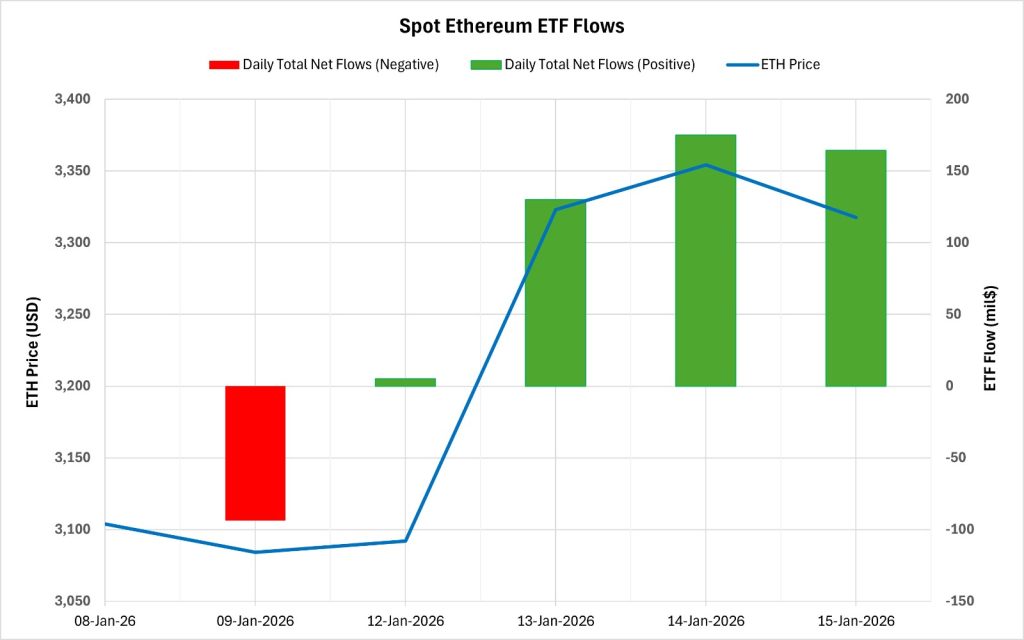
Between January 9-15, 2026, Spot Ethereum ETFs saw a total net inflow of $380.8 million. Following the negative flows seen at the end of the previous week, the new week started with a positive outlook, and the positive net flow series rose to four trading days. Looking at the funds, it was seen that the inflows were mainly from BlackRock ETHA. As of the 373rd trading day, the cumulative total net inflow for Spot Ethereum ETFs rose to $12.928 billion.
| Date | Coin | Open | Close | Change | ETF Flow (mil$) |
|---|---|---|---|---|---|
| 09-Jan-2026 | ETH | 3,104 | 3,084 | -0.63% | -93.8 |
| Jan 12, 2026 | ETH | 3,119 | 3,092 | -0.88% | 5.1 |
| January 13, 2026 | ETH | 3,092 | 3,323 | 7.47% | 130 |
| January 14, 2026 | ETH | 3,323 | 3,354 | 0.94% | 175.1 |
| January 15, 2026 | ETH | 3,354 | 3,318 | -1.09% | 164.4 |
| Total for January 9-15 | 6.88% | 380.8 |
Ethereum opened at $3,104 on January 9 and closed at $3,318 on January 15. During this period, the ETH price gained 6.88%. The upward movement in price gained momentum, particularly with the strong 7.47% daily increase seen on January 13, and it was noteworthy that this movement coincided with ETF inflows on the same days. The continued positive flows on the ETF side showed that institutional demand remained intact despite price pullbacks. If inflows continue on the ETF side in the coming days, the upward movement in the ETH price could be on more solid ground.
Bitcoin Options Distribution
Source: Laevitas
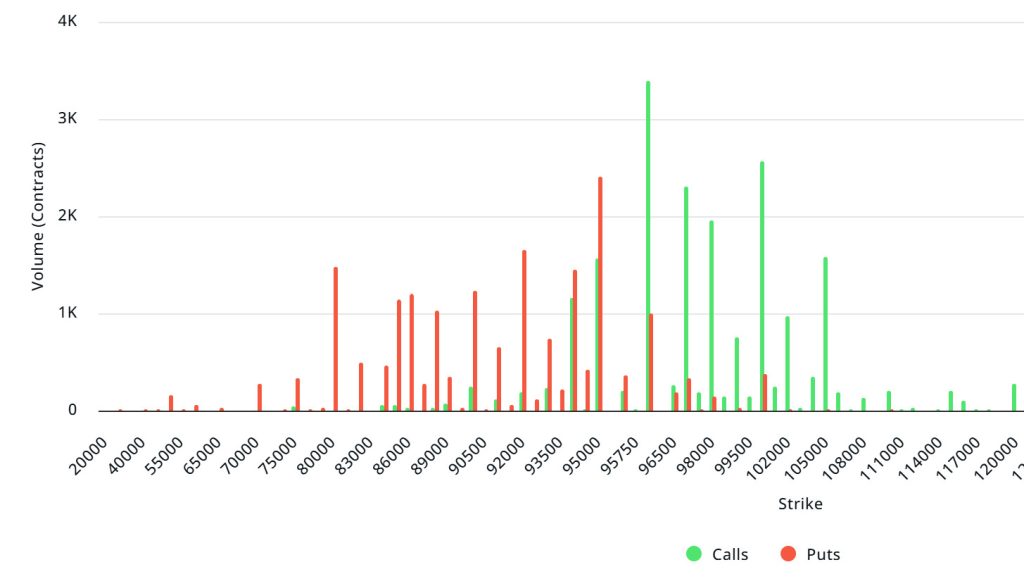
BTC: Notional: $2.34B | Put/Call: 0.72 | Max Pain: $92K
Deribit Data: Deribit data shows that BTC option contracts with a notional value of approximately $2.34 billion expire today. At the same time, looking at the risk transformation over the next week based on the last 24 hours’ data, put options are dominating over call options in terms of risk hedging. However, there is an increase in call options. When examining expected volatility (IV), it is above realized volatility (RV). On the other hand, the positive spread metric indicates increased risk appetite in the market, suggesting that call options are expensive. Skew values are pointing downward today and for the coming week.
Laevitas Data: Examining the chart, we see that put options are concentrated in a wide band between $80,000 and $96,000. Call options, on the other hand, are spread across a broad base between $94,000 and $105,000. At the same time, the $100,000 level appears to be resistance, while the $95,000 level appears to be support. On the other hand, there are 2.41k put options at the $95,000 level, peaking here and showing a decline in put volume after this level. Meanwhile, 3.39K call option contracts peak at the $96,000 level. Looking at the options market, we see that call contracts dominate on a daily and weekly basis.
Option Maturity:
Put/Call Ratio and Maximum Pain Point: Looking at the options in the latest 7-day data from Laevitas, the number of call options increased by approximately 3% compared to last week, reaching 105.99K at . In contrast, the number of put options decreased by 10% compared to last week, reaching 67K. The put/call ratio for options is set at 0.72. This indicates that there is more demand for call options than put options among investors. Bitcoin’s maximum pain point is seen at $92,000. BTC is currently priced at $95,670, and if it does not break below the pain point of $92,000, further increases can be expected.
Ethereum Options Distribution
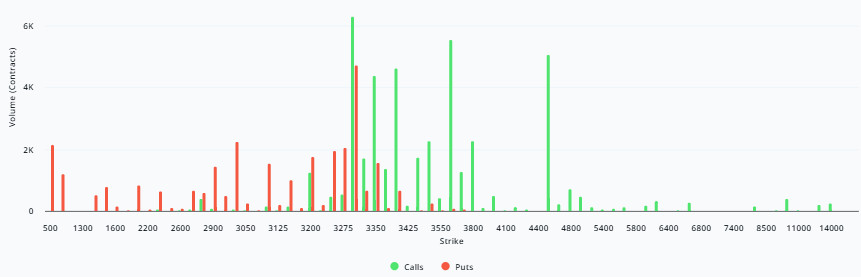
Source: Laevitas
ETH: $0.42 B notional | Put/Call: 0.77 | Max Pain: $3,200
Laevitas Data: Looking at the data in the chart, we see that put options are concentrated in a fairly narrow band, particularly at price levels between $3,250 and $3,350. The highest put volume is at the $3,300 level, with approximately 5K contracts. On the other hand, in call options, there is a noticeable concentration between the $3,300 and $3,600 levels. The highest call volume appears to be approximately 7K at the $3,300 level.
Deribit Data: First, we see that implied volatility (IV) has dropped by more than 10%. However, despite this downward trend, open interest has increased by over 35%. So, in which direction? There has been an increase in put option volume compared to last week. In contrast, interest in call options has decreased significantly. The risk reversal (RR) value is still positive, meaning call options are slightly more expensive than put options. Looking at the overall picture, we can say that we are going through a period where volatility has decreased compared to recent days, but positioning has increased. The rise in put volume, in particular, may cause some short-term nervousness in the market.
Option Maturity:
Ethereum options with a nominal value of $0.42 billion expired on January 16. The Max Pain level was calculated at $3,200, while the put/call ratio stood at 0.77.
Legal Notice
The investment information, comments, and recommendations contained in this document do not constitute investment advisory services. Investment advisory services are provided by authorized institutions on a personal basis, taking into account the risk and return preferences of individuals. The comments and recommendations contained in this document are of a general nature. These recommendations may not be suitable for your financial situation and risk and return preferences. Therefore, making an investment decision based solely on the information contained in this document may not result in outcomes that align with your expectations.
