
Technical Analysis
BTC/USDT
Trump’s new tariffs on Greenland have once again raised tensions with Europe. The EU Commission is expected to retaliate against the tariffs, which will take effect on February 1 against eight European countries. Meanwhile, Fed members continue to send cautious messages about interest rates, while there is talk that the process could be extended by six months despite the US Supreme Court not announcing the outcome of the customs duty case.
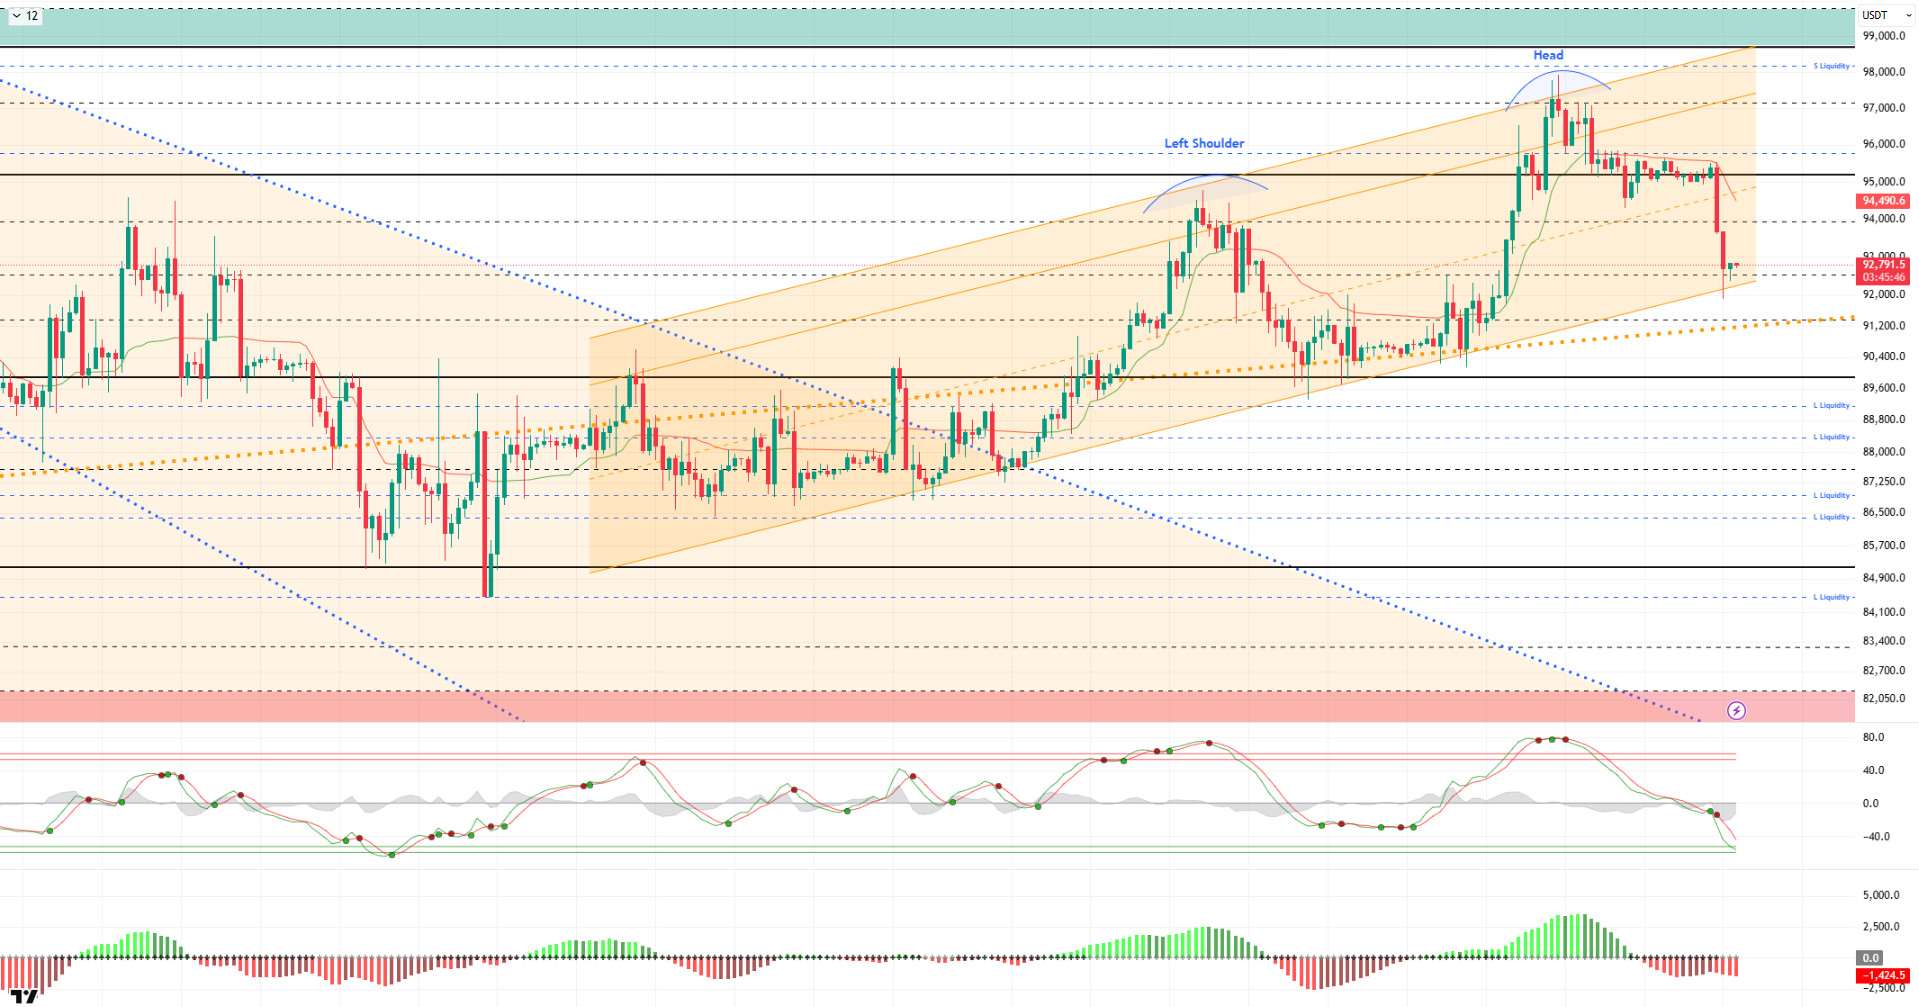
From a technical perspective, BTC continued to move parallel to the upward channel it had formed, while showing efforts to hold above the critical 95,000 level throughout the weekend. However, failing to hold here, the price faced strong selling pressure and tested the trend line at 92,000. BTC then recorded a slight recovery and continues to trade at the 92,700 level. In our previous analysis, we stated that for the OBO formation to be valid, the price would need to form a lower peak after the correction. Indeed, the price recorded a parallel correction, and its return to the 95,000 level in the next phase will be monitored.
Technical indicators show that the price, which retreated after the Wave Trend (WT) oscillator gave a sell signal in the overbought zone, continues to maintain the sell signal by reaching the oversold zone. The histogram on the Squeeze Momentum (SM) indicator has moved back into negative territory, confirming the downward trend. The Kaufman Moving Average (KAMA) is currently trading above the price at the $94.809 level.
Looking at liquidation data, the short-term buy level was liquidated at $93,300 with the recent decline. In a broader time frame, heavy accumulation continues within the $88,000–$90,000 range. In contrast, the sell level has built up intensity at the $96,000 level in the short term.
In summary, tensions rose in US foreign policy as Trump’s attempt to acquire Greenland was met with tariffs imposed on eight EU countries. While the EU’s countermeasure is anticipated, tariffs have once again become the focus of attention in the markets. Looking at liquidation data, following the recent upward breakout, long-term sell-side transactions became the target and were liquidated.In technical terms, BTC started the new year with positive momentum, first reaching the 95,000 level and then continuing its parallel movement to the upward channel, rising to the 98,000 level. Facing short-term profit-taking at these levels, the price returned to the 95,000 reference area. After holding here for a while, BTC faced strong selling pressure and retreated to the 92,000 level, which is the lower trend line. After this stage, the price holding within the trend channel paves the way for a new upward movement, with 95,000 being monitored as a critical resistance area. In the event of a potential new selling pressure, the 91,400 level, where the major uptrend passed, has become a critical point.
Supports: 91,400 – 90,000 – 89,000
Resistances: 92,600 – 94,000 – 95,000
ETH/USDT
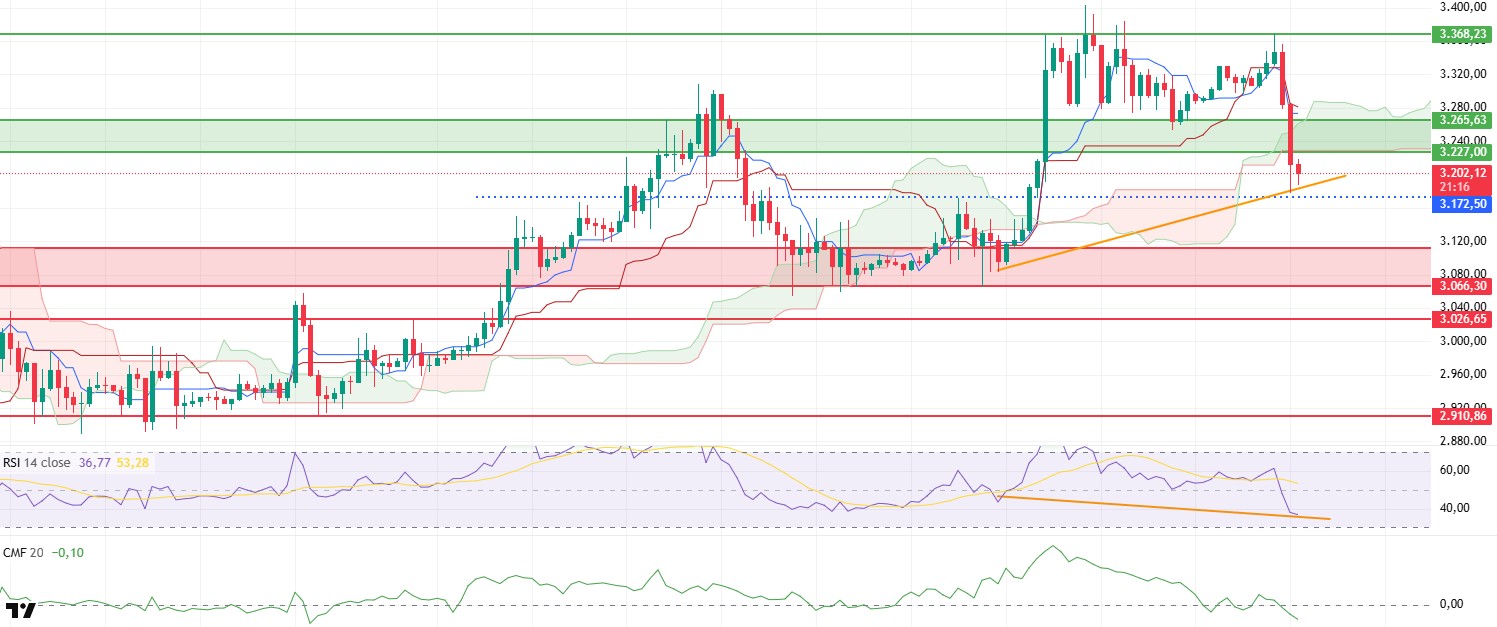
The ETH price turned downward at the weekly close amid a sharp deterioration in risk appetite. The negative opening of US futures markets due to concerns over US-EU tariffs accelerated selling, and the price fell below the $3,200 level. Uncertainty has increased for the price, which is currently seeking equilibrium in this region. It would not be surprising to see continued sharp ups and downs in the short term.
The liquidity picture has clearly weakened. The Chaikin Money Flow (CMF) has turned negative, accompanying the decline and indicating accelerated liquidity outflows. This suggests that the pullback is not limited to price action alone but is also supported by money flowing out of the market. Upward attempts are unlikely to be sustainable unless liquidity recovers.
There is a sharp cooling on the momentum side. The Relative Strength Index (RSI) has fallen to 37 levels. Despite this, the positive divergence forming on the RSI side is noteworthy. If the ETH price can hold at the $3,200 level, this divergence could strengthen the possibility of a short-term rebound.
The technical outlook has clearly turned negative from the Ichimoku indicator perspective. The price broke below the kumo cloud, and the Tenkan and Kijun levels were also lost. The Tenkan line cutting below the Kijun line confirms the sell signal. This structure indicates that the downward pressure has not completely subsided, even if there are corrective rallies.
In the broader picture, the target zone below is becoming clearer. If prices remain below $3,200, a pullback towards the $3,112 to $3,066 range is expected. This area, marked by a red rectangle on the chart, stands out as the main support zone in the short term. Conversely, if the ETH price holds around $3,200 and regains the $3,265 level, the upward reaction could gain momentum with the support of the positive divergence in the RSI. At this point, the market’s direction appears to depend on the reaction above the $3,200 level.
Below the Form
Supports: 3,172 – 3,066 – 3,026
Resistances: 3,227 – 3,265 – 3,368
XRP/USDT
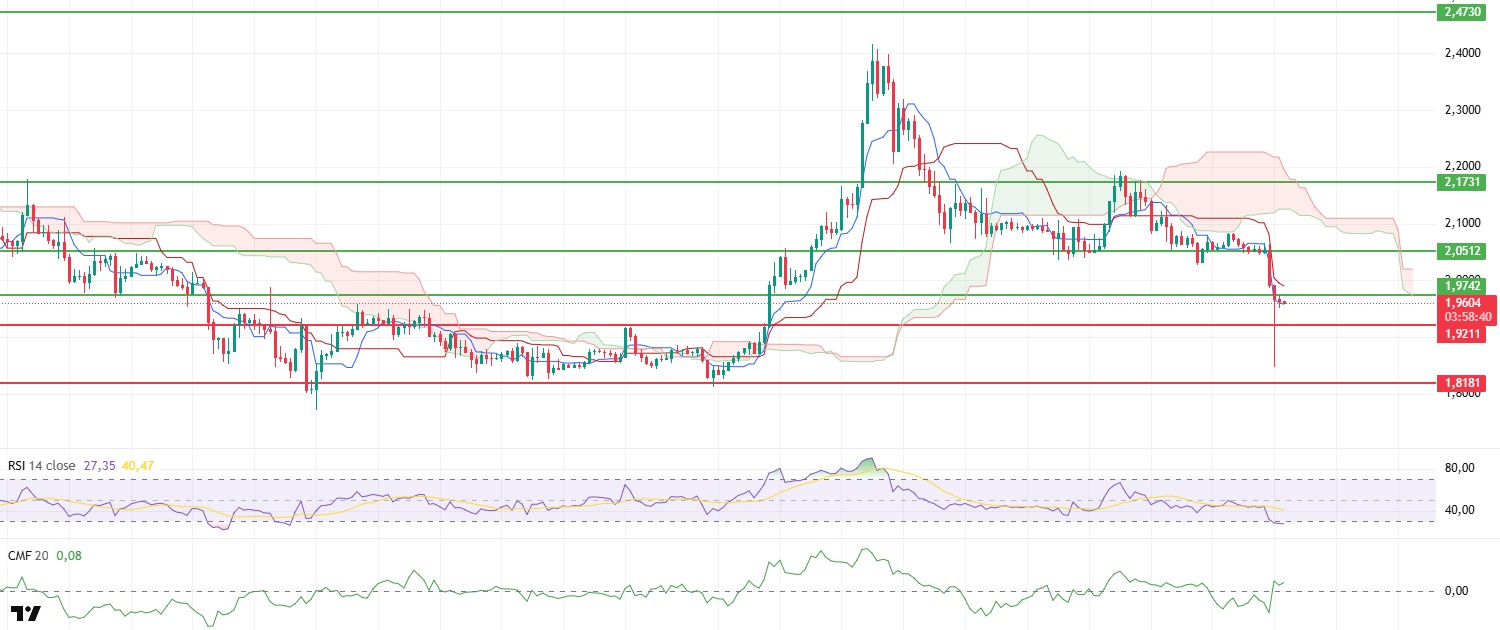
After losing the critical $2.05 support level at the weekly close, the XRP price fell sharply to the $1.85 level. Buying activity from this area halted the decline, and the price recovered towards the $1.96 level. While the rebound is a positive detail, the price remaining below the lost key support level indicates that risks persist in the short term.
There is no clear balance on the liquidity side. Chaikin Money Flow (CMF) showed considerable volatility alongside this sharp movement. It first fell into negative territory, then quickly recovered and returned to positive territory. The fact that liquidity inflows and outflows remain uncertain indicates that a clear signal of a sustained reversal in the market has not yet emerged. It is difficult to speak of a secure recovery until a more stable upward trend is seen in the CMF.
The momentum picture remains weak. The Relative Strength Index (RSI) has fallen into oversold territory. While this level generally increases the likelihood of a rebound, the RSI does not appear to be generating a strong reversal at this stage. The continued low momentum suggests that any upward moves may be short-lived.
The Ichimoku indicator also supports the negative picture, as the price has fallen below the kumo cloud’s tankan and kijun levels. Should the price break above the kumo cloud again, this decline could be interpreted as a correction signal.
In the overall assessment, the $2.05 level has once again become the main target. If the price regains this level during the day, the recovery movement could gain stronger ground and upward attempts could accelerate. However, as long as it remains below $2.05, downward pressure is likely to continue and the price could head back towards lower support levels.
Supports: 1.9211 – 1.8181 – 1.6224
Resistances: 1.9742 – 2.0512 – 2.1731
SOL/USDT
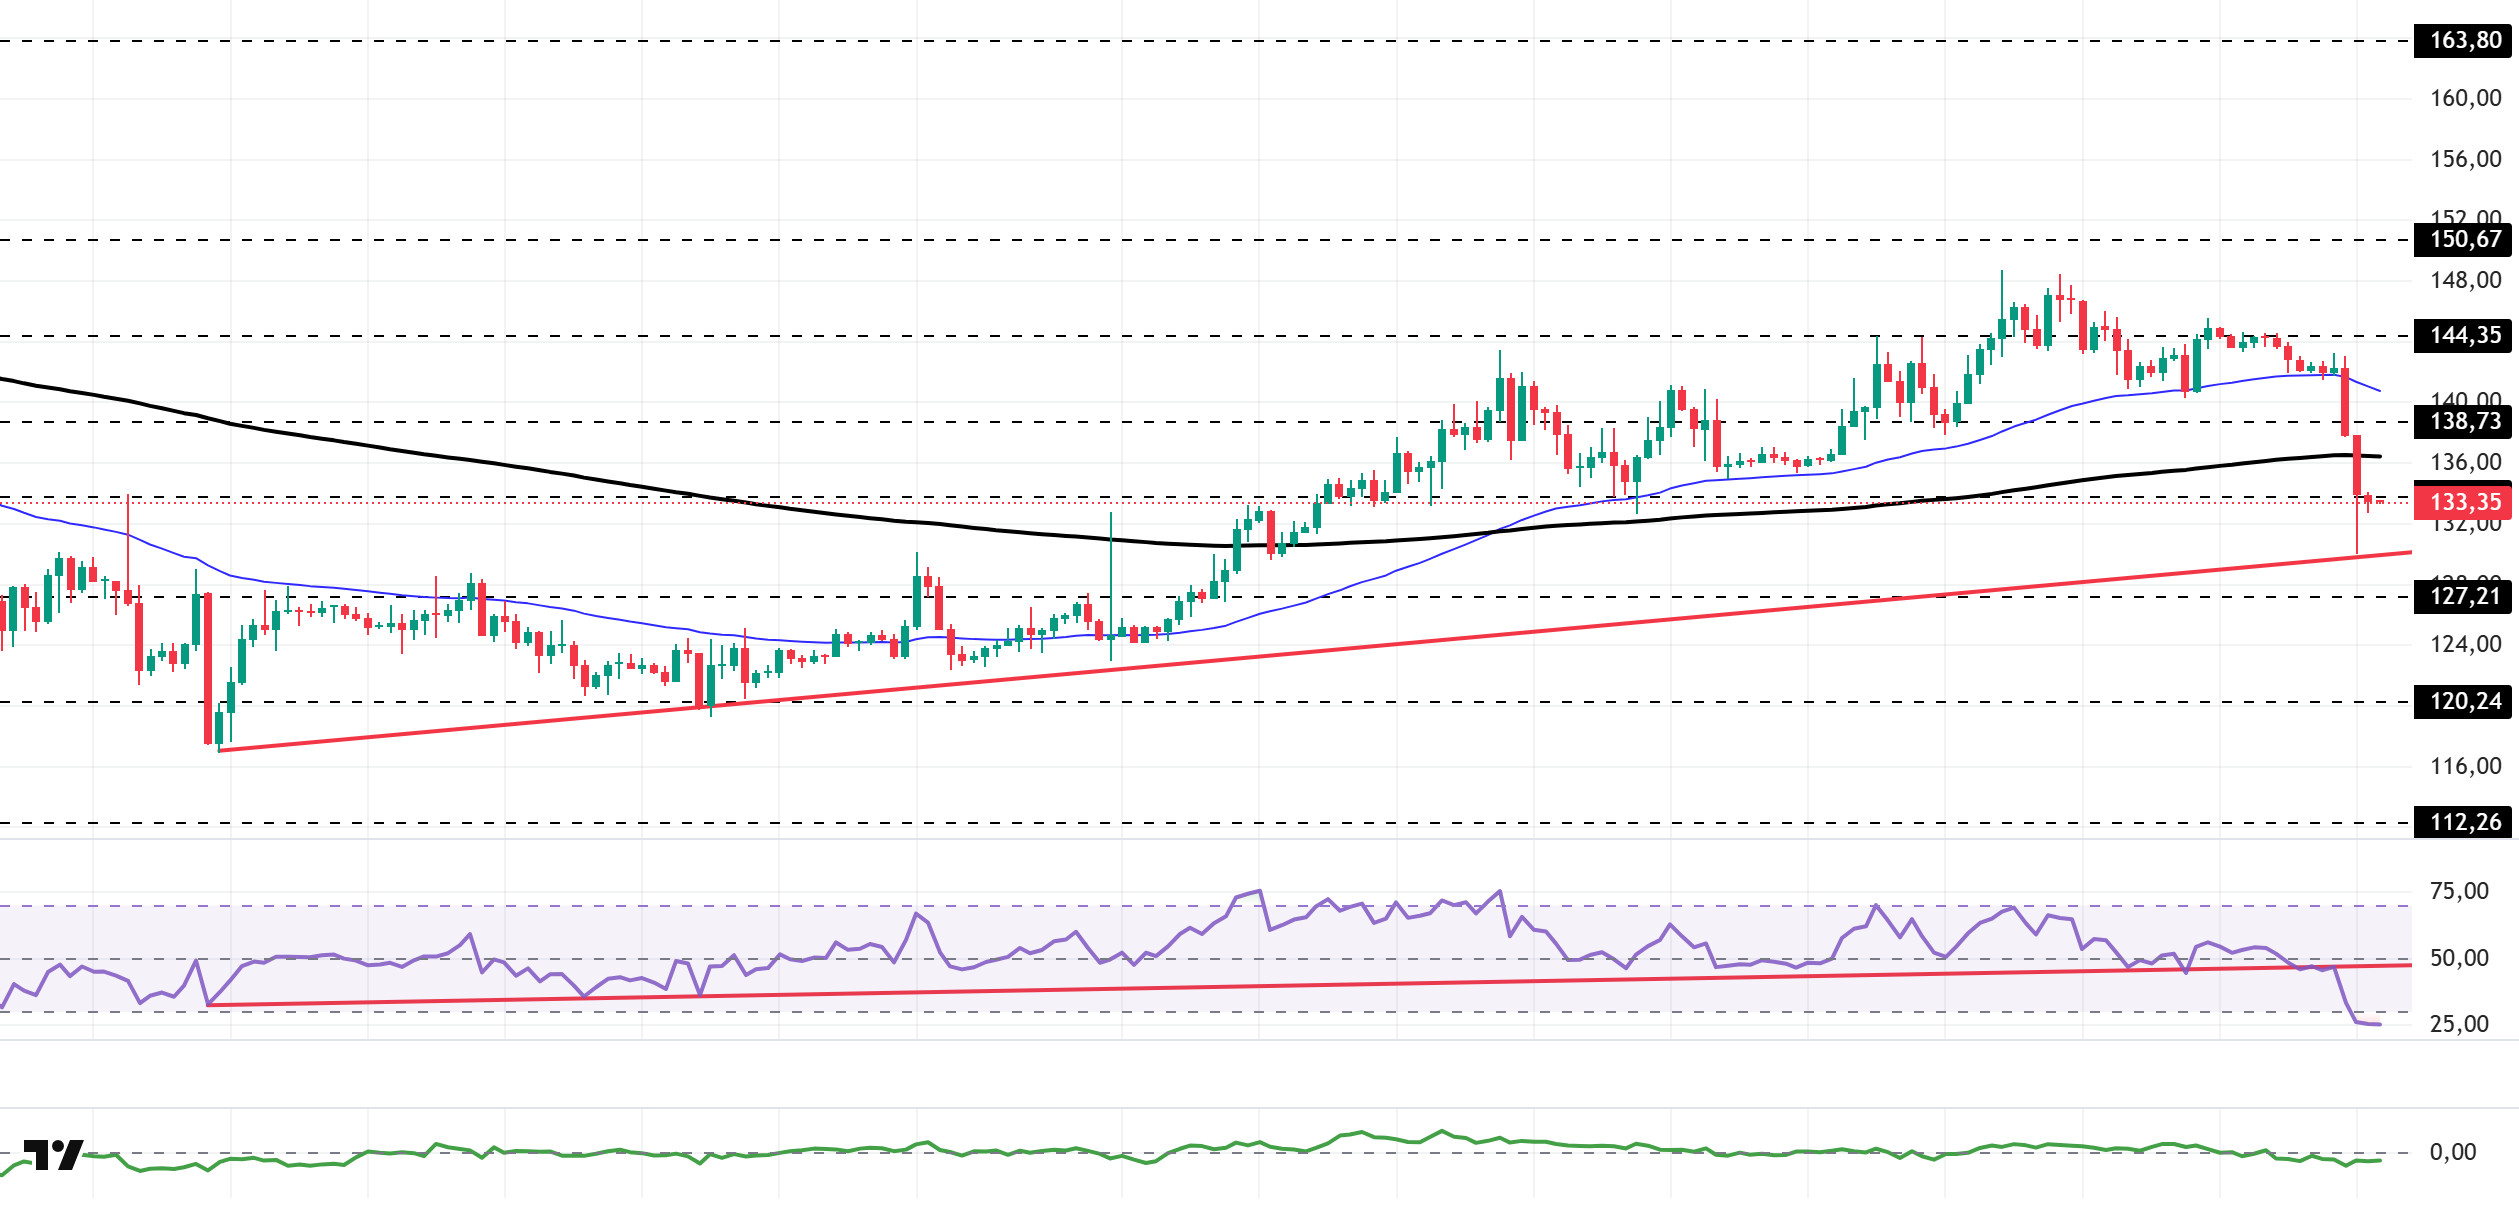
The SOL price experienced a pullback. The asset remained in the upper region of the rising line that began on December 18. Testing the 50 EMA (Blue Line) moving average and the 200 EMA (Black Line) moving average as support, the price broke below these levels, deepening its pullback. Gaining momentum from the upward trend and showing a slight increase, the asset is currently testing the $133.74 level as resistance. Above this level, it may test the 200 EMA moving average as resistance in candle closes. If the pullback continues, the upward trend should be monitored as a support level.
On the 4-hour chart, the 50 EMA (Exponential Moving Average – Blue Line) remained above the 200 EMA (Black Line). This indicated that an uptrend could begin in the medium term. At the same time, the price being below both moving averages signaled that the asset was trending downward in the short term. The Chaikin Money Flow (CMF-20) started to enter negative territory. However, the decrease in money inflows could push the CMF deeper into negative territory. The Relative Strength Index (RSI-14) broke below the upward trend that began on December 18, signaling increased selling pressure. Currently in the oversold zone, the metric may show a slight uptick if profit-taking occurs. If an uptrend occurs due to macroeconomic data or positive news related to the Solana ecosystem, the $150.67 level stands out as a strong resistance point. If this level is broken upward, the uptrend is expected to continue. In the event of pullbacks due to developments in the opposite direction or profit-taking, it may test the $120.24 level. A decline to these support levels could increase buying momentum, presenting a potential upside opportunity.
Supports: 127.21 – 120.24 – 112.26
Resistances: 133.74 – 138.73 – 144.35
DOGE/USDT
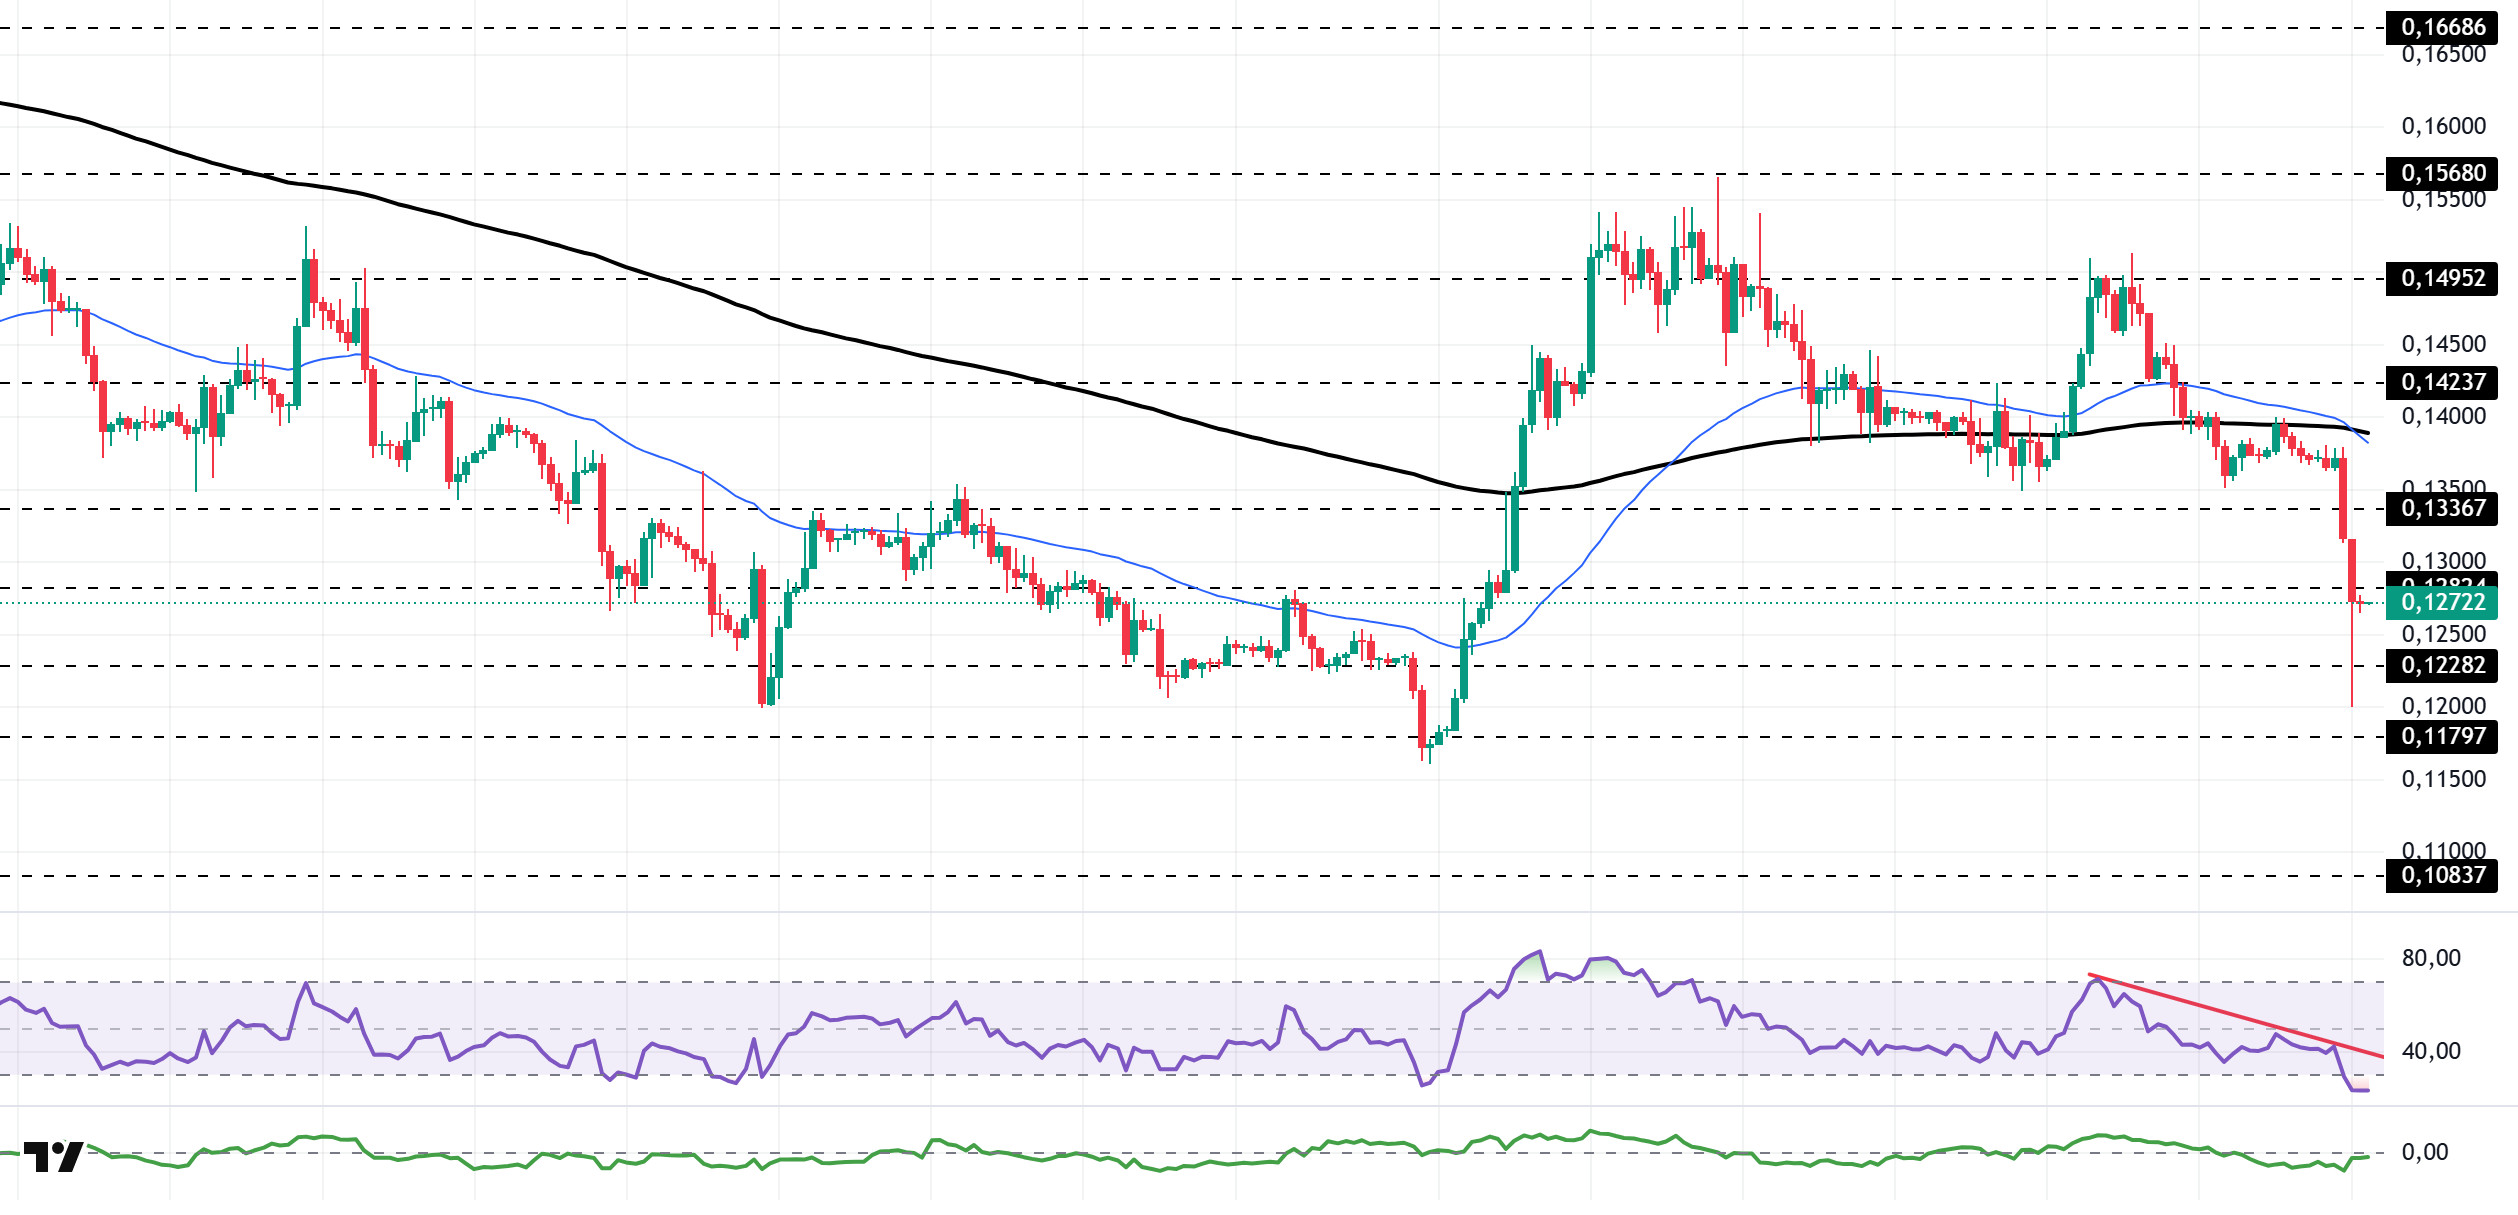
The DOGE price continued to lose value. The asset crossed below the 200 EMA (Black Line) moving average and moved into the lower region. After testing the strong support level of $0.12282 and experiencing a slight rebound, the asset is currently testing the resistance level of $0.12824. If it closes above this level, it could test the $0.13367 level. If the pullback continues, the $0.12282 level should be monitored.
On the 4-hour chart, the 50 EMA (Exponential Moving Average – Blue Line) crossed below the 200 EMA (Black Line). This indicates that a medium-term downtrend is forming. The price being below both moving averages indicates that the price may be trending downward in the short term. Chaikin Money Flow (CMF-20) has fallen from neutral to negative territory. Additionally, the balance of money inflows and outflows may keep CMF in negative territory. The Relative Strength Index (RSI-14) fell from neutral levels, declining to the oversold level in the negative zone. This may cause a slight increase due to profit-taking. At the same time, it remained in the lower region of the downward trend that began on January 14. This indicated that selling pressure continued. In the event of an uptrend driven by political developments, macroeconomic data, or positive news flow in the DOGE ecosystem, the $0.14952 level stands out as a strong resistance zone. Conversely, in the event of negative news flow, the $0.11797 level could be triggered. A decline to these levels could increase momentum and initiate a new wave of growth.
Supports: 0.12282 – 0.11797 – 0.10837
Resistances: 0.12824 – 0.13367 – 0.14237
SHIB/USDT
While network metrics on Shibarium indicate continued technical stability, it is clearer that capital remains selective in the DeFi layer. Blockscout data points to an average block time hovering around the 5-second range and the number of completed transactions exceeding 165 million, confirming that the infrastructure is functioning as intended. In contrast, DeFiLlama metrics show that the total value locked on Shibarium remains at $737,139, with a limited pullback of 1.19% over a 24-hour window. On the DEX side, although short-term volume remains low, the 7-day total volume has risen to $112,434, representing a 121.27% increase on a weekly basis, indicating that the appetite for intra-ecosystem trading has not completely faded and can revive during certain periods. On the burn front, the flow tracked via Shibburn maintains its rhythm with regular transfers divided into millions of pieces rather than one-off huge jumps, continuing to act as a background factor that gradually tightens supply dynamics throughout the day.
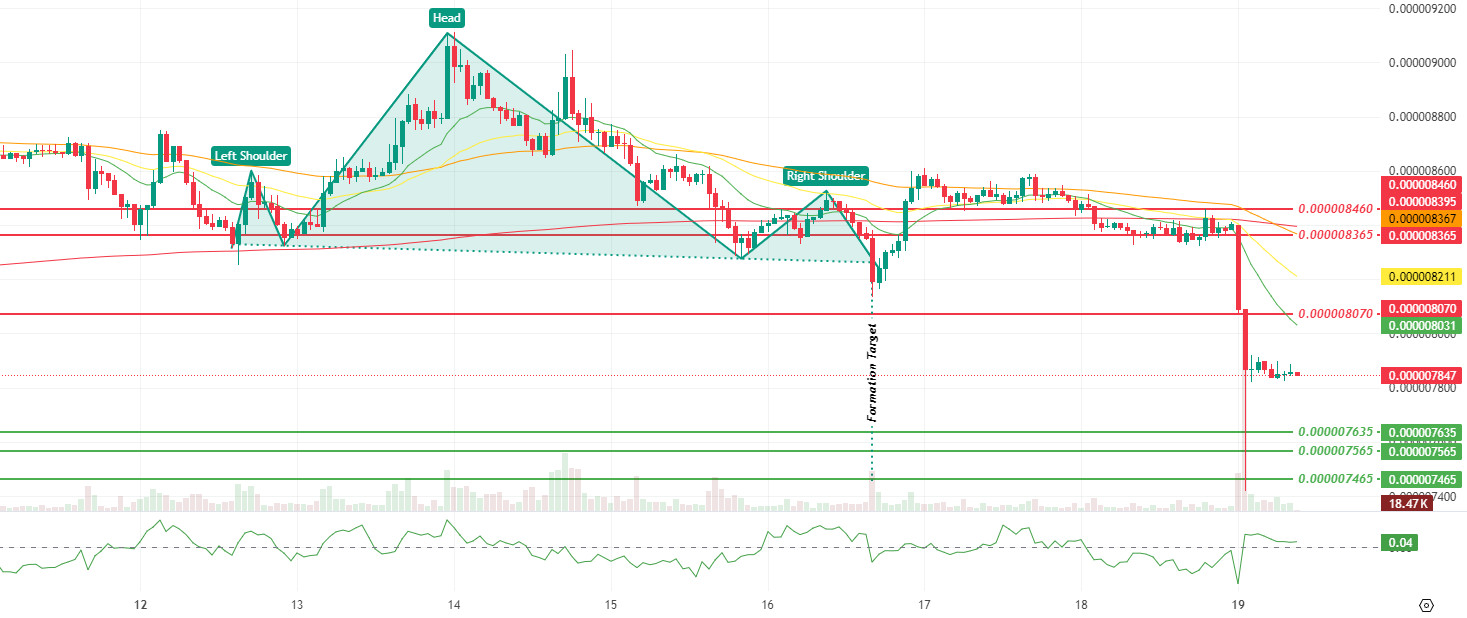
The technical picture shows that, with the break below the support line observed in the previous report, the price experienced a rapid liquidity gap, falling below the $0.000008070 level, and that the sell-off has shifted the search for a new equilibrium to the $0.000007635 band. The decline in momentum and volume suggests that buyers remained cautious after the initial breakout and that recovery attempts are struggling to gain traction at this stage. Meanwhile, the increase in volatility indicates that the price is fluctuating with sharper wicks despite weak participation, signaling that the market remains in a stressful pricing mode in the short term. The Chaikin Money Flow (CMF) indicator moving from negative to positive territory is a balancing signal, indicating that buyer liquidity has re-entered at the bottom after selling pressure and that efforts to establish a short-term bottom have begun. Additionally, the break of the neckline after the completion of the right shoulder in the Head and Shoulders (H&S) pattern visible on the chart was the main trigger that technically supported the acceleration of the sell-off. The measured target of the formation highlights the risk of a pullback towards the $0.0000076 band after the breakout, explaining why the support cluster around $0.000007635 has become critical.
In this context, the first critical threshold will be the $0.000008070 band. If the price recovers this level and manages to stay above it at closing, a more structured recovery attempt towards the $0.000008365 and subsequently $0.000008460 resistance levels may come into play. However, if weak closes persist below $0.000008070, the $0.000007635 support level could come under pressure again. Should this area be lost, selling pressure could deepen towards the $0.000007565 to $0.000007465 range. (SMMA9: Green Line, SMMA21: Yellow Line, SMMA50: Orange Line, SMMA 200: Red Line)
Supports: 0.000007635 – 0.000007565 – 0.000007465
Resistances: 0.000008070 – 0.000008365 – 0.000008460
Legal Notice
The investment information, comments, and recommendations contained herein do not constitute investment advice. Investment advisory services are provided individually by authorized institutions taking into account the risk and return preferences of individuals. The comments and recommendations contained herein are of a general nature. These recommendations may not be suitable for your financial situation and risk and return preferences. Therefore, making an investment decision based solely on the information contained herein may not produce results in line with your expectations.

