
BTC/USDT
Strategy purchased 22,305 Bitcoin with $2.13 billion in spending, while Bitmine strengthened its Ethereum holdings with ETH purchases. Meanwhile, Vanguard added $202.5 million to its portfolio by purchasing 1.23 million shares of Strategy ($MSTR). U.S. Treasury Secretary Bessent criticized the Fed’s monetary policy and stance in the Cook case, emphasizing that preserving independence is critical.
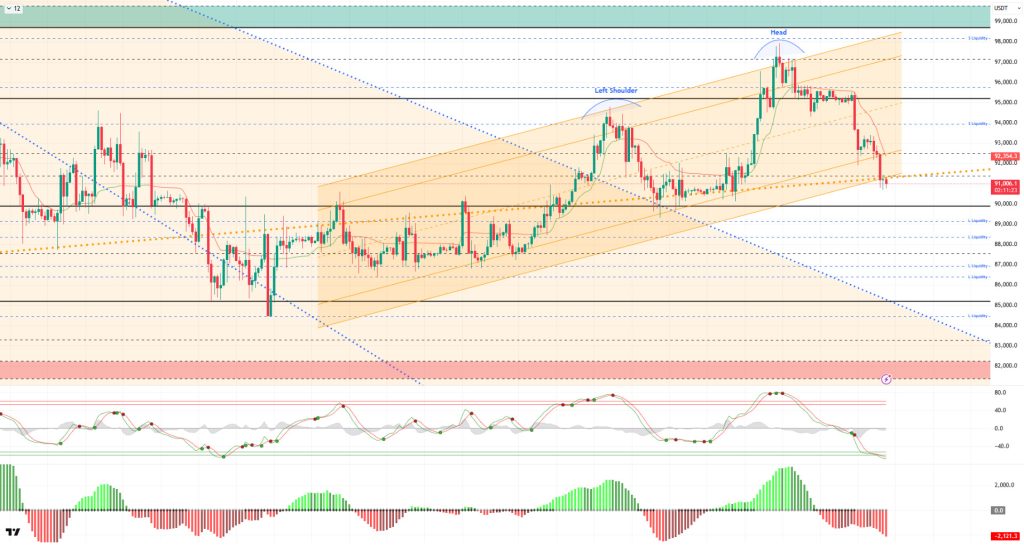
From a technical perspective, BTC failed to maintain its limited rise recorded at the 93,450 level. With increasing selling pressure, the price broke the lower line of the rising trend channel after a few attempts and touched the major uptrend line, extending the trend. At the time of writing, BTC is testing the 91,000 support level and attempting to hold above it. A break below this level could result in a loss of the critical 90,000 levels.
Technical indicators show that the Wave Trend (WT) oscillator is preparing to give a buy signal in the oversold zone, but has not yet produced a signal. The histogram on the Squeeze Momentum (SM) indicator has moved back into negative territory, confirming the downward trend. The Kaufman moving average (KAMA) is currently trading above the price level at $92.349.
Looking at liquidation data, the short-term buy level at $93,300 was liquidated with the recent decline. In a broader time frame, intense accumulation continues within the 88,000–90,000 band. In contrast, the selling level has formed intensity at 93,500 in the short term and 96,000 in the long term.
In summary, while President Trump’s insistence on Greenland continues, EU officials have decided to hold an emergency meeting to discuss possible countermeasures. In US domestic politics, while the Treasury Secretary sends messages of growth, Powell publicly announced his support for Cook.Meanwhile, Strategy continues to aggressively buy BTC. Technically, BTC started the new year with positive momentum, first reaching the 95,000 level and then continuing its parallel movement to the upward channel, rising to the 98,000 level. Facing short-term profit-taking at these levels, the price returned to the 95,000 reference area. After holding here for a while, BTC faced strong selling pressure and fell below the trend line to the 90,800 level. After this stage, the price holding within the trend channel paves the way for a new upward movement, with the 92,600 level being monitored as resistance. In the event of potential new selling pressure, the 90,000 level will once again be monitored as a critical reference point.
Supports: 91,400 – 90,000 – 89,000
Resistances: 92,600 – 94,000 – 95,000
ETH/USDT
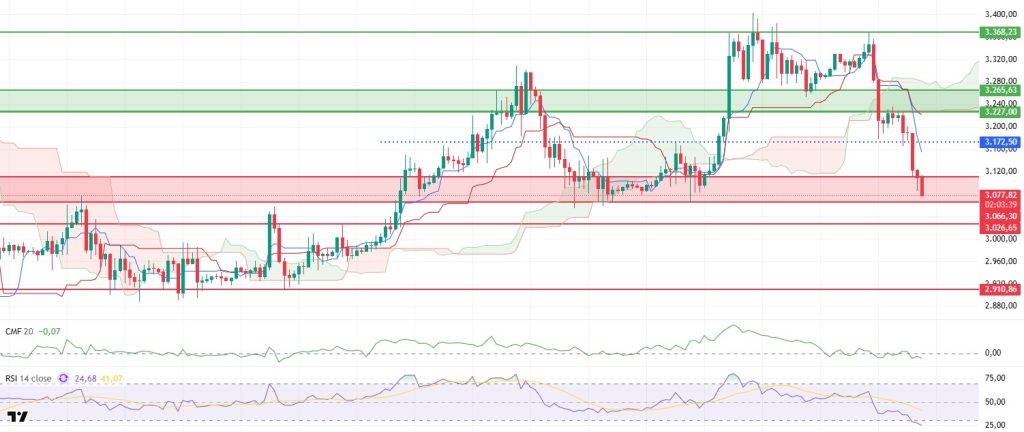
The ETH price continued its expected pullback during the day and began trading at around $3,080, returning to the critical support band. The weak consolidation efforts seen in the morning indicate that the selling side is still dominant.
The liquidity outlook remains under pressure. The Chaikin Money Flow (CMF) is trading in negative territory, indicating that money is still flowing out of the market strongly. The failure of liquidity to recover may cause any rebound rallies to be short-lived. Therefore, even if upward moves occur, it would not be surprising to see them met with rapid selling.
The Relative Strength Index (RSI) remains in oversold territory. The RSI’s failure to produce a clear reversal yet indicates that buyers lack sufficient strength to drive a recovery. As long as momentum remains this weak, it may become increasingly difficult for prices to generate upward movement.
Pressure continues on the Ichimoku indicator. While the price remains below the kumo cloud, the Tenkan and Kijun levels have still not been surpassed. This structure indicates that the short-term direction remains downward and that attempts at recovery are technically challenging. For the trend to be said to have recovered, these levels must first be regained.
In the overall assessment, the support zone marked in red remains the main focus of the day. If this zone is breached downward, selling pressure could intensify, and the decline could extend to the $3,020 and then $2,910 levels. Conversely, if the ETH price can reclaim the $3,172 level, the picture could change rapidly, and short-term pressure could give way to a more balanced outlook.
Supports: 3,066 – 3,026 – 2,910
Resistances: 3,111 – 3,172 – 3,227
XRP/USDT
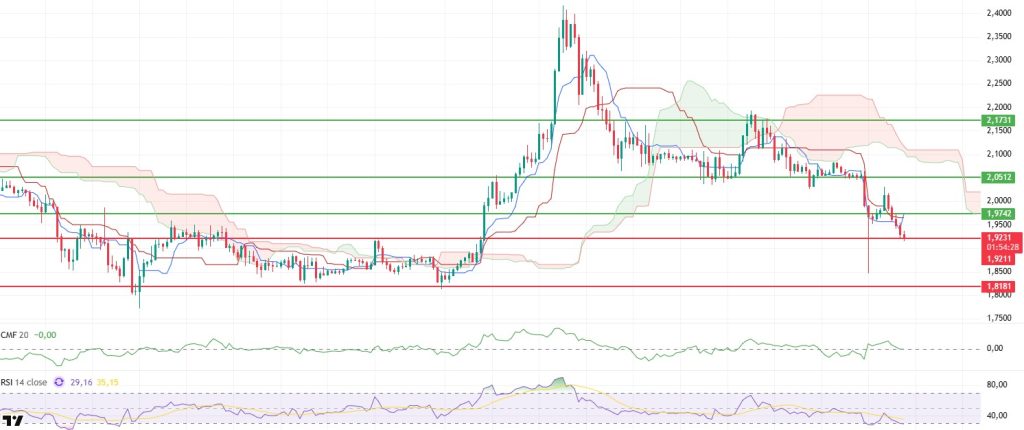
The XRP price continued to retreat amid ongoing selling pressure during the day, falling to the $1.92 level. The failure of yesterday evening’s recovery attempt to be sustained indicates that buyers remain weak and that the price has not fully broken through the downward pressure. The current pricing suggests a cautious and fragile outlook in the short term.
The picture is also weakening on the liquidity side. The Chaikin Money Flow (CMF) has fallen back to the zero line, indicating that strong liquidity inflows cannot be sustained. This clearly explains why the money entering the market is decreasing and why upward moves are fading so quickly. Unless liquidity regains strength, upward attempts are likely to remain limited.
Pressure is more clearly felt on the momentum front. The Relative Strength Index (RSI) has fallen back into oversold territory. Despite remaining at these levels, the RSI’s inability to generate a strong rebound indicates that momentum remains weak and buyers are reluctant to rally. As long as this pattern persists, it does not appear easy for the price to move higher.
Technically, there is no significant improvement in the Ichimoku indicator either. The price remains in a weak technical zone, and the overall outlook is negative. The lack of recovery on the Tenkan and Kijun sides may cause selling pressure to re-emerge in any upward attempts.
The main threshold remains unchanged in the overall assessment. As long as the XRP price fails to regain the $2.05 level, recovery attempts are likely to remain weak, and selling pressure is expected to persist. However, if there is a clear break above $2.05, the price could open up to upside potential. At this stage, the picture is under pressure, and buyers need to generate a stronger signal.
Supports: 1.9211 – 1.8181 – 1.6224
Resistances: 1.9742 – 2.0512 – 2.1731
SOL/USDT
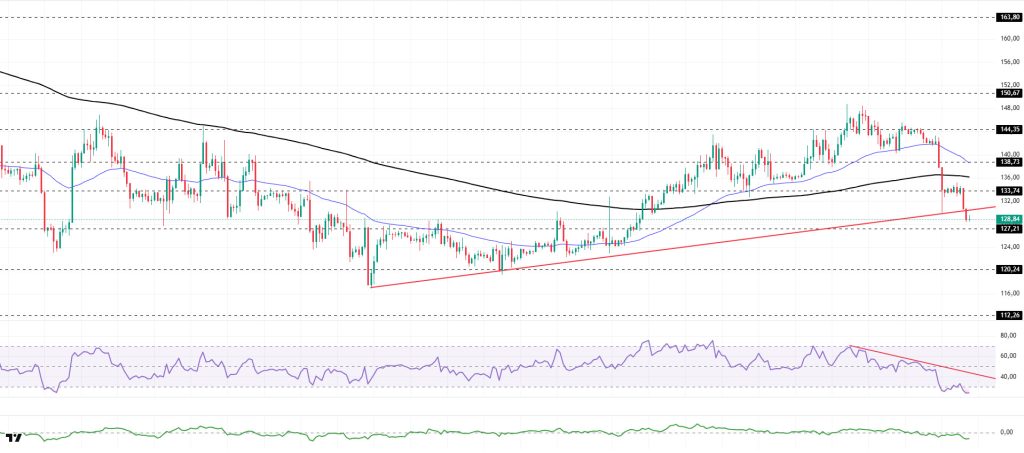
The SOL price continues to experience pullbacks during the day. The asset moved to the lower region of the rising line that began on December 18. Testing the rising line, the price broke below this level and deepened its pullback. Currently preparing to test the $127.21 level as support, the asset could deepen its pullback and test the $120.24 level if it closes below this level. If it rallies, it could test the rising trend line as resistance.
On the 4-hour chart, the 50 EMA (Exponential Moving Average – Blue Line) remained above the 200 EMA (Black Line). This indicated that an uptrend could begin in the medium term. At the same time, the price being below both moving averages signaled that the asset was trending downward in the short term. The Chaikin Money Flow (CMF-20) remained in negative territory. However, the decrease in cash inflows and outflows could push the CMF deeper into negative territory. The Relative Strength Index (RSI-14) remained below the downward trend that began on January 14, indicating continued selling pressure. Currently in the oversold zone, the metric may show a slight increase if profit-taking occurs. If an uptrend occurs due to macroeconomic data or positive news related to the Solana ecosystem, the $150.67 level stands out as a strong resistance point. If this level is broken upwards, the uptrend is expected to continue. In the event of pullbacks due to developments in the opposite direction or profit-taking, it may test the $120.24 level. A decline to these support levels could increase buying momentum, presenting a potential upside opportunity.
Supports: 127.21 – 120.24 – 112.26
Resistances: 133.74 – 138.73 – 144.35
DOGE/USDT
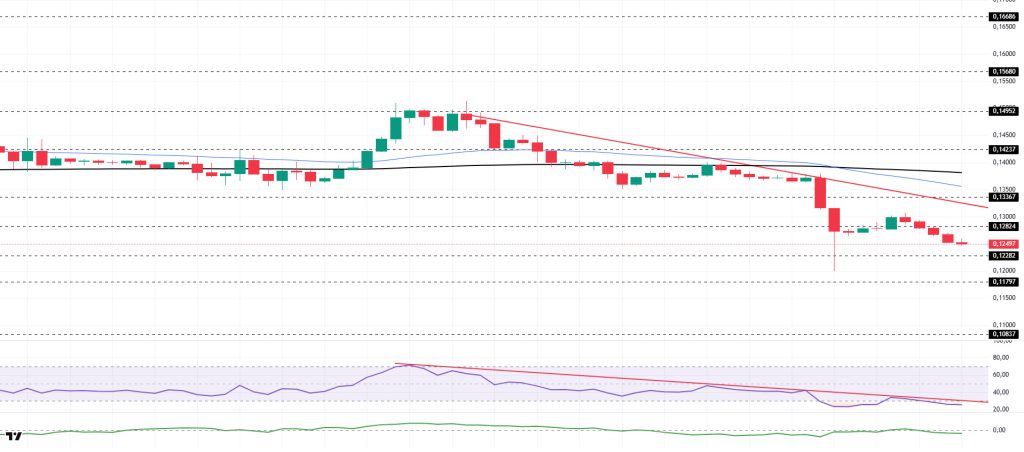
The DOGE price lost value during the day. The asset remained in the lower region of the downward trend that began on January 14. It also broke below the 200 EMA (Black Line) moving average and moved into the lower region. After testing the strong support level of $0.12282 and experiencing a slight rebound, the asset is currently losing its gains and preparing to retest this level as support. Candlestick closes below the $0.12282 level could deepen the pullback, causing the price to test the $0.11797 level. If it experiences an uptrend, the $0.12824 level and the descending trend should be monitored.
On the 4-hour chart, the 50 EMA (Exponential Moving Average – Blue Line) remained below the 200 EMA (Black Line). This indicated that a medium-term downtrend was forming. The price being below both moving averages suggests that the price may be trending downward in the short term. The Chaikin Money Flow (CMF-20) remained in negative territory. Additionally, a decrease in cash inflows could push the CMF deeper into negative territory. The Relative Strength Index (RSI-14) remained in the oversold zone. This could lead to a rebound due to profit-taking. It also continued to stay below the downward trend line that began on January 14. This signaled that selling pressure persisted. In the event of a rise due to political developments, macroeconomic data, or positive news flow in the DOGE ecosystem, the $0.14952 level stands out as a strong resistance zone. Conversely, in the event of negative news flow, the $0.11797 level could be triggered. A decline to these levels could increase momentum and start a new wave of growth.
Supports: 0.12282 – 0.11797 – 0.10837
Resistances: 0.12824 – 0.13367 – 0.14237
SHIB/USDT
On the Shiba Inu side, the day’s flow was highlighted by tightening signals strengthening simultaneously from two separate channels in the supply dynamics. On the burn front, with the burn rate rising sharply, a total of 28,863,518 SHIB was permanently removed from circulation, with the weight of transactions concentrated around a single large transfer, which had a more singular jump character. Parallel to this, the reappearance of large wallet movements supports a picture of sellable inventory being withdrawn from exchanges and transferred to longer-term storage wallets. According to on-chain data shared in the news feed, exchange reserves fell from approximately 82.6 trillion SHIB to 82.23 trillion SHIB within a few days, meaning that approximately 370 billion SHIB left exchanges; it is also reported that net outflows reached 51.2 billion SHIB on an intraday scale. While this combination creates a backdrop that could make liquidity more sensitive, the narrative’s persistence seems to depend on whether one-off transactions or a sustained rhythm will prevail on the burn side, and whether the downward trend in exchange reserves will continue.
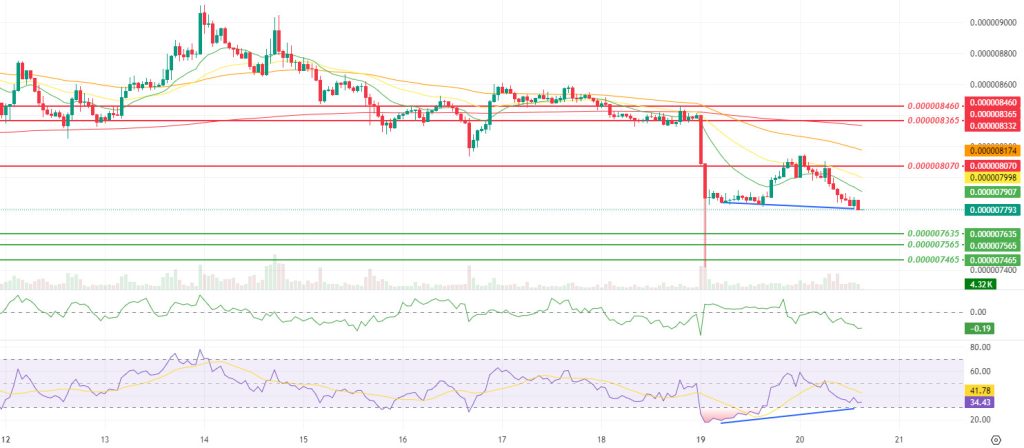
The technical picture shows that the reaction following the sharp break has weakened and that the price has failed to confirm a recovery by remaining below the Smoothed Moving Average (SMMA) averages. The simultaneous decline in momentum, volume, and volatility indicates that the latest move is progressing with less energy than the previous wave, while the Chaikin Money Flow (CMF) indicator remaining in negative territory confirms that net capital flows are still predominantly selling and that upward attempts are not supported by the flow. However, the preservation of the positive divergence (Blue Line) between the Relative Strength Index (RSI) and the price stands out as a balancing signal, indicating that downward momentum is beginning to weaken as the price tests new lows and that the potential for a rebound has not been completely lost.
In this context, the main threshold in the short term remains at the $0.000008070 level. If the price recovers this band and then breaks above the SMMA 9, 21, and 50 set to produce sustainability, a more structured recovery attempt towards the $0.000008365 and then $0.000008460 resistance levels may come to the fore. For this scenario to gain traction, it is critical that the CMF exits the negative zone. Conversely, if weak closes persist below $0.000008070 and positive divergence remains ineffective, the $0.000007635 support level could come under pressure again ; and if this area is lost, the risk of deeper selling towards the support cluster of $0.000007565 and $0.000007465 will increase. (SMMA9: Green Line, SMMA21: Yellow Line, SMMA50: Orange Line, SMMA 200: Red Line)
Supports: 0.000007635 – 0.000007565 – 0.000007465
Resistances: 0.000008070 – 0.000008365 – 0.000008460
Legal Notice
The investment information, comments, and recommendations contained herein do not constitute investment advice. Investment advisory services are provided individually by authorized institutions taking into account the risk and return preferences of individuals. The comments and recommendations contained herein are of a general nature. These recommendations may not be suitable for your financial situation and risk and return preferences. Therefore, making an investment decision based solely on the information contained herein may not produce results in line with your expectations.

