
Active Addresses
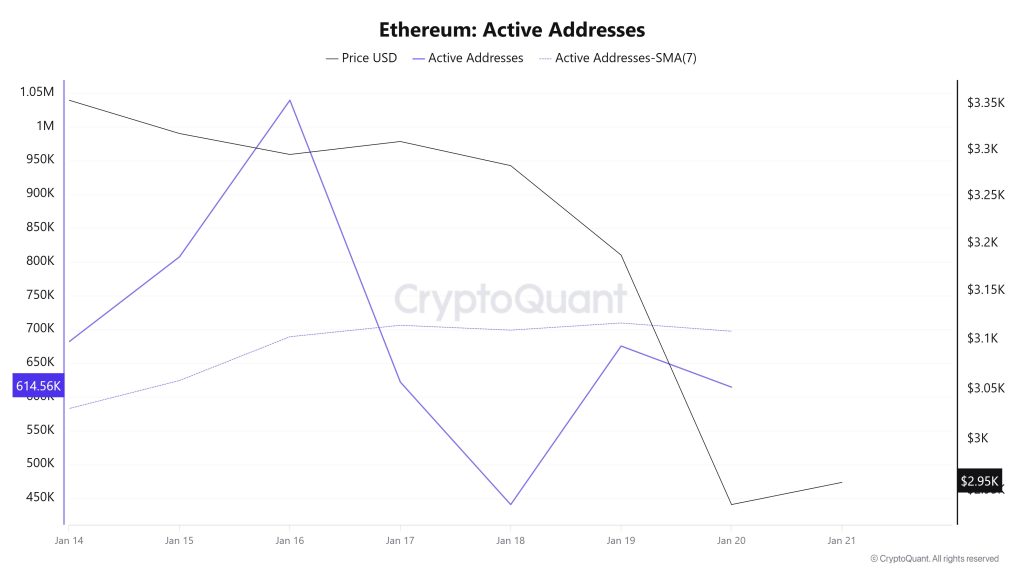 Between January 14 and January 21, a total of 1,039,261 active addresses were added to the Ethereum network. During this period, the Ethereum price retreated from $3,294 to $2,936. On January 19, in particular, a significant decline was observed in both the number of active addresses and the price point when the price touched the active address. When examining the 7-day simple moving average (SMA), it is seen that the Ethereum price is generally trending downward.
Active Sending Addresses
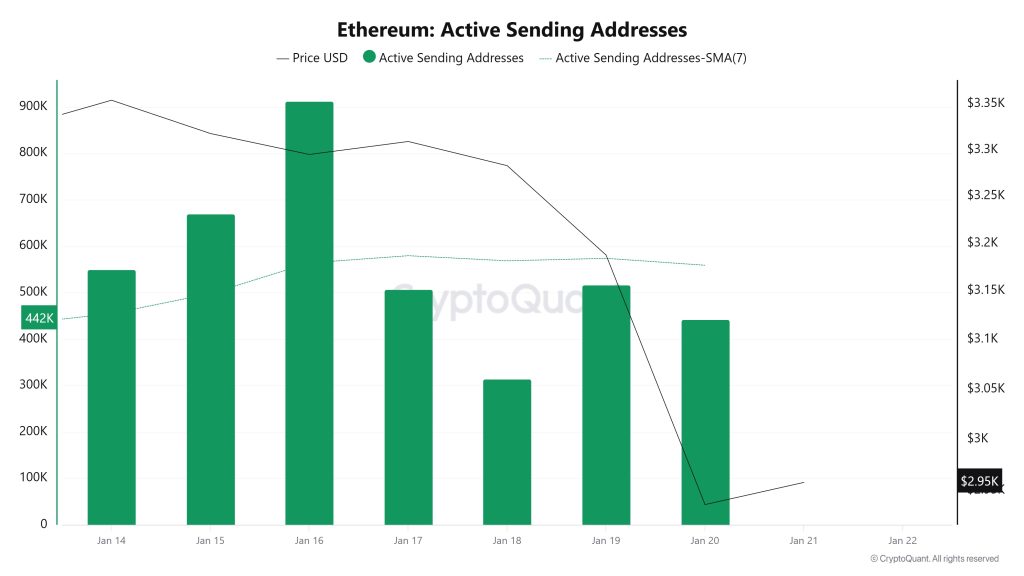
Between January 14 and January 21, high levels of active sending activity were observed in active sending addresses along with the Black Line (price line). On the day the price reached its highest level on a weekly basis, active sending addresses reached 912,584.
Active Receiving Addresses
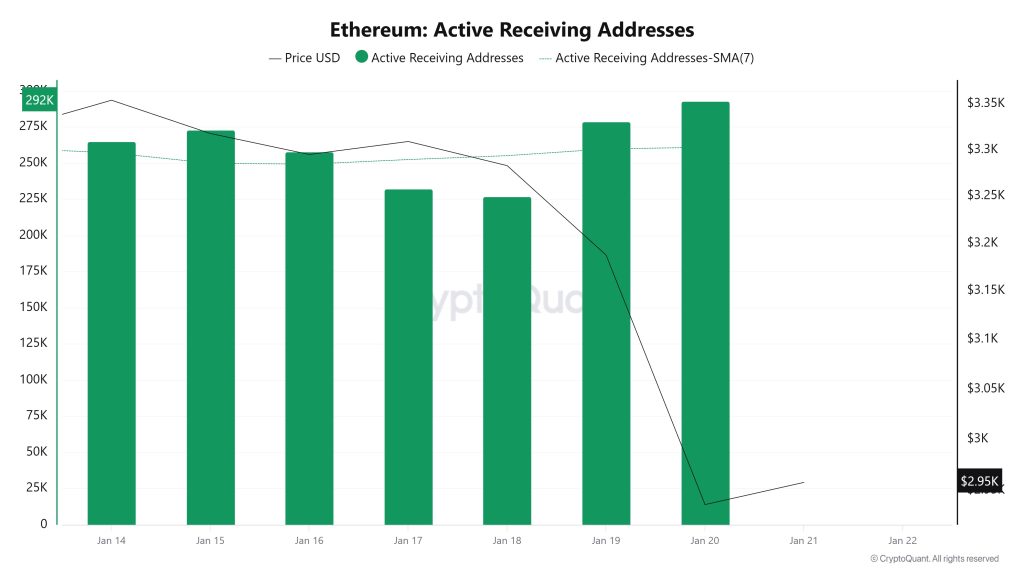
Between January 14 and January 21, while there was no significant increase in active receiving addresses, the price was seen to move upward. On the day the price reached its highest level, active receiving addresses reached 292,866, indicating an increase in sales.
Total Value Staked
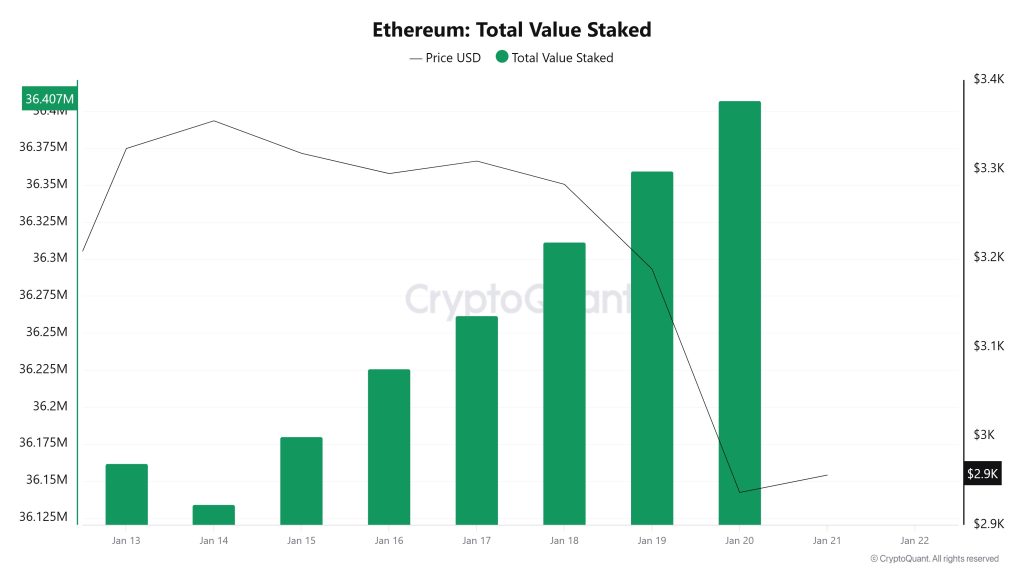 On January 14, while the ETH price was trading at $3,354, the Total Value Staked was at 36,134,178. As of January 20, the ETH price fell to $2,936, recording a 12.46% decline, while Total Value Staked rose to 36,407,644, recording a 0.76% increase. The increase in Total Value Staked indicates that despite the price pullback, the total amount locked in staking continues to grow and the tendency to maintain current stake positions persists. This divergence confirms that even as the price weakens in the short term, accumulation is maintained in staking rather than unwinding, and supply continues to remain in the staking channel.
Staking Inflows
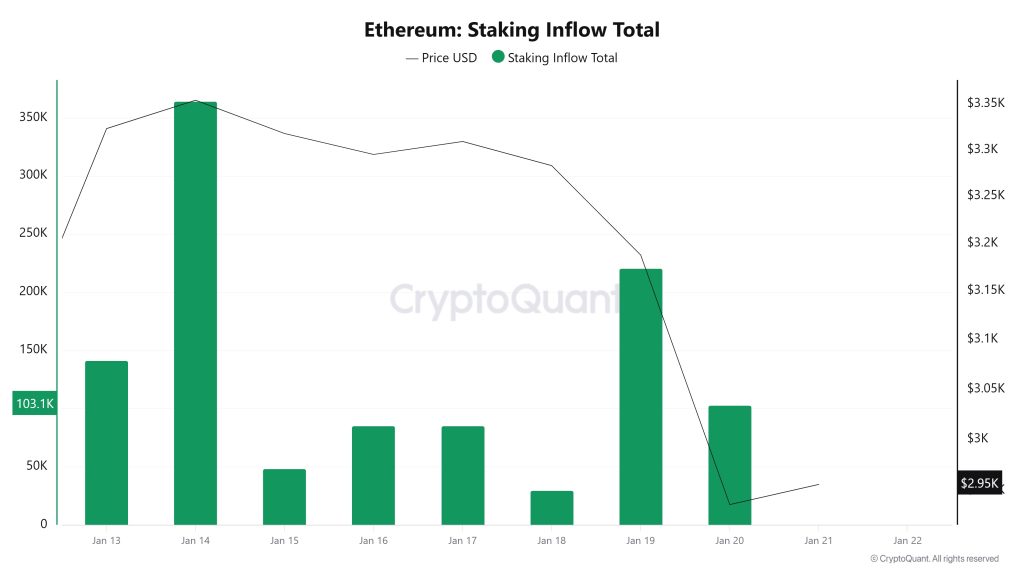
On January 14, when the ETH price was trading at $3,354, Staking Inflow was at 364,188. As of January 20, the ETH price fell to $2,936, while Staking Inflow dropped to 103,115, recording a 71.69% decline. The sharp decline in Staking Inflow indicates that new inflows into staking slowed significantly this week and that marginal staking demand weakened. Although Total Value Staked is increasing, this outlook points to a week of reduced momentum on the inflow side, suggesting that the supportive effect from staking has weakened in the short term.
Derivatives
Open Interest
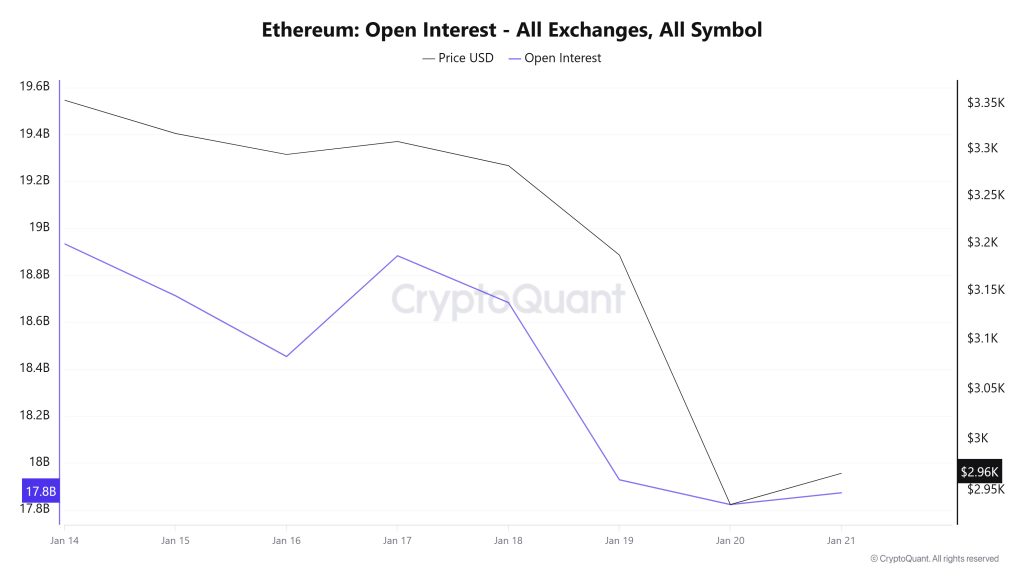 The gradual decline in open interest on the ETH side between January 14 and 18 indicates that position reduction continues in the futures market and that investors are acting more cautiously. At the same time, the price retreating from the $3,350 region indicates that the decline is supported by sales coming from the futures markets.
Between January 19 and 20, a sharp decline in open interest accompanied by a drop in price below $3,000 indicates that leverage unwinding is accelerating in the market. Although there was a limited recovery in both price and open interest as of January 21, the overall level is still below previous days. This picture suggests that selling pressure has weakened in the short term, but the market remains fragile.
Funding Rate
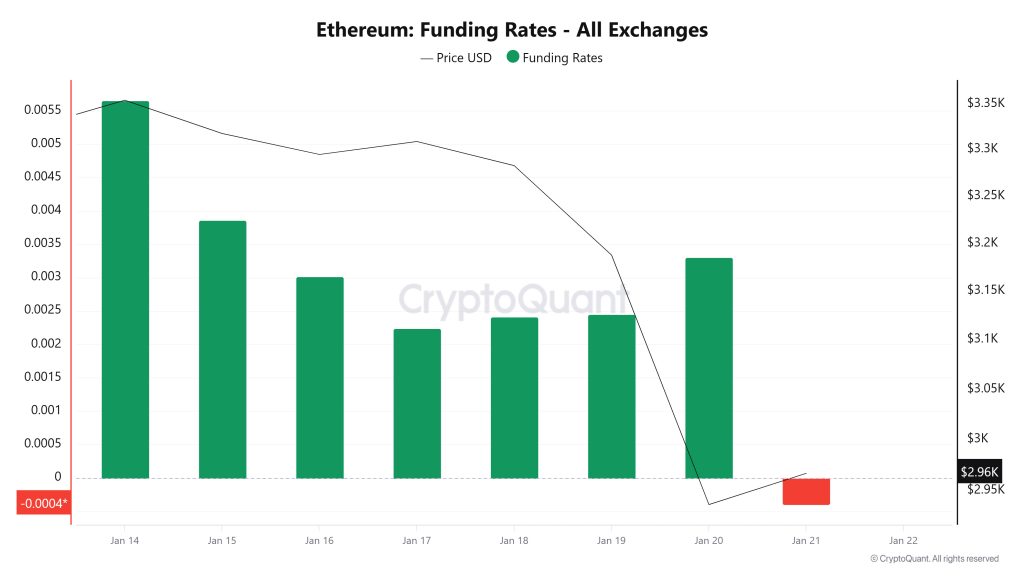
Although the ETH funding rate remained positive between January 14 and 19, it gradually weakened. The price pullback during the same period indicates a decline in long appetite on the futures side. The funding rate turning negative on January 20 signals that long positions are closing and short-oriented trades are coming to the fore. The fact that rates remained low on January 21 indicates that confidence in the futures market for a recovery has not yet fully formed.
Long & Short Liquidations
With the ETH price falling from around $3,360 to $2,910, approximately $495 million in total long positions were liquidated. During the same time frame, nearly $112 million in long positions were also liquidated.
| Date | Long Amount (Million $) | Short Amount (Million $) |
|---|---|---|
| January 14 | 39.06 | 46.68 |
| January 15 | 48.43 | 20.18 |
| January 16 | 15.02 | 6.08 |
| January 17 | 2.19 | 6.00 |
| January 18 | 20.56 | 14.55 |
| January 19 | 97.14 | 7.93 |
| January 20 | 273.34 | 11.20 |
| Total | 495.74 | 112.62 |
Supply Distribution
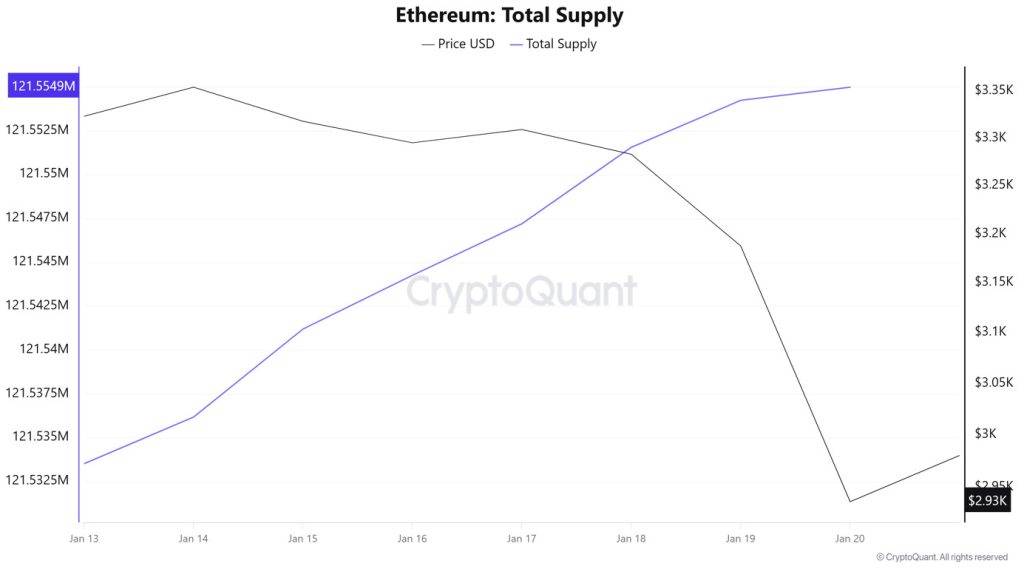 Total Supply: Reached 121,554,983 units, an increase of approximately 0.0195% compared to last week.
New Supply: The amount of ETH produced this week was 23,636.
Velocity: The velocity, which was 9.97 last week, reached 9.98 as of January 20.
| Wallet Category | 12.01.2025 | January 20, 2025 | Change (%) |
|---|---|---|---|
| 100 – 1k ETH | 8.291M | 8.2527M | -0.462 |
| 1k – 10k ETH | 12.3528M | 12.3601M | 0.059 |
| 10k – 100k ETH | 21.4241M | 20.8672M | -2.60% |
| 100k+ ETH | 3.8844M | 3.8919M | 0.193 |
The pullback seen in the 10k–100k ETH range indicates that buying appetite remains weak in this segment and that the risk-averse trend persists. The decline in 100–1k ETH wallets also signals that small and medium-sized investors are reducing their positions. In contrast, the limited increase in wallets holding 1k–10k ETH shows that some investors remain in the market, albeit cautiously. The high rate of decline in large wallets holding 10k–100k+ ETH indicates high selling rates, while the increase in the number of wallets holding 100k and above suggests that large players are maintaining their positions or making gradual purchases, but this does not offset the selling rate in a lower segment.
Exchange Supply Ratio
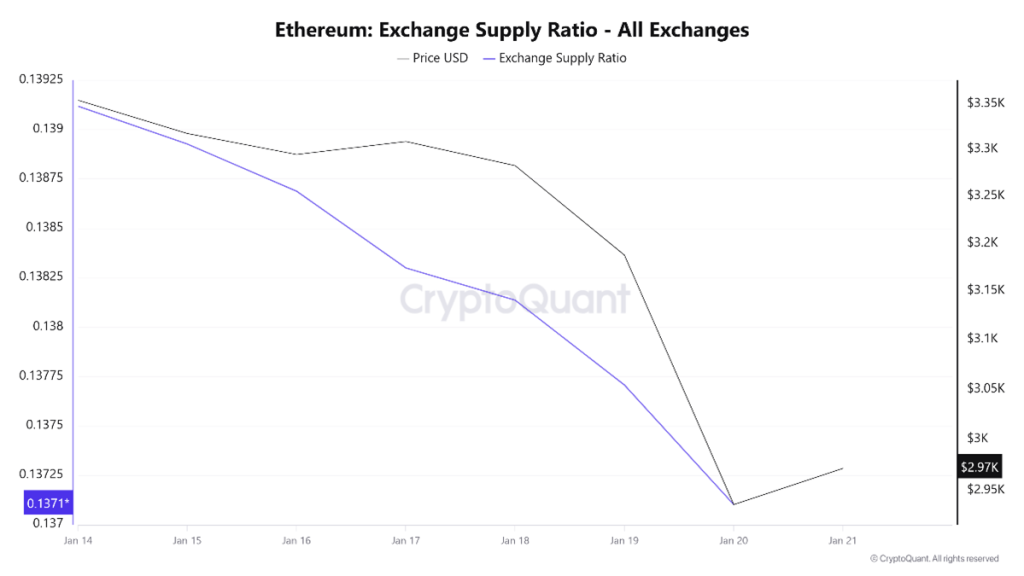 According to Ethereum Exchange Supply Ratio data, a significant decline in the supply ratio of Ethereum held on exchanges was observed during the period under review. This week, there is a positive correlation between the Ethereum price and the supply ratio on exchanges. The decline in the Exchange Supply Ratio indicates that Ethereum is being withdrawn from exchanges and held in cold wallets, suggesting that there is no intense selling pressure in the short term. Between January 14 and January 21, the Ethereum Exchange Supply Ratio declined from 0.139117 to 0.13710153, recording a significant drop. During the same period, the Ethereum price retreated from $3,354 to the $2,936 range.
The fact that both the Ethereum price and the Exchange Supply Ratio moved downwards in the same direction during this period indicates that risk appetite in the market has weakened and that new Ethereum inflows to exchanges have been limited. The Exchange Supply Ratio maintaining its downward trend shows that the price pullback is due to weak demand and cautious investor sentiment rather than panic selling.
Exchange Reserve
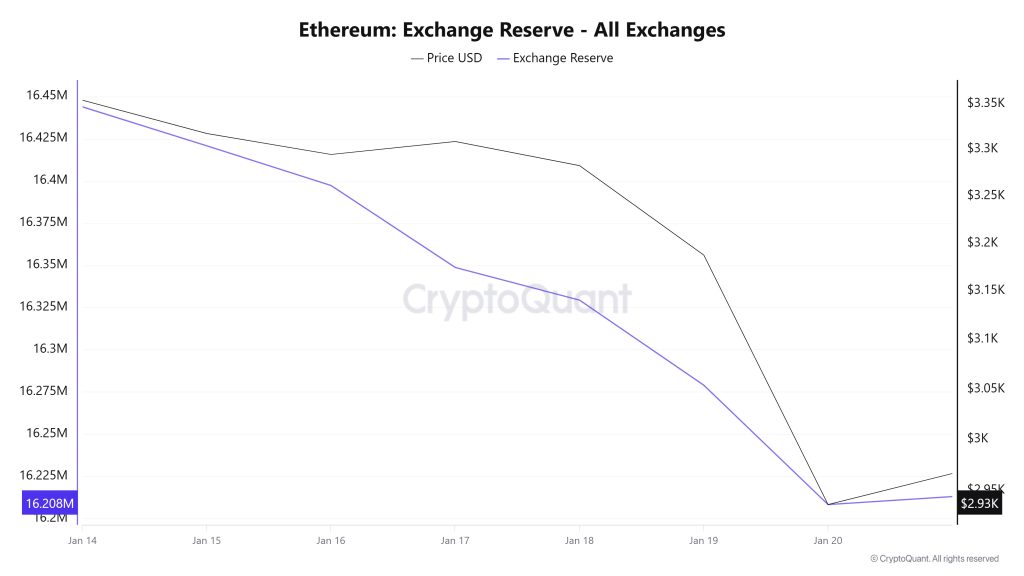 Between January 14-20, 2026, Ethereum reserves on exchanges declined from 16,447,759 ETH to 16,208,300 ETH, recording a net outflow of 239,459 ETH. During this period, exchange reserves decreased by approximately 1.46%, while the ETH price fell from $3,324 to $2,936, experiencing a sharp 11.65% decline in value. The increase in the amount of ETH leaving exchanges during this period of strong price pullback indicated that investors preferred to move their assets off-exchange rather than sell. Weakness and volatility on the price side may continue in the short term. However, a continued decline in exchange reserves could create supportive ground for the Ethereum price in the long term by reducing supply.
| Date | 14-Jan | 15-Jan | 16-Jan | 17-Jan | Jan 18 | Jan 19 | Jan 20 |
|---|---|---|---|---|---|---|---|
| Exchange Inflow | 1,058,727 | 961,406 | 721,652 | 343,886 | 255,045 | 662,440 | 994,042 |
| Exchange Outflow | 1,062,671 | 984,463 | 745,151 | 392,435 | 274,385 | 712,802 | 1,064,748 |
| Exchange Netflow | -3,944 | -23,057 | -23,500 | -48,549 | -19,341 | -50,362 | -70,706 |
| Exchange Reserve | 16,443,814 | 16,420,757 | 16,397,258 | 16,348,709 | 16,329,368 | 16,279,006 | 16,208,300 |
| ETH Price | 3,324 | 3,318 | 3,295 | 3,309 | 3,283 | 3,188 | 2,936 |
Fees and Revenues
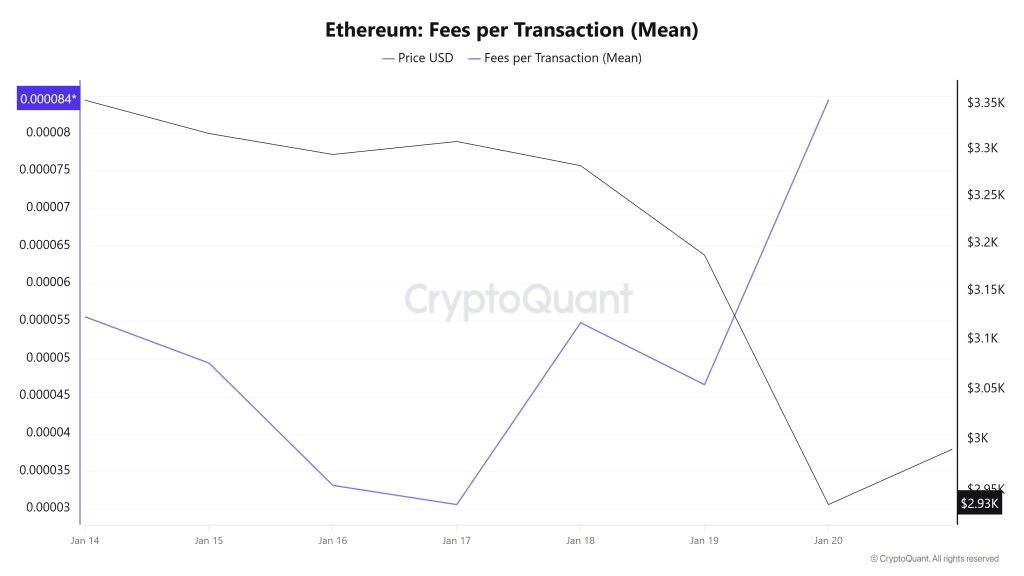
When examining the Ethereum Fees per Transaction (Mean) data for the period between January 14 and 20, it is observed that the indicator reached 0.00005555871968487 on January 14, the first day of the week.
A decline was observed until January 17, when the indicator recorded its lowest value of the week at 0.000054775268457612.
In this context, as a result of the increase in Ethereum price volatility as of January 17, the indicator regained momentum and followed a positive trend due to the impact of price volatility.
On January 20, the last day of the weekly period, the indicator closed the week at 0.000084409851091314.
Ethereum: Fees (Total)
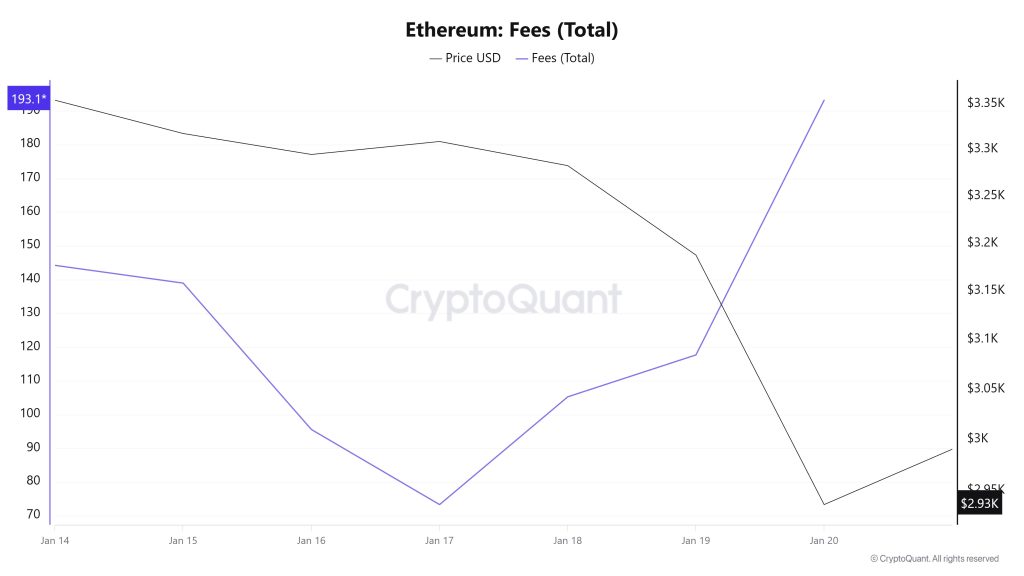 Similarly, when examining the Ethereum Fees (Total) data between January 14 and 20, it can be seen that on January 14, the first day of the week, the indicator stood at 144.18465591690202. A decline was observed until January 17, and on that date, the indicator recorded the week’s lowest value at 73.26819599838711.
In this context, as a result of the increase in Ethereum price volatility as of January 17, the indicator regained momentum and followed a positive trend due to the impact of price volatility.
On January 20, the last day of the weekly period, the indicator closed the week at 193.13784264263094.
Blocks Mined
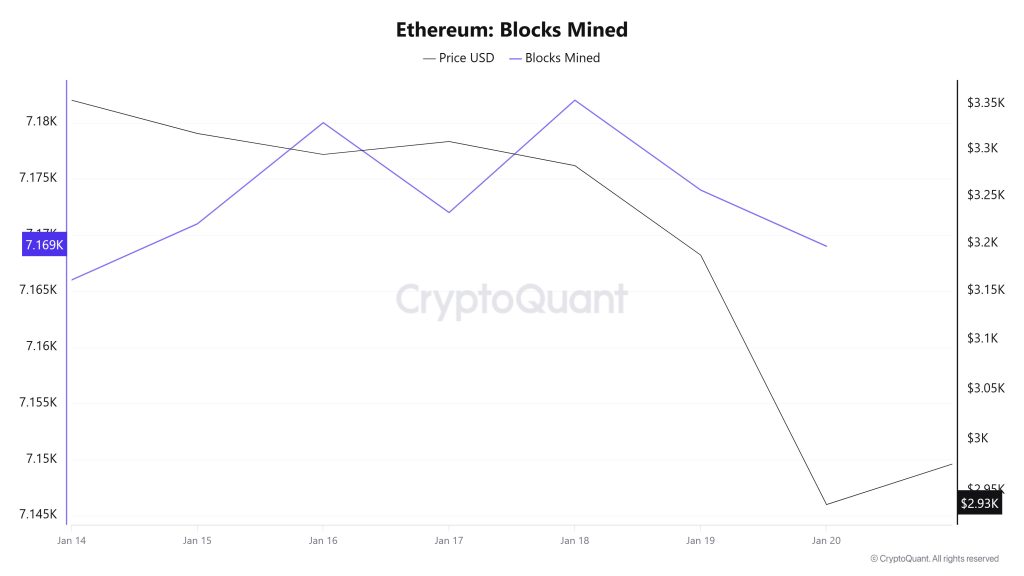 When examining Ethereum block production data between January 14 and 20, an increase was observed throughout the week. While 7,166 blocks were produced on January 14, this number rose to 7,169 by January 20. During the period in question, a time-dependent correlation structure was observed between the Ethereum price and the number of blocks produced. However, the general trend reveals that a negative correlation between these two variables is dominant.
Block Size
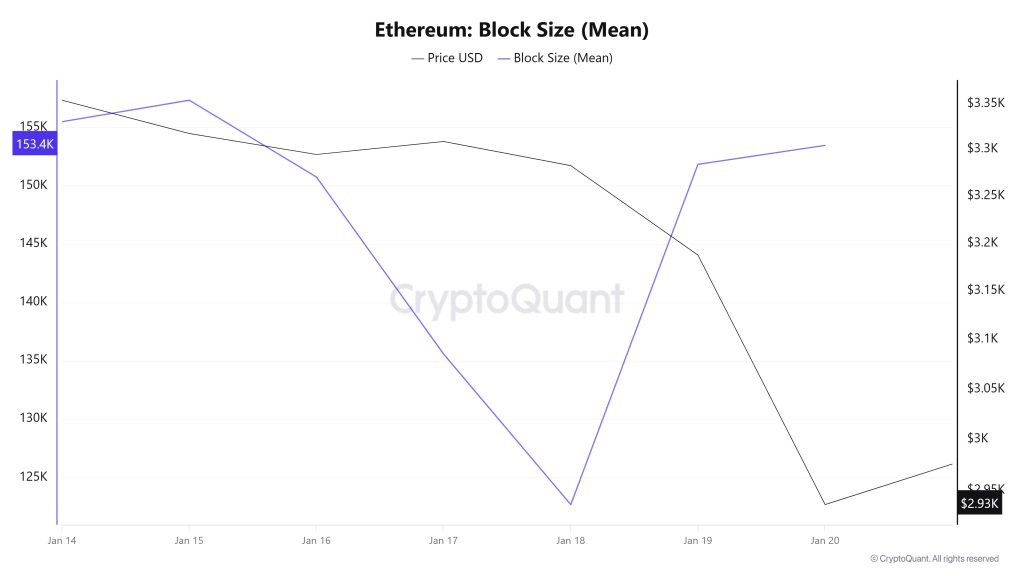 When examining Ethereum block size data between January 14 and 20, a decrease was observed throughout the week. While the average block size was measured at 155,496 bytes on January 14, this value declined to 153,466 bytes as of January 20. During the relevant period, a time-dependent correlation structure was observed between block size and Ethereum price. However, the general trend indicates that a negative correlation between these two variables is dominant.
Block Interval
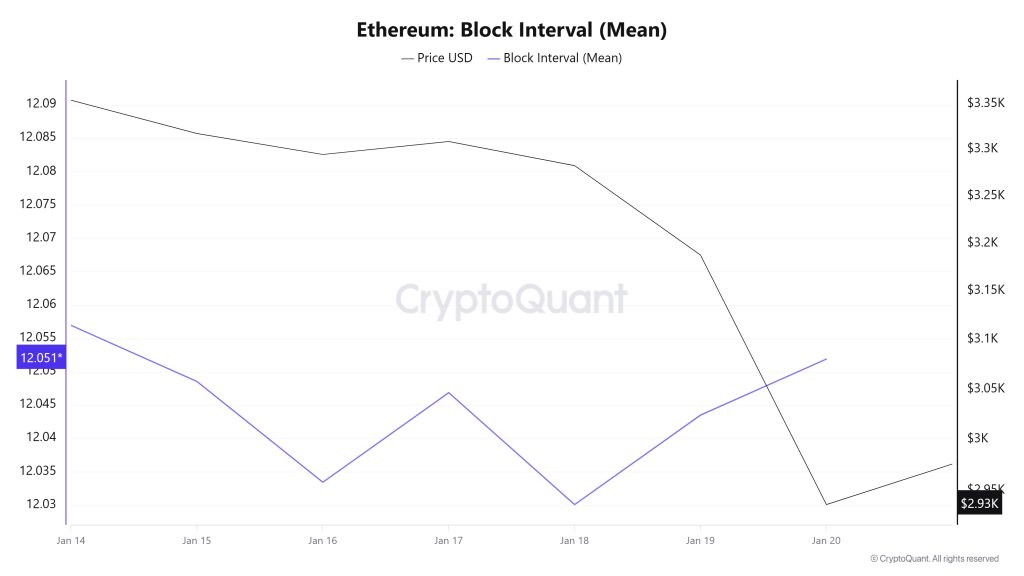 When examining the Ethereum block time between January 14 and 20, a slight decrease was observed throughout the week. While the average block time was recorded as 12,056 seconds on January 14, this time decreased to 12,051 seconds as of January 20. During this period, a time-dependent correlation structure was observed between the Ethereum block time and price movement. However, the general trend indicates that a positive correlation between these two variables is dominant.
Transaction
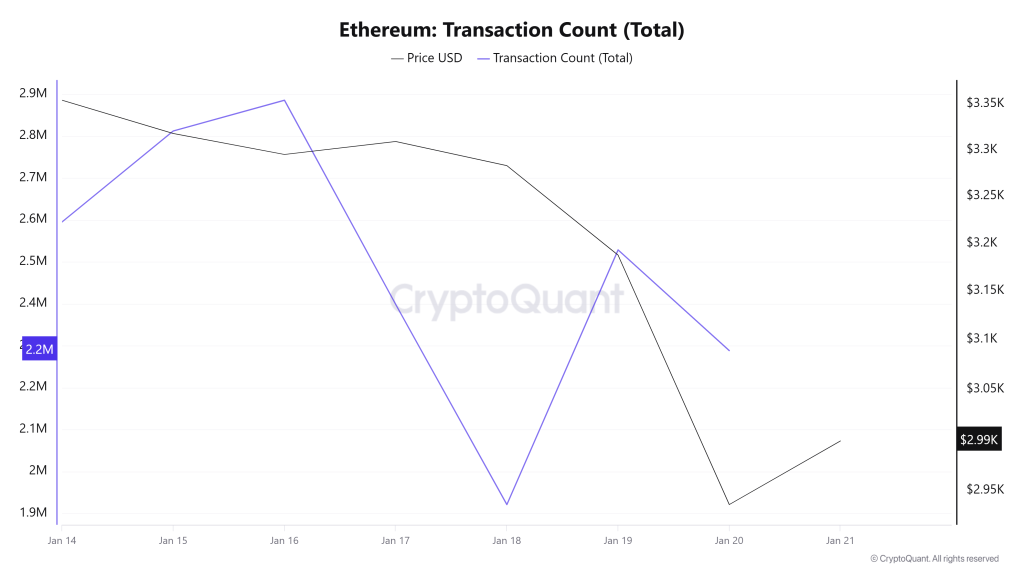 Last week, 14,373,332 transactions were executed on the Ethereum network, while this week the number of transactions increased by approximately 21.3% to 17,428,632. The highest transaction volume for the period was recorded on January 16 at 2,885,542, while the lowest transaction volume was recorded on January 18 at 1,920,802. When examining the correlation between the number of transactions and price, a negative trend prevailed throughout the period. On the other hand, the acceleration in network activity compared to the previous period indicates that the momentum in transaction volumes on Ethereum is recovering, and this increase in network activity may indirectly reflect on Ethereum prices.
Tokens Transferred
The total amount of ETH transferred last week was 10,500,473 ETH, while this week the value rose to 10,796,184 ETH, recording an increase of approximately 2.8%. The highest transfer volume during the period was 2,273,775 ETH on January 14, while the lowest value was 602,857 ETH on January 18.
Considering the fluctuation of up to 350% in daily transfers, the increase in the number of transactions, and the decline in the average amount of Ethereum per transaction, it can be seen that a positive structure has been formed on the network that could stabilize the price fluctuation range. This outlook indicates that more small-scale investors are active compared to the previous period, providing a positive foundation for network health and a solid basis for pricing. However, until high-volume transfers regain strength, the likelihood of the price initiating a strong upward trend with sharp and rapid increases currently appears low. In summary, the chain is alive and has a high number of active users, but the amount of capital moving on the network is still weak compared to this user count. In other words, there is a crowd, but the money has not yet fully entered the field.
10. Estimated Leverage Ratio
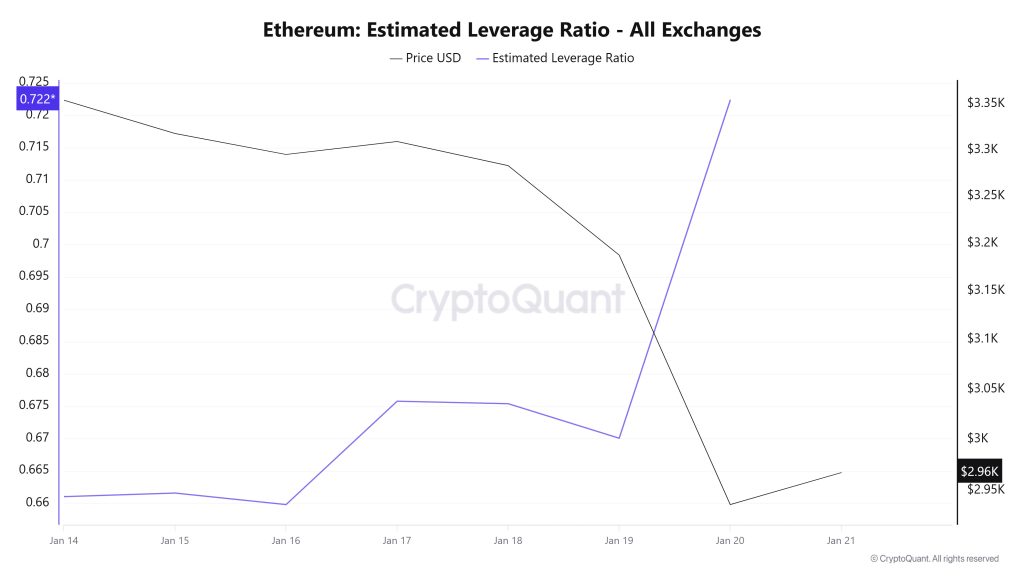
The metric remained flat until the middle of the 7-day period. Starting at 0.660 on January 14, the first day of the period, the metric remained flat until January 16, where it reached its lowest point at 0.659. The metric then began to rise for the remainder of the process, reaching a value of 0.722 at the time of writing, forming the highest point of the process. A higher ELR means that participants are willing to take on more risk and usually indicates bullish conditions or expectations. The increases may also be due to a decrease in reserves. Looking at Ethereum reserves, there were 16.44 million reserves at the beginning of the process, but this figure declined during the rest of the process and has now fallen to 16.21 million. At the same time, Ethereum’s Open Interest was seen at $41.67 billion at the beginning of the process. As of now, volume has lost significant value during the process, and open interest has retreated to $38.92 billion. With all this data, the ELR metric followed an upward trend for most of the process. The asset’s price fluctuated between $3,370 and $2,920 with all this data. Ultimately, the decline in open interest volume and the decrease in reserves observed throughout the process indicate that the rise in the ELR metric was artificial. This suggests that investor risk appetite has not fully increased and that pessimism persists.
ETH Onchain Overall
| Metric | Positive 📈 | Negative 📉 | Neutral ➖ |
|---|---|---|---|
| Active Addresses | ✓ | ||
| Total Value Staked | ✓ | ||
| Derivatives | ✓ | ||
| Supply Distribution | ✓ | ||
| Exchange Supply Ratio | ✓ | ||
| Exchange Reserve | ✓ | ||
| Fees and Revenues | ✓ | ||
| Blocks Mined | ✓ | ||
| Transaction | ✓ | ||
| Estimated Leverage Ratio | ✓ |
*The metrics and guidance provided in the table do not alone explain or imply any expectation regarding future price changes in any asset. Digital asset prices can fluctuate based on numerous variables. The on-chain analysis and related guidance are intended to assist investors in their decision-making process, and basing financial investments solely on the results of this analysis may lead to unfavorable outcomes. Even if all metrics produce positive, negative, or neutral results simultaneously, the expected outcomes may not materialize depending on market conditions. It would be beneficial for investors reviewing the report to take these warnings into consideration.
Legal Notice
The investment information, comments, and recommendations contained in this document do not constitute investment advisory services. Investment advisory services are provided by authorized institutions on a personal basis, taking into account the risk and return preferences of individuals. The comments and recommendations contained in this document are of a general nature. These recommendations may not be suitable for your financial situation and risk and return preferences. Therefore, making an investment decision based solely on the information contained in this document may not result in outcomes that align with your expectations.
NOTE: All data used in Ethereum on-chain analysis is based on CryptoQuant.
