
BTC/USDT
Trump highlighted the strong performance of the US economy in his speech at the World Economic Forum in Davos, emphasizing the impact of energy, trade, and tariffs on growth and prices. Drawing attention to Greenland’s strategic importance and sending cautious messages to NATO, Trump reiterated his call for peace in the Russia-Ukraine war. He stated that the US will continue to be the crypto capital of the world. Trump said he would make an announcement soon regarding the Fed chairmanship and reiterated his dissatisfaction with the current Fed chair.
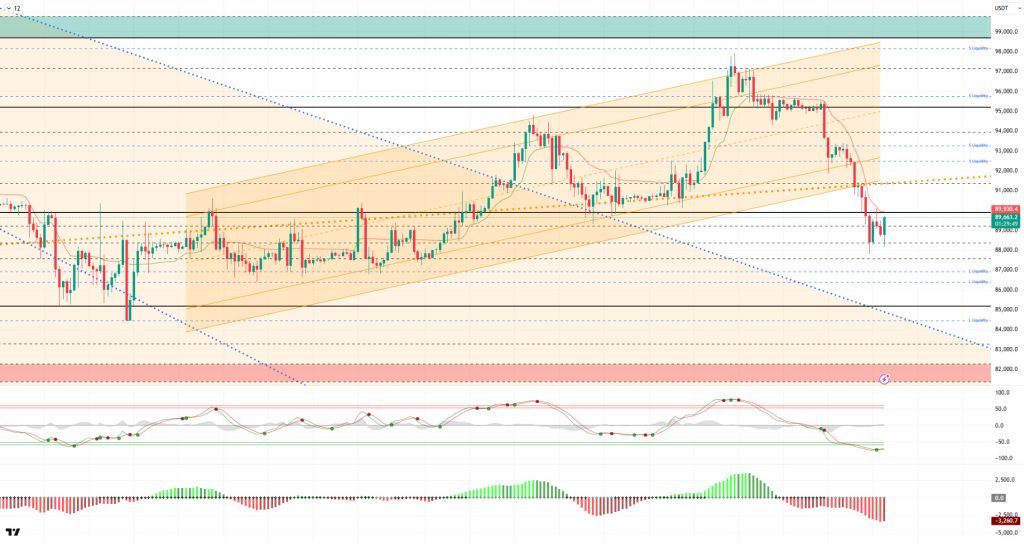
From a technical perspective, BTC lost its rising trend channel and fell below the major uptrend line. In the previous analysis, the price attempted to hold at the 91,000 level but gave way to selling pressure in the following hours. BTC fell to the 87,800 level after recording the 90,000 reference point and then the 89,000 support level. At the time of writing, the price has recovered somewhat and continues to trade above the 89,000 level. We will now monitor whether the price regains the 90,000 area.
Technical indicators show that the Wave Trend (WT) oscillator fell below the oversold zone, producing a buy signal along with an extra decline in the price. The histogram on the Squeeze Momentum (SM) indicator has reached maximum weakness within the negative zone again. The Kaufman moving average (KAMA) is currently trading above the price at $89,924.
Looking at liquidation data, with the recent decline, buy orders became the target and were liquidated within the 88,000–90,000 range. While intensity continues to increase in sell orders, dense clusters of transactions above the 93,500 level in the short term and 95,000 level in the long term have turned this area into a liquidity zone.
In summary, while President Trump’s foreign policy messages centered on Greenland and Iran continue, trade tensions between the US and the EU have increased. Domestically, while the Supreme Court postponed its decision on customs duties, Powell’s public support in the Lisa Cook case is eagerly awaited. On the other hand, crypto legislation efforts and the US BTC treasury strategy are other elements to follow. Looking at liquidity data, the weight of the selling tier has increased. Technically, BTC started the new year with positive momentum, first reaching the 95,000 level and then continuing its parallel movement to the upward channel, rising to the 98,000 level. Facing short-term profit-taking at these levels, the price reverted to the 95,000 reference area. After consolidating here for a while, BTC encountered strong selling pressure, broke below the trend line, and retreated to the 87,800 level. Encountering rebound buying here, the price once again headed towards the 90,000 level. After this stage, with the reclaiming of the 90,000 level, closes above the major uptrend line will be followed. In the event of a possible new selling pressure, the 89,000 level will again be monitored as critical support.
Supports: 89,000 – 88,000 – 87,500
Resistances: 90,000 – 91,400 – 92,600
ETH/USDT
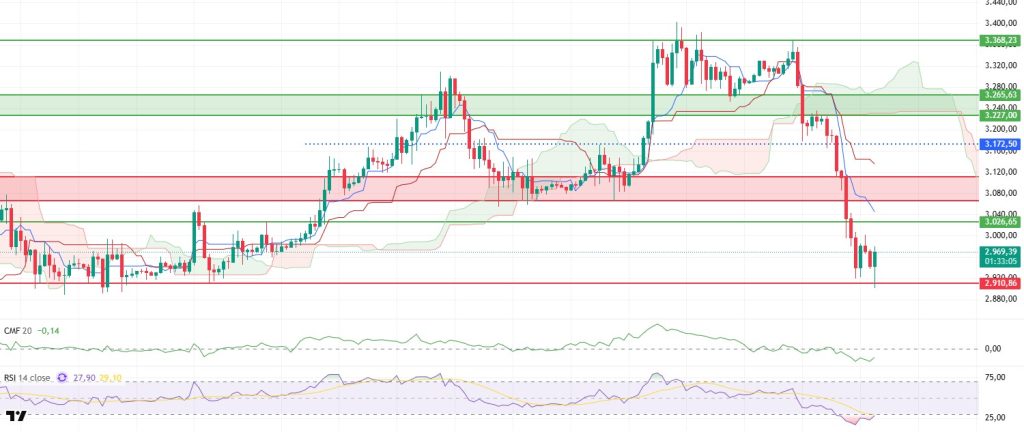
The ETH price retreated to the $2,900 level during the day as selling pressure continued. Buying from this area prevented the price from falling further, and ETH rebounded towards the $2,990 level. Although there was a reaction, the limited rise shows that buyers are still unable to demonstrate clear strength and that the cautious stance in the market continues.
The liquidity outlook remains weak. The Chaikin Money Flow (CMF) is trading in negative territory, indicating that money is still predominantly flowing out of the market. Unless liquidity inflows strengthen, upward attempts are likely to fizzle out easily, and the price is likely to face selling pressure again.
There is no significant improvement on the momentum front either. The Relative Strength Index (RSI) continues to remain in the oversold zone. While these levels increase the possibility of a rebound, the RSI’s failure to recover indicates that downward pressure remains strong. Unless momentum gains strength, it seems difficult for the upward movement to become sustainable.
The technical outlook also remains negative from the Ichimoku indicator perspective. While the price continues to trade below the kumo cloud, the Tenkan and Kijun levels have not yet been regained. This picture reveals that the main direction in the short term is down and that recovery attempts are facing technical resistance.
In the overall assessment, the $2,910 region retains its critical importance. If the price remains below this level, selling pressure could regain momentum. On the upside, regaining the $3,111 level could improve the outlook and strengthen the bullish scenario again. The current picture shows a weak technical structure, and it appears that the price needs stronger buyer confirmation for an upward reversal.
Supports: 2,910 – 2,727 – 2,625 Resistances: 3,026 – 3,111 – 3,227
XRP/USDT
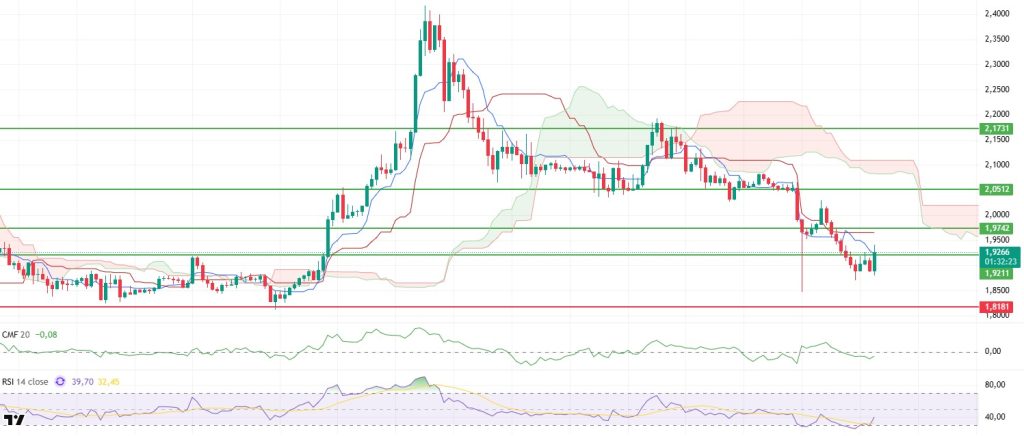
The XRP price rebounded from the $1.88 level and managed to regain the $1.92 level.
The liquidity picture remains weak. Chaikin Money Flow (CMF) remains in negative territory, indicating limited money entering the market. Unless this structure changes, upward attempts are likely to remain volume-less, and every rise is likely to encounter selling pressure.
On the momentum front, a limited recovery desire is maintained. Although the Relative Strength Index (RSI) has moved out of the oversold zone, the gain in strength is not clear. While the RSI’s slight upward trend suggests that selling has slowed, the momentum is still low, which does not yet provide sufficient confidence for the rally to continue.
From a technical perspective, pressure persists according to the Ichimoku indicator. While the price remains below the Kumo cloud, the Tenkan and Kijun levels have not yet been regained. Therefore, even if there are rebound rallies, it would not be surprising to see selling pressure re-emerge at resistance levels.
In the overall assessment, the $1.92 level remains the key threshold. If the price breaks above this level and sustains itself, a recovery area towards the $2.05 level could open up. However, as long as $1.92 is not breached, the price is expected to maintain its weak horizontal outlook, and downside risks are likely to persist.
Supports: 1.8181 – 1.7705 – 1.6224 Resistances: 1.9211 – 1.9742 – 2.0512
SOL/USDT
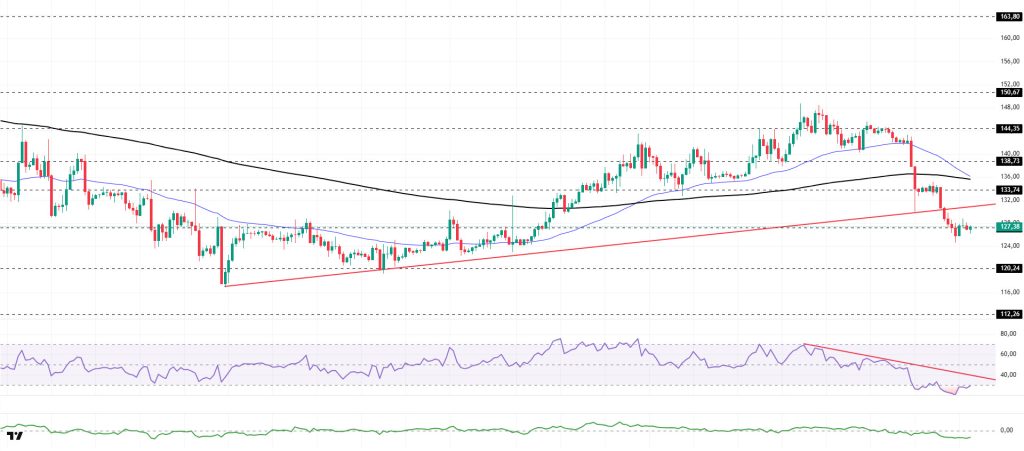
The SOL price traded sideways during the day. The asset remained in the lower region of the rising line that began on December 18. The price moved to the lower region of the strong support level of $127.21 but failed to establish permanence there, rebounded, and regained the upper region of this level. Currently maintaining its value at this level, the asset is preparing to test the upward trend as resistance. If it begins to pull back, the $120.24 level could act as support.
On the 4-hour chart, the 50 EMA (Exponential Moving Average – Blue Line) remained above the 200 EMA (Black Line). This indicated that an uptrend could begin in the medium term. At the same time, the price being below both moving averages signaled that the asset was trending downward in the short term. The Chaikin Money Flow (CMF-20) remains in negative territory. However, the balance of money inflows and outflows may keep the CMF in negative territory. The Relative Strength Index (RSI-14) continues to remain below the downward trend that began on January 14, indicating that selling pressure continues. Currently in the oversold zone, the metric may show a slight increase if profit-taking occurs. If an uptrend occurs due to macroeconomic data or positive news related to the Solana ecosystem, the $150.67 level stands out as a strong resistance point. If this level is broken upwards, the uptrend is expected to continue. In the event of pullbacks due to developments in the opposite direction or profit-taking, it may test the $120.24 level. A decline to these support levels could increase buying momentum, presenting a potential upside opportunity.
Supports: 127.21 – 120.24 – 112.26 Resistances: 133.74 – 138.73 – 144.35
DOGE/USDT
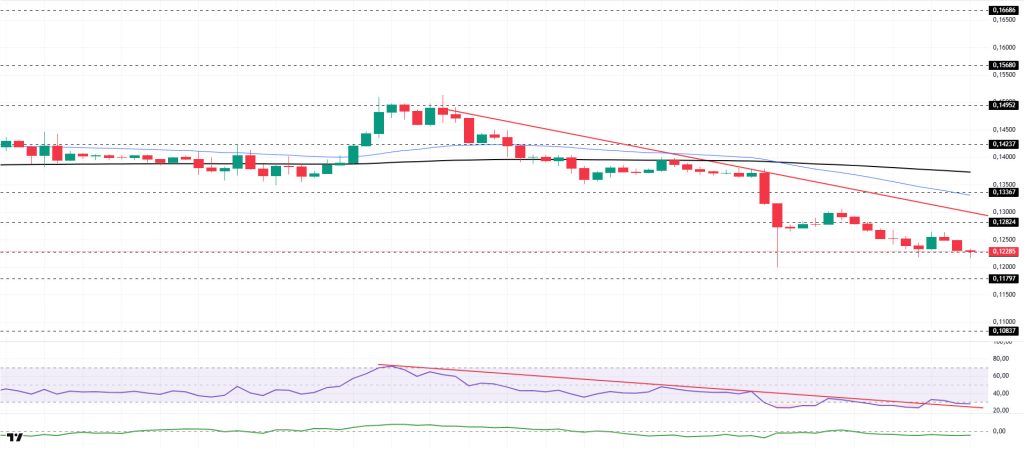
The DOGE price traded sideways. The asset remained in the lower region of the downtrend that began on January 14. Currently testing the strong support level of $0.12282, the price could test the 50 EMA (Blue Line) moving average as resistance if it experiences an uptrend. If it closes below the $0.12282 level, it could retest the $0.11797 level.
On the 4-hour chart, the 50 EMA (Exponential Moving Average – Blue Line) remained below the 200 EMA (Black Line). This indicated a downtrend forming in the medium term. The price being below both moving averages suggests that the price may be trending downward in the short term. The Chaikin Money Flow (CMF-20) remained in negative territory. Additionally, an increase in money outflows could push the CMF deeper into negative territory. The Relative Strength Index (RSI-14) retreated to oversold territory. On the other hand, it crossed above the upper region of the downward trend that began on January 14, signaling a decrease in selling pressure. In the event of a rise driven by political developments, macroeconomic data, or positive news flow in the DOGE ecosystem, the $0.14952 level stands out as a strong resistance zone. Conversely, in the event of negative news flow, the $0.10837 level could be triggered. A decline to these levels could increase momentum and initiate a new wave of growth.
Supports: $0.12282 – $0.11797 – $0.10837 Resistances: 0.12824 – 0.13367 – 0.14237
SHIB/USDT
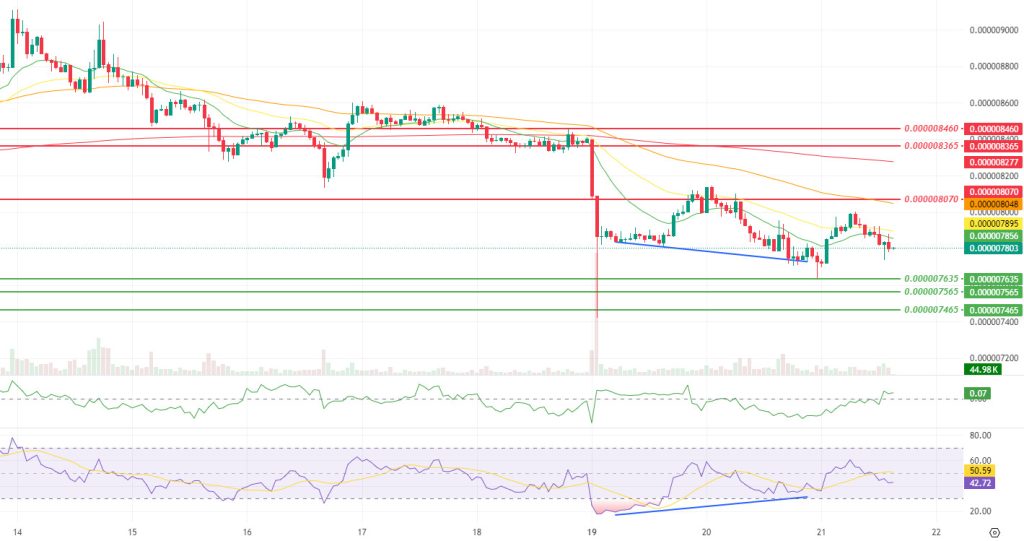
The recent picture on the Shiba Inu burn front shows a fluctuating rhythm with one-off spikes followed by periods of slower activity. Shibburn data shows that the amount removed from circulation has dropped to 3.24 SHIB this time, with transactions limited to only two transfers. This composition indicates that burn activity is still shaped by transactions concentrated at specific moments rather than gaining broad-based continuity. Compared to the previous day, when 28.66 million SHIB was burned in a single large transfer, the approximately 88.7% decline in the burn rate suggests that the deflation narrative is currently more episodic. Therefore, the key point to monitor in the short term is whether burning will accelerate again with large single transactions or whether it will settle into a more sustainable base with smaller but more frequent transfers, i.e., whether the rhythm will gain momentum on the sustainability side.
The technical chart shows that the reaction following the positive divergence (Blue Line) between the Relative Strength Index (RSI) and the price has lost momentum. Declines in momentum, volume, and volatility indicate that the upward attempt is not supported by broad participation and that the movement has entered a tighter equilibrium search in the short term. Meanwhile, the Chaikin Money Flow (CMF) indicator moving into positive territory stands out as an important change, suggesting that selling pressure has weakened on the flow side and that buyer liquidity has re-entered at the bottom. However, the fact that it continues to remain below the Smoothed Moving Average (SMMA) averages confirms that the recovery has not yet produced a trend confirmation and that short-term pressure persists.
In this scenario, the $0.000008070 level remains the key threshold. If the price recovers this area and then settles above the SMMA 9, 21, and 50 bands to establish sustainability, a more structured recovery attempt towards the $0.000008365 and $0.000008460 resistance levels could come into play. For this scenario to gain traction, it will be critical for the CMF to remain in positive territory and for the recovery on the RSI side to continue. Conversely, if weak closes persist below the $0.000008070 level, the $0.000007635 level could come under pressure again. If this area is lost, the support cluster of the $0.000007565 and $0.000007465 levels will again be monitored as the main equilibrium zone. (SMMA9: Green Line, SMMA21: Yellow Line, SMMA50: Orange Line, SMMA 200: Red Line)
Supports: 0.000007635 – 0.000007565 – 0.000007465 Resistances: 0.000008070 – 0.000008365 – 0.000008460
LEGAL NOTICE
The investment information, comments, and recommendations contained herein do not constitute investment advice. Investment advisory services are provided individually by authorized institutions taking into account the risk and return preferences of individuals. The comments and recommendations contained herein are of a general nature. These recommendations may not be suitable for your financial situation and risk and return preferences. Therefore, making an investment decision based solely on the information contained herein may not produce results in line with your expectations.

