
Active Addresses
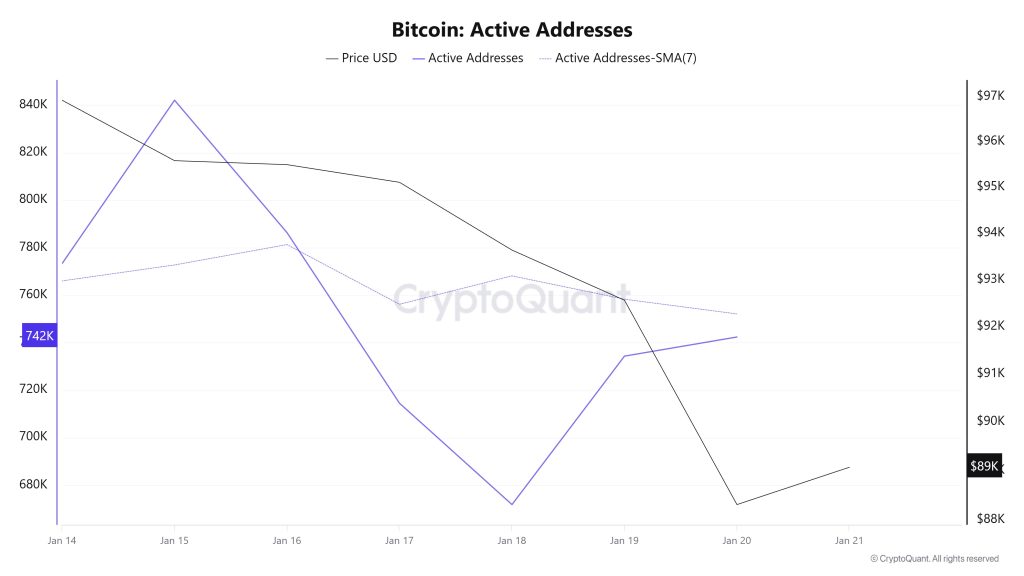
Between January 14 and January 21, recorded 842,083 active addresses on the Bitcoin network. During this period, Bitcoin’s price fell from $95,000 at the beginning of the week to $88,000 on January 21. From a technical perspective, the 7-day simple moving average (SMA) shows a downward trend.
Active Sending Addresses
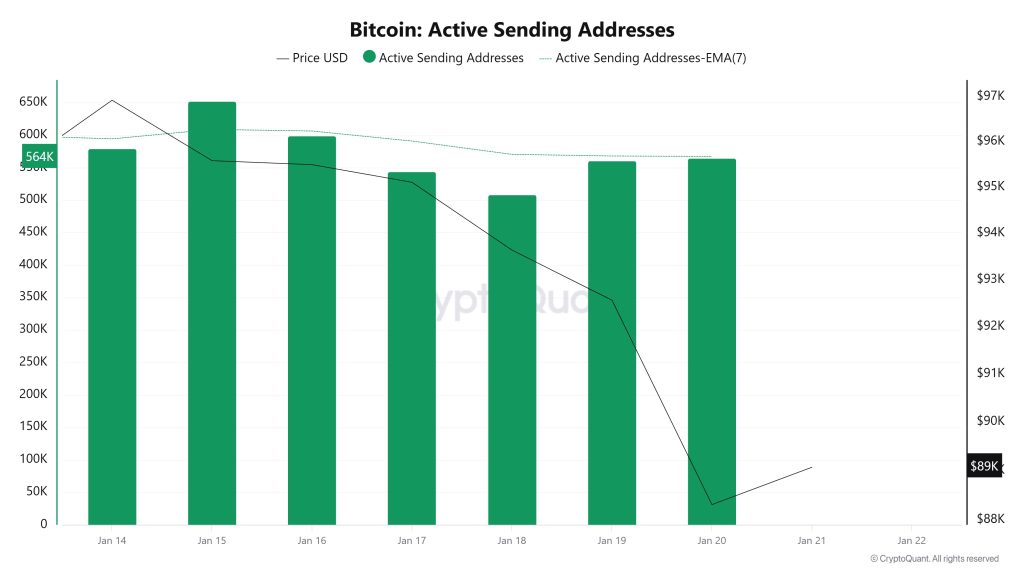
Between January 14 and January 21, an upward trend was observed in the active sending addresses metric. On the day the price reached its highest level, this metric stood at 652,240, indicating that user activity on the Bitcoin network was moving in parallel with the price. This data shows that the $95,000 level is supported not only by price but also by on-chain address activity. Overall, the Active Sending Addresses metric has followed a high trajectory during this period.
Active Receiving Addresses
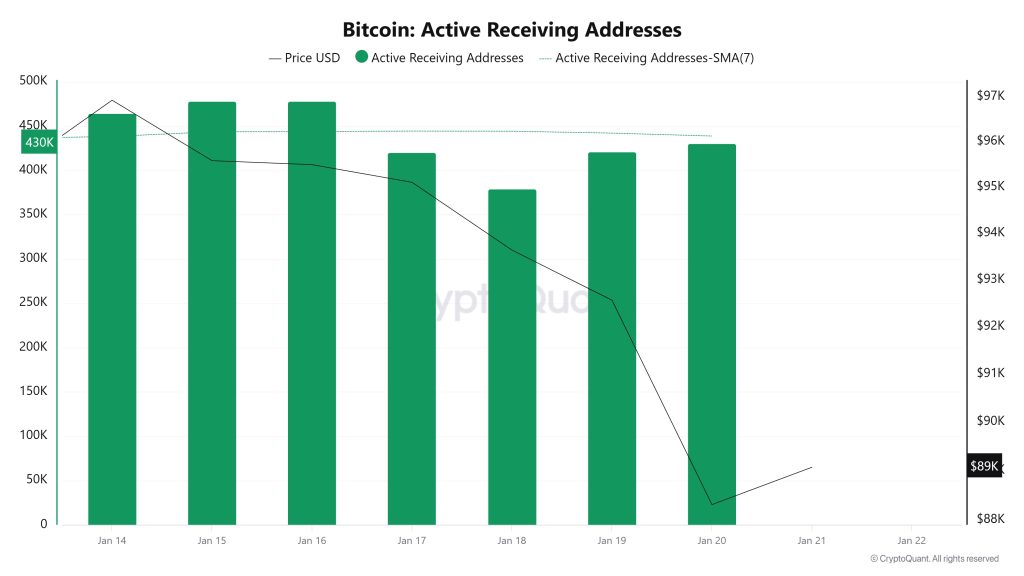
Between January 14 and January 21, active receiving addresses experienced a typical rise alongside the Black Line (price line). On the day the price reached its peak, active receiving addresses rose to 477,977 levels, indicating that buyers acquired Bitcoin at around the $90,000 level.
Breakdowns
MVRV
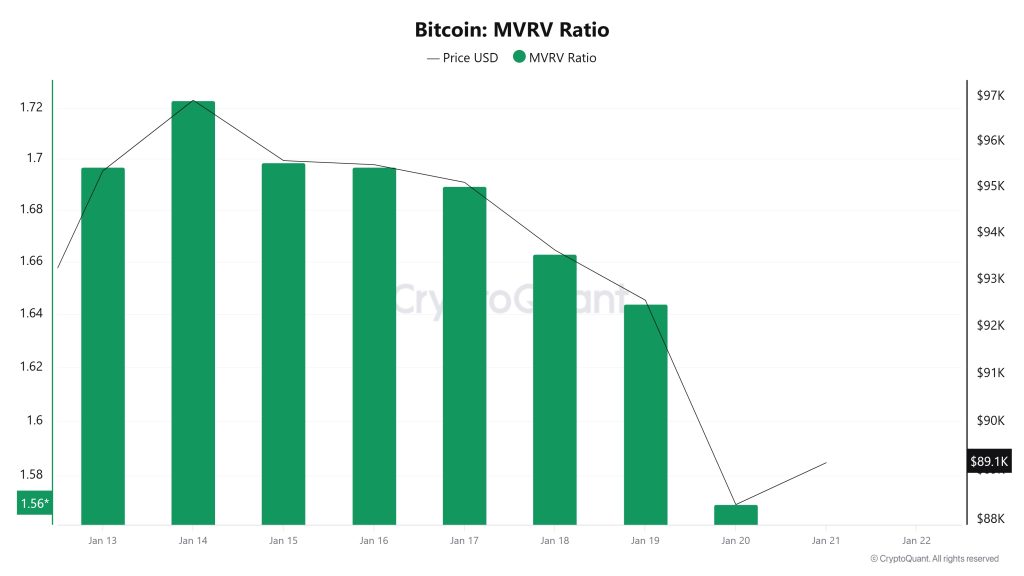 On January 14, while the Bitcoin price was trading at $96,921, the MVRV Ratio was at 1.723. As of January 20, the Bitcoin price fell to $88,312, recording an 8.88% decline, while the MVRV Ratio fell to 1.569, recording an 8.94% decline. The pullback in the MVRV Ratio indicates that the premium relative to the realized cost basis has narrowed and unrealized profits in the market are squeezed. While this outlook signals weakened risk appetite in the short term, as long as price pressure persists, upward attempts are likely to be met with more caution, and a recovery may require further confirmation.
Realized Price
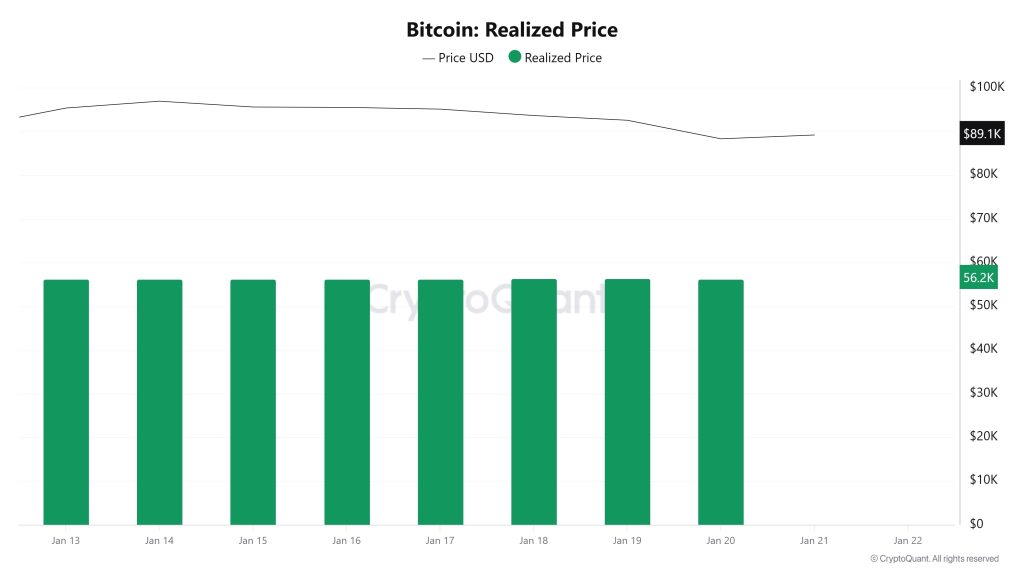
On January 14, Bitcoin traded at $96,921, while the Realized Price stood at $56,245. By January 20, Bitcoin had fallen to $88,312, recording an 8.88% decline, while the Realized Price rose to $56,267, recording a limited increase of 0.04%. The flat trajectory of the Realized Price indicates that the network’s average cost basis did not change significantly this week. This outlook confirms that the price premium relative to the cost basis has narrowed, while the preservation of the cost basis despite the decline suggests that the pullback was driven more by spot pricing than by a network-wide cost distortion.
Spent Output Profit Ratio (SOPR)
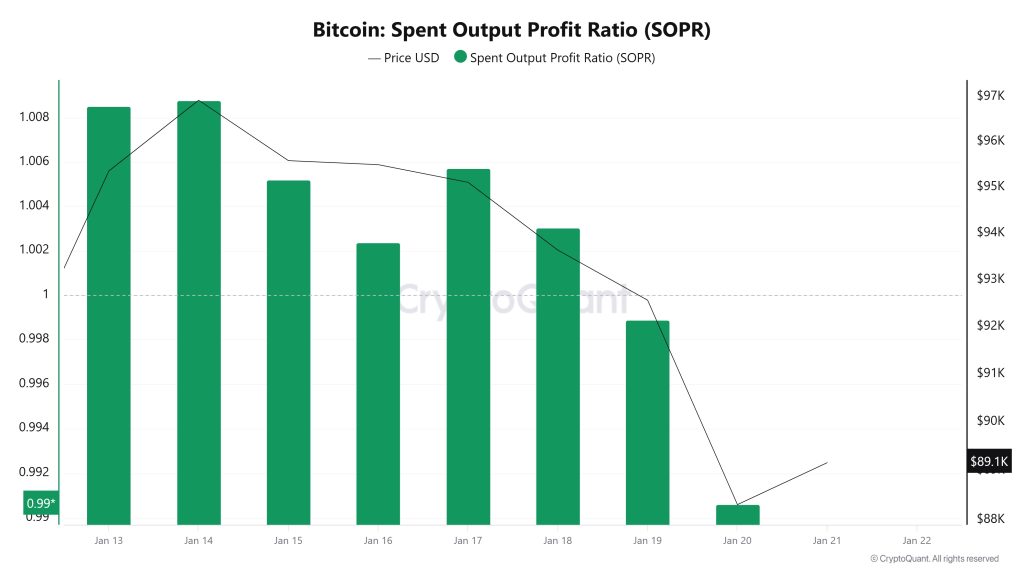
On January 14, while the Bitcoin price traded at $96,921, the SOPR metric was at 1.008. As of January 20, the Bitcoin price fell to $88,312, recording an 8.88% decline, while the SOPR metric fell to 0.990, recording a 1.79% decline. The SOPR falling below the 1 level indicates that spent coins changed hands at a loss on average and that sales were dominated by loss-making transactions rather than profitable exits. This situation may indicate that selling pressure has strengthened in the short term and that recovery attempts may proceed on more fragile ground.
Derivatives
Open Interest
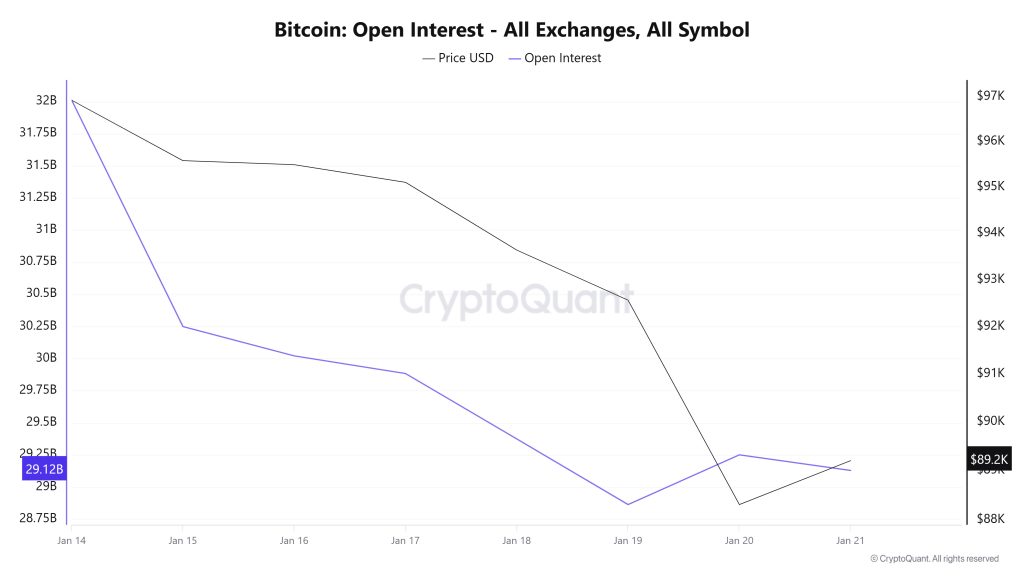
The BTC price experienced a sharp decline from January 14, when it was at $97,000, to January 19, losing the $90,000 level. However, the decline in open interest indicates that a large number of long positions have been closed. The decline accelerated after January 19, and the BTC price retreated to the $88,000 level. However, the slight recovery and rise in open interest indicates that long positions are beginning to open in this region and that a support point has formed at this level. In summary, the chart shows that leverage cleaning occurred during the decline, but volatility risk has increased again in the latest segment with new position entries.
Funding Rate
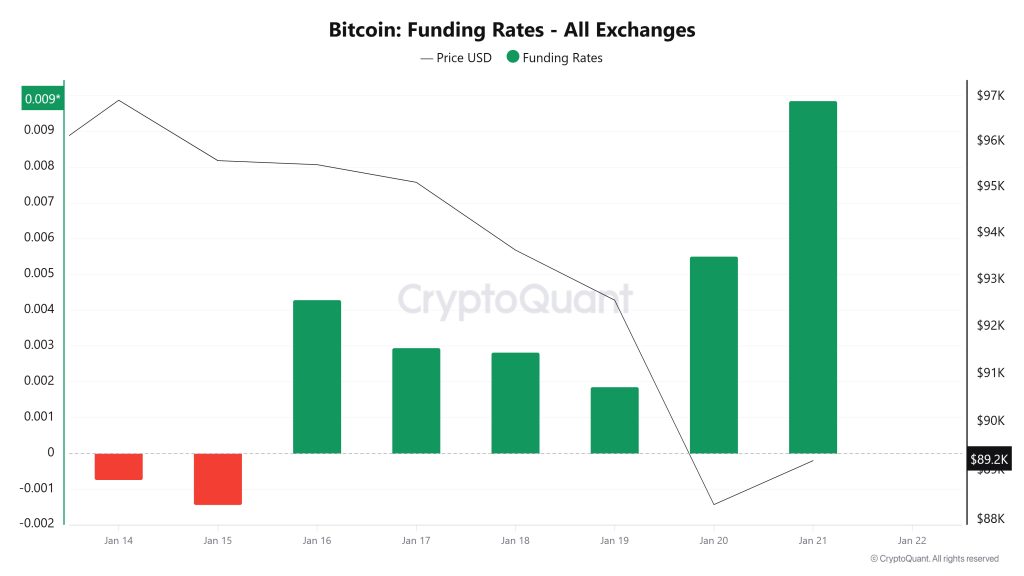
The BTC funding rate turned briefly negative on January 14–15, indicating market caution. The price pullback from the $97,000 region during the same period signals weakening long appetite. After January 16, the funding rate turned positive again. The rapid rise in the funding rate during the January 19–21 period, despite the price decline, indicates an increase in aggressive long positions on the futures side. This structure suggests that volatility and liquidation risk have increased in the short term, despite rebound buying.
Long & Short Liquidations
Last week, the BTC price fell from around $97,000 to $88,000. As a result, a total of $1.31 billion in long positions were liquidated, while $186 million in short positions were liquidated.
|
Supply Distribution
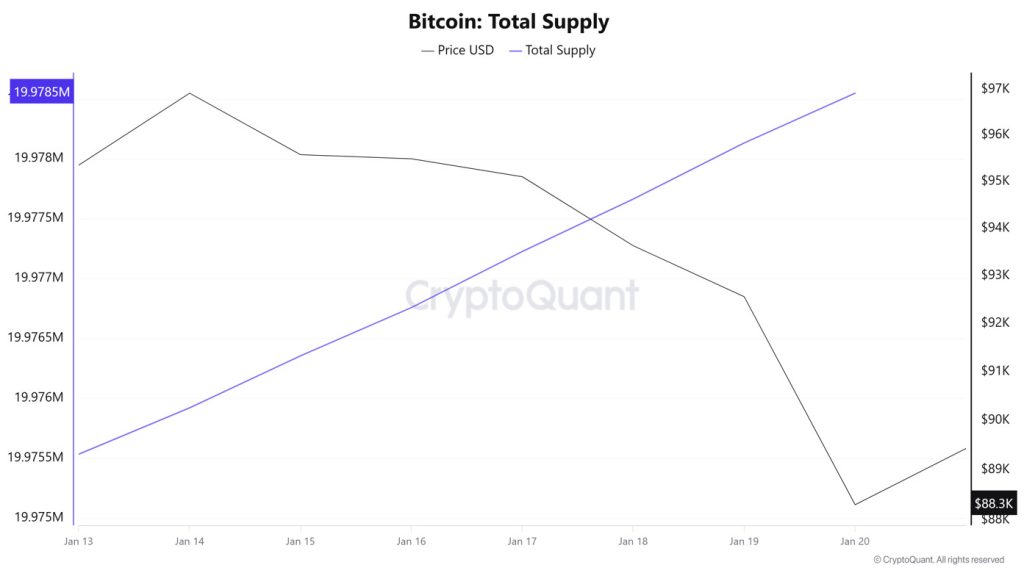
Total Supply: Reached 19,979,549 units, an increase of approximately 0.0355% compared to last week.
New Supply: The amount of BTC produced this week was 7,085.
Velocity: The velocity, which was 12.35 last week, reached 12.32 as of January 20.
| Wallet Category | January 13, 2025 | January 20, 2025 | Change (%) |
|---|---|---|---|
| < 1 BTC | 8.4675% | 8.4565% | -0.13% |
| 1 – 10 BTC | 11.2877% | 11.2870% | -0.0062% |
| 10 – 100 BTC | 22.7835% | 22.8721% | 0.39% |
| 100 – 1k BTC | 28.4713% | 28.4796% | 0.03% |
| 1k – 10k BTC | 21.1831% | 21.1518% | -0.15% |
| 10k+ BTC | 7.8038% | 7.7525% | -0.66% |
The limited decline in the <1 BTC and 1–10 BTC groups indicates that retail investors remain indecisive. The increase in the 10–100 BTC band points to partial accumulation in this segment. The rise in the 100–1,000 BTC range shows that mid-sized investors view prices as an opportunity. In large wallets, there is no significant outflow, but rather cautious position preservation.
Exchange Supply Ratio
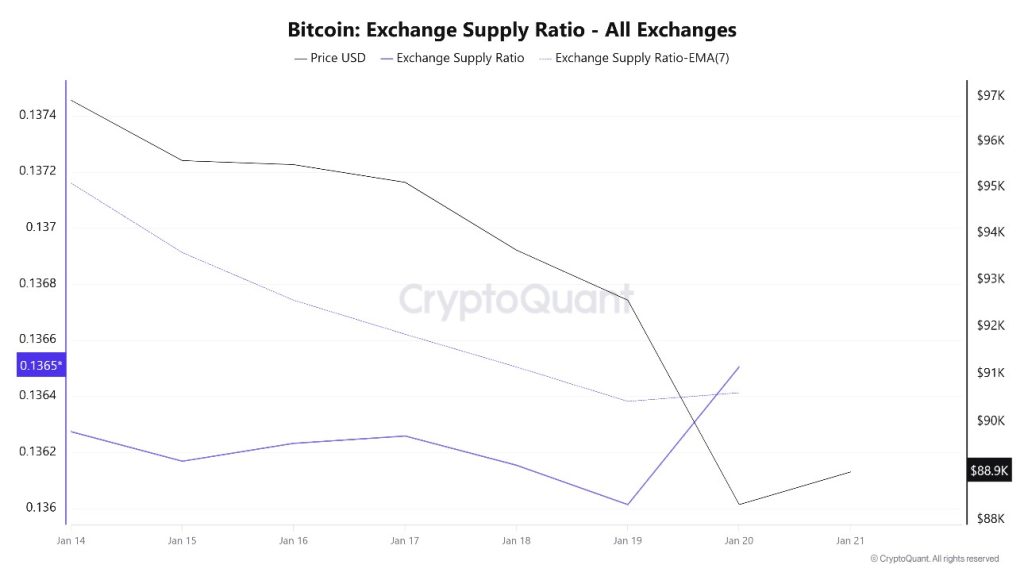
According to Bitcoin Exchange Supply Ratio data, a gradual decline in the Bitcoin supply ratio held on exchanges was observed throughout the week under review. This week, a positive correlation between the Bitcoin price and the supply ratio on exchanges was dominant. The decline in the Exchange Supply Ratio indicates that Bitcoins are being withdrawn from exchanges and held in cold wallets, and that selling pressure remains limited in the short term. Between January 14 and January 21, the Bitcoin Exchange Supply Ratio declined slightly from approximately 0.13627 to 0.13607. During the same period, the Bitcoin price retreated from the $96,000 level to the $92,000 range.
The fact that both the price and the Exchange Supply Ratio moved downwards in the same direction during this period indicates that risk appetite among market participants has weakened and that new Bitcoin inflows into exchanges have remained limited.
Exchange Reserve
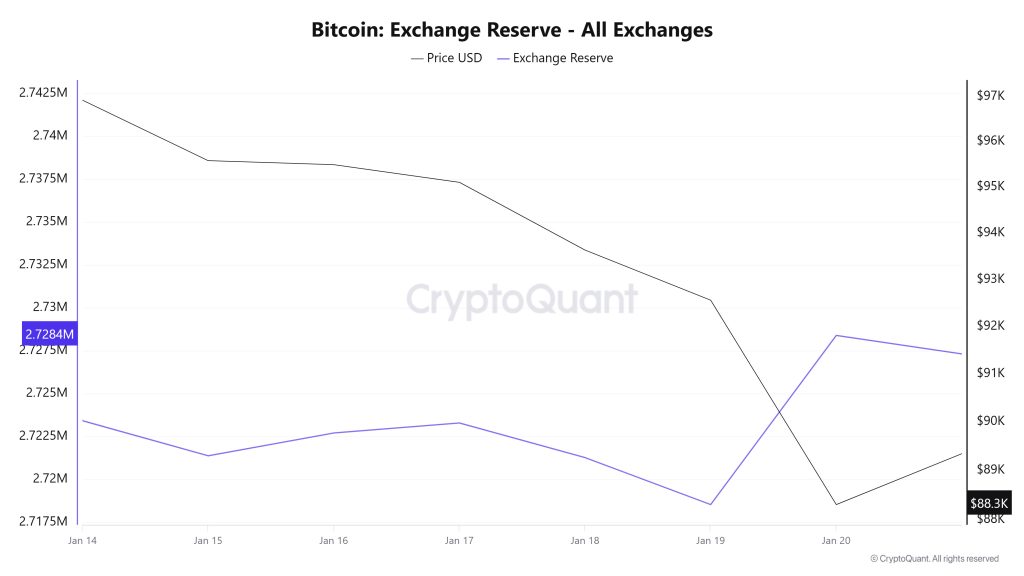
Between January 14 and 20, 2026, Bitcoin reserves on exchanges declined from 2,742,121 BTC to 2,728,402 BTC, recording a net outflow of 13,719 BTC. During this period, exchange reserves decreased by approximately 0.50%, while the BTC price fell from $95,365 to $88,312, experiencing a sharp 7.40% decline. The decrease in exchange reserves during this period of significant price pullback indicated that investors adopted a cautious stance rather than viewing the decline as a selling opportunity. In particular, the continued outflows showed that long-term expectations were not completely undermined despite short-term uncertainty. Pressure on the price and volatile movements are likely to continue in the short term. However, a continued decline in exchange reserves could create a balancing and supportive environment for the Bitcoin price in the long term by limiting supply.
| Date | 14-Jan | 15-Jan | 16-Jan | 17-Jan | Jan 18 | Jan 19 | Jan 20 |
|---|---|---|---|---|---|---|---|
| Exchange Inflow | 45,392 | 46,462 | 33,387 | 8,777 | 6,457 | 14,165 | 37,758 |
| Exchange Outflow | 64,088 | 48,507 | 32,057 | 8,193 | 8,477 | 16,905 | 27,891 |
| Exchange Netflow | -18,696 | -2,045 | 1,330 | 584 | -2,020 | -2,740 | 9,867 |
| Exchange Reserve | 2,723,426 | 2,721,381 | 2,722,711 | 2,723,294 | 2,721,275 | 2,718,535 | 2,728,402 |
| BTC Price | 95,365 | 95,583 | 95,496 | 95,109 | 93,637 | 92,563 | 88,312 |
Fees and Revenues
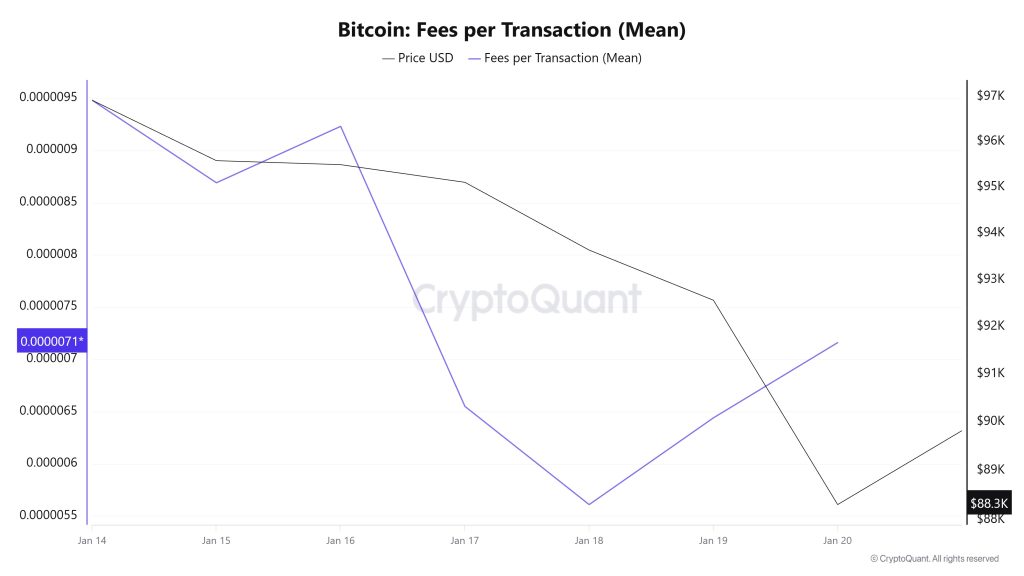
When examining the Bitcoin Fees per Transaction (Mean) data between January 14 and 20, it is observed that on January 14, the first day of the week, the indicator stood at 0.00000948.
A decline was observed until January 18, when the indicator recorded its lowest value of the week at 0.00000561.
In this context, as a result of the increase in Bitcoin price volatility as of January 18, the indicator regained momentum and followed a positive trend due to the impact of price volatility.
On January 20, the last day of the weekly period, the indicator closed the week at 0.00000716 .
Bitcoin: Fees (Total)
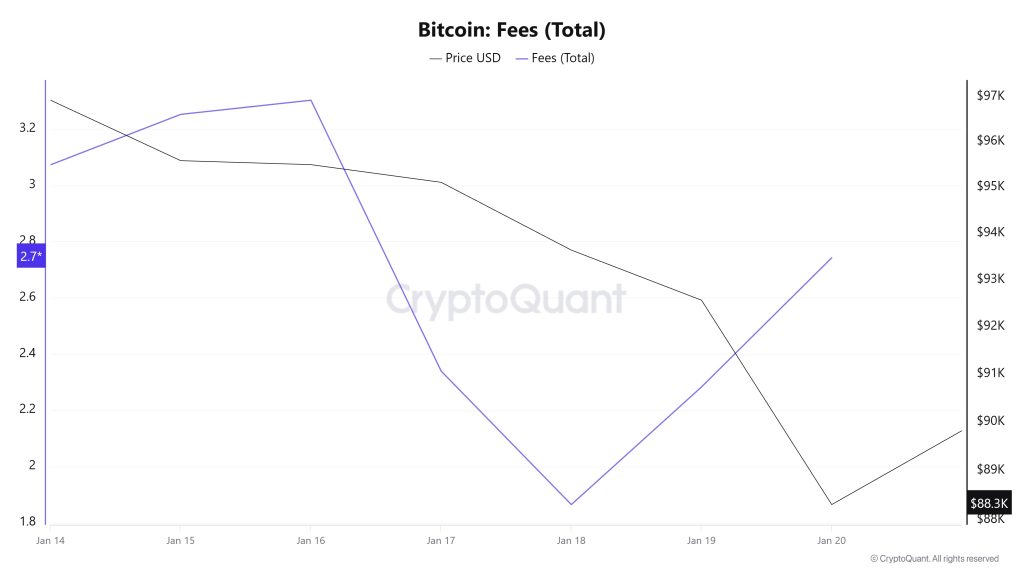
Similarly, when examining the Bitcoin Fees (Total) data for the period between January 14 and 20, it is seen that the indicator reached 3.07288284 on January 14, the first day of the week.
A decline was observed until January 18, and on that date, the indicator recorded the week’s lowest value at 1.86424165.
In this context, as a result of the increase in Bitcoin price volatility as of January 18, the indicator regained momentum and followed a positive trend due to the impact of price volatility.
On January 20, the last day of the weekly period, the indicator closed the week at 2.74208451.
Miner Flows
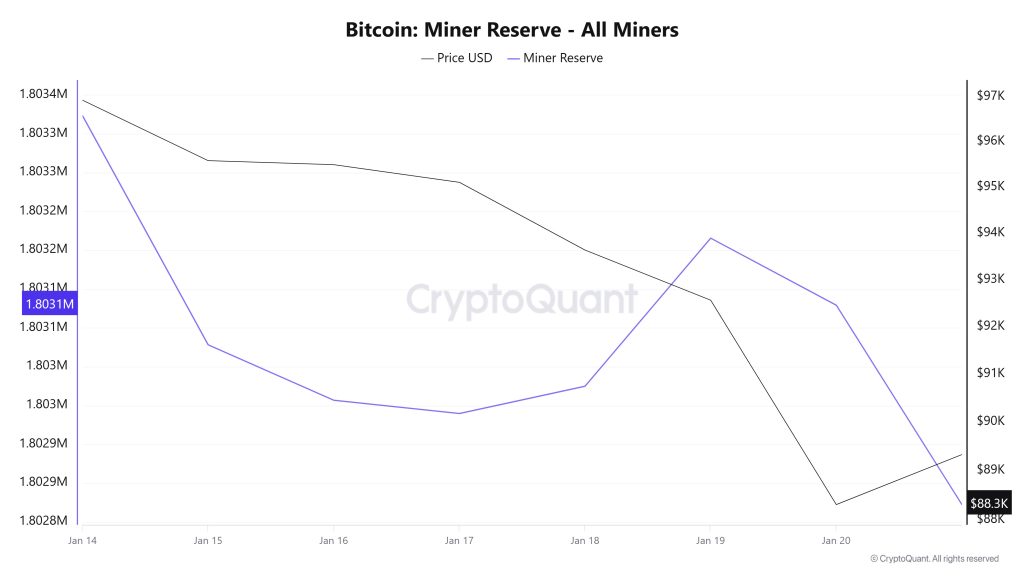
According to data obtained from the Miner Reserve table, a slight decrease in Bitcoin reserves held in miners’ wallets was observed this week. A time-dependent correlation structure between the Bitcoin price and miner reserve was observed during the period under review. However, the general trend shows that a positive correlation between these two variables is dominant.
Miner Inflow, Outflow, and Netflow
Between January 14 and 20, 43,805 Bitcoin were withdrawn from miners’ wallets, while 43,541 Bitcoin were deposited into miner wallets during the same period. This week’s Miner Netflow was -264 Bitcoin. Meanwhile, the Bitcoin price was $96,921 on January 14 and $88,312 on January 20.
Throughout the week, Bitcoin inflows into miner wallets (Miner Inflow) were less than Bitcoin outflows from miner wallets (Miner Outflow), resulting in a negative net flow (Miner Netflow).
| Metric | Jan. 14 | Jan. 15 | Jan. 16 | Jan. 17 | Jan. 18 | Jan. 19 | Jan. 20 |
|---|---|---|---|---|---|---|---|
| Miner Inflow | 7,693.33 | 8,757.97 | 5,817.13 | 3,431.52 | 2,074.68 | 5,501.28 | 10,265.10 |
| Miner Outflow | 7,713.39 | 9,052.99 | 5,888.48 | 3,448.60 | 2,039.56 | 5,310.58 | 10,351.45 |
| Miner Netflow | -20.06 | -295.03 | -71.36 | -17.08 | 35.12 | 190.71 | -86.36 |
Transaction
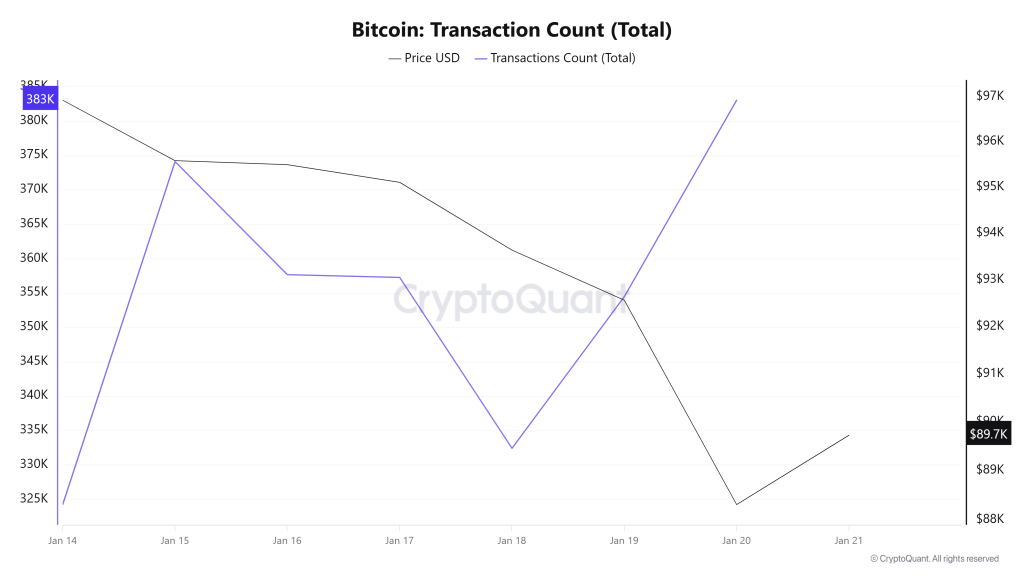
Last week, 2,640,960 transactions took place on the Bitcoin network, while this week the number of transactions fell to 2,483,019, recording a decrease of approximately 6%. The highest transaction volume for the period was recorded on January 20 at 383,015, while the lowest transaction volume was measured on December 18 at 332,386.
Looking at the transaction count graph, we see that the number of transactions on weekends (Saturday/Sunday) is close to each other and below the weekly average. While it is clear that the weekend transaction frenzy that has been going on for several weeks did not occur this week, the negative correlation between prices and transfer numbers throughout the period highlights that the danger persists.
Tokens Transferred
While a total of 4,820,000 BTC was transferred in the previous period, this week’s volume rose by 10.5% to 5,325,042 BTC. The highest daily transfer volume of the week was recorded on January 14 at 1,068,436 BTC, while the lowest daily volume was recorded on January 18 at 471,756 BTC. The correlation between the amount of BTC transferred and the price remained stable throughout the period.
While the amount of Bitcoin transferred increased, the decline in transaction count data indicates that the amount of Bitcoin per transaction on the network increased compared to the previous week. This shows that higher-volume transactions gained prominence during the period. This structure indicates that usage on the network decreased compared to the previous week, but the size of active users’ holdings became more dynamic.
Whale Activities
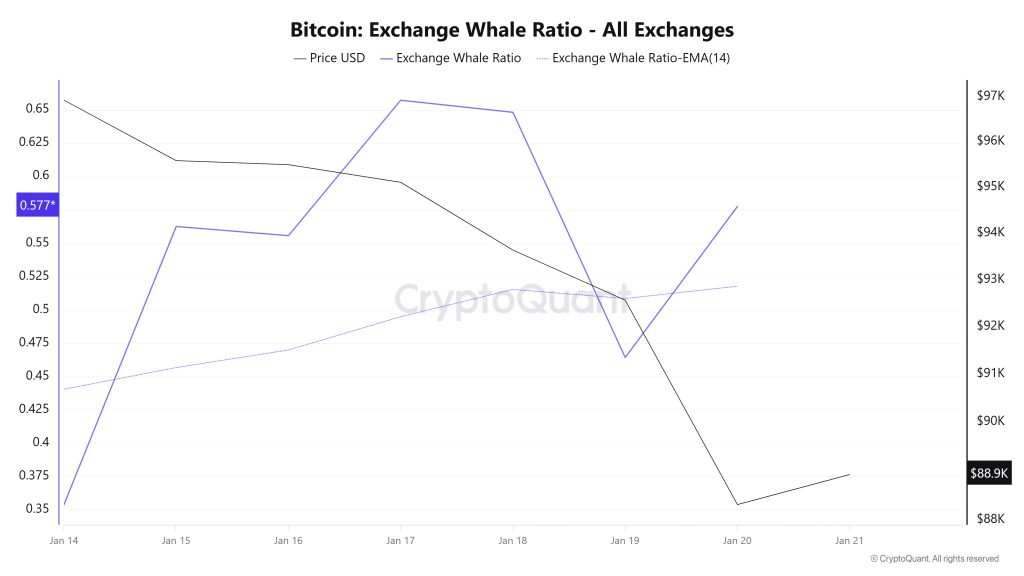
Whale Data:
Looking at whale activity on centralized exchanges over the last 7 days based on crypto market data, the metric experienced an uptrend from the beginning to the middle of the period, followed by a slight pullback for the remainder of the period. This signaled increased activity on centralized exchanges. Looking at the Exchange Whale Ratio metric, on January 14, the first day of the 7-day period, the ratio of whales using centralized exchanges was 0.353, forming the lowest point of the process. The peak of the process occurred on January 17, reaching a value of 0.657. When this ratio is above the 0.35–0.45 band, it generally means that whales are frequently using centralized exchanges. Currently at a value of 0.577, the metric corresponds to a time when whales are intensively using centralized exchanges during the process. During this process, the price fluctuated between $97,900 and $87,800. This indicated that the selling side prevailed in the buying and selling battle among whales on centralized exchanges. At the same time, the total BTC transfer increased by approximately 10% compared to last week, with 5,324,563 BTC moving. The data indicates that the BTC price is struggling to gain momentum after falling below $90,000, suggesting that selling pressure will continue in the short term. Exchange inflows dominated by whales showed high selling pressure for Bitcoin around $96,000 to $90,000. Selling pressure persists, and a pullback toward the 85,000 level may continue.
BTC Onchain Overall
| Metric | Positive 📈 | Negative 📉 | Neutral ➖ |
|---|---|---|---|
| Active Addresses | ✓ | ||
| Breakdowns | ✓ | ||
| Derivatives | ✓ | ||
| Supply Distribution | ✓ | ||
| Exchange Supply Ratio | ✓ | ||
| Exchange Reserve | ✓ | ||
| Fees and Revenues | ✓ | ||
| Miner Flows | ✓ | ||
| Transaction | ✓ | ||
| Whale Activity | ✓ |
*The metrics and guidance provided in the table do not alone explain or imply any expectation of future price changes for any asset. Digital asset prices can fluctuate based on many different variables. The on-chain analysis and related guidance are intended to assist investors in their decision-making process, and basing financial investments solely on the results of this analysis may lead to unfavorable outcomes. Even if all metrics produce positive, negative, or neutral results simultaneously, the expected outcomes may not materialize depending on market conditions. It would be beneficial for investors reviewing the report to take these warnings into consideration.
Legal Notice
The investment information, comments, and recommendations contained in this document do not constitute investment advisory services. Investment advisory services are provided by authorized institutions on a personal basis, taking into account the risk and return preferences of individuals. The comments and recommendations contained in this document are of a general nature. These recommendations may not be suitable for your financial situation and risk and return preferences. Therefore, making an investment decision based solely on the information contained in this document may not result in outcomes that align with your expectations.
NOTE: All data used in Bitcoin on-chain analysis is based on CryptoQuant.
