
BTC/USDT
While geopolitical tensions eased somewhat with progress on the Greenland-centered framework agreement between the US and EU, NATO’s emphasis on Arctic security, progress in the US budget process, and SEC-CFTC coordination on crypto regulations remained at the center of the global agenda. In Asia, the Bank of Japan’s interest rate decision was monitored, while tough messages from Washington regarding Cuba and Greenland kept the risk narrative firmly on the agenda.
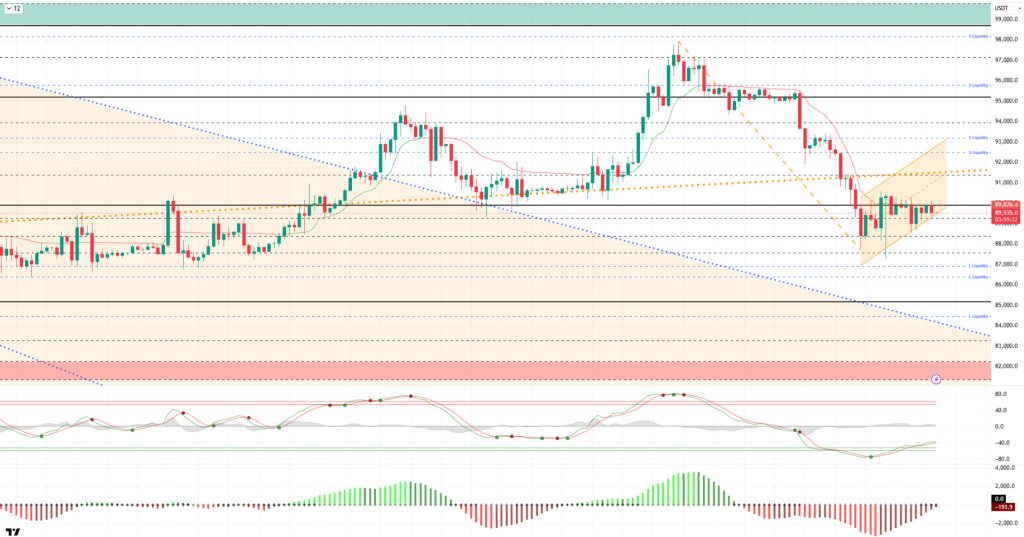
From a technical perspective, after losing its upward channel, BTC recorded a gradual decline, falling back to the 87,000 level. From there, the price, with limited rebound rallies, has not yet achieved a clear break above the 90,000 level. The price’s relatively weak movement has formed a reverse flag pattern. In the next phase, the 90,000 reference level will be followed by the major upward trend line at 91,400 as a critical resistance area. Closings above this level could break the structure and pave the way for a new upward movement. In this regard, liquidity areas will be decisive. Otherwise, the impact of selling pressure may increase in the event of a possible rejection.
Technical indicators show that the Wave Trend (WT) oscillator continues to maintain its buy signal generated in the oversold zone. The histogram on the Squeeze Momentum (SM) indicator is preparing to move into positive territory. The Kaufman Moving Average (KAMA) is currently hovering just above the price at $89,878.
Looking at liquidation data, the buy level has started to build up again around the $88,000 level. While the sell level continues to get busier, clusters of trades above $91,000 in the short term, then $92,000 – $93,500, and $95,000 in the long term have turned this area into a liquidity zone.
In summary, on the political front, the US’s insistence on Greenland led to an agreement with the EU, easing pressure on the markets. Trump, maintaining his tough stance on Iran, drew attention with his steps towards the Cuban regime. On the economic front, the BoJ kept interest rates steady as expected. The US House of Representatives approved the fiscal stimulus package. In the crypto arena, the SEC and CFTC will meet to discuss crypto regulations, and the possible outcome could act as a catalyst for prices. Looking at liquidity data, short-term buying is starting to reposition itself, while selling pressure continues. Technically, BTC started the new year with positive momentum, but after testing the 98,000 level, it fell back to the 87,000 level due to profit-taking and renewed selling pressure. The formation of a flag pattern in the price structure, which lost its minor upward channel, is noteworthy. From this point on, the 90,000 and then the 91,400 levels are critical resistance levels, and closes above them will be decisive. In the event of possible selling pressure, the 89,000 and 88,000 levels will be monitored as support zones.
Supports: 89,000 – 88,000 – 87,500
Resistances: 90,000 – 91,400 – 92,600
ETH/USDT
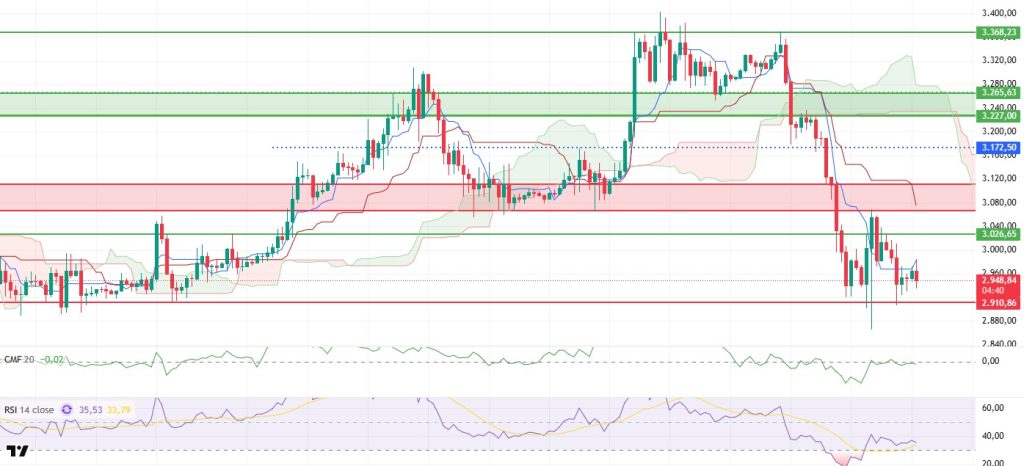
As expected, the ETH price retreated to the $2,910 support level yesterday evening due to selling pressure. Although buying from this area halted the decline, the limited reaction indicates that the price is still moving on weak ground. Even if there is a desire for recovery in the short term, it appears that buyers have not yet made their presence felt in the market.
There is no strong recovery on the liquidity side. Chaikin Money Flow (CMF) continues to move around the zero line. This outlook indicates that the amount of money entering the market remains low and that attempts to rise have not found sufficient support. Unless liquidity strengthens, it seems difficult for upward moves to be sustained.
The momentum front also continues to look weak. Although the Relative Strength Index (RSI) has moved out of the oversold zone, the pace of the uptrend is quite limited. The RSI remaining weak suggests that momentum has not yet recovered and that it will not be easy to push prices higher.
The technical outlook is also under pressure from the Ichimoku indicator. The re-loss of the Tenkan level increases short-term weakness. As there is still no clear sign of recovery on the Kijun and Kumo cloud side, the technical structure remains cautious.
In the overall assessment, the $2,910 level is the most critical support position during the day. If it falls below this level, the decline may continue and more severe selling may come into play. On the upside, it is difficult to speak of a positive scenario unless the $3,111 level is regained. In the current scenario, although the ETH price is trying to react, the overall outlook remains weak and cautious.
Below the Form
Supports: 2,910 – 2,727 – 2,625
Resistances: 3,026 – 3,111 – 3,227
XRP/USDT
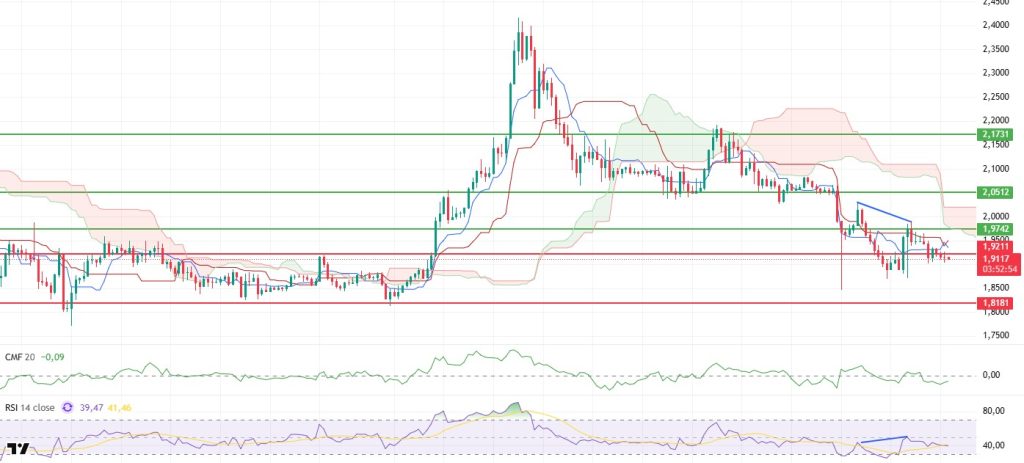
The XRP price lost its $1.92 support level yesterday evening as selling pressure continued, and the pullback began to deepen. After rejection from the $1.97 region, buyers remained weak, reducing the likelihood of a short-term recovery. The loss of the $1.92 level suggests that the price’s downward movement could continue for some time.
The liquidity outlook is negative. Chaikin Money Flow (CMF) remains in negative territory, indicating weak money inflows. Unless liquidity support arrives, upward moves are likely to remain limited, and selling pressure is expected to ease.
Pressure continues on the momentum front. The negative divergence on the Relative Strength Index (RSI) is still valid and reveals that momentum is losing strength. As long as the RSI remains in the weak zone, it is more likely that rebound buying will be short-lived and the decline will continue gradually.
On the technical side, the Ichimoku indicator also maintains its weak outlook. The price remaining below the kumo cloud and the failure to regain the Tenkan and Kijun levels indicate that risks remain on the table in the short term. Unless this structure improves, upward movements are likely to encounter selling pressure.
In the overall assessment, two levels stand out in terms of direction. If $1.92 cannot be regained, the decline is expected to continue towards the $1.81 level. On the other hand, if the price rises above $1.97, short-term recovery attempts may regain strength. Pressure continues in the current picture, and critical levels need to be regained for buyers to gather strength.
Supports: 1.8181 – 1.7705 – 1.6224
Resistances: 1.9211 – 1.9742 – 2.0512
SOL/USDT
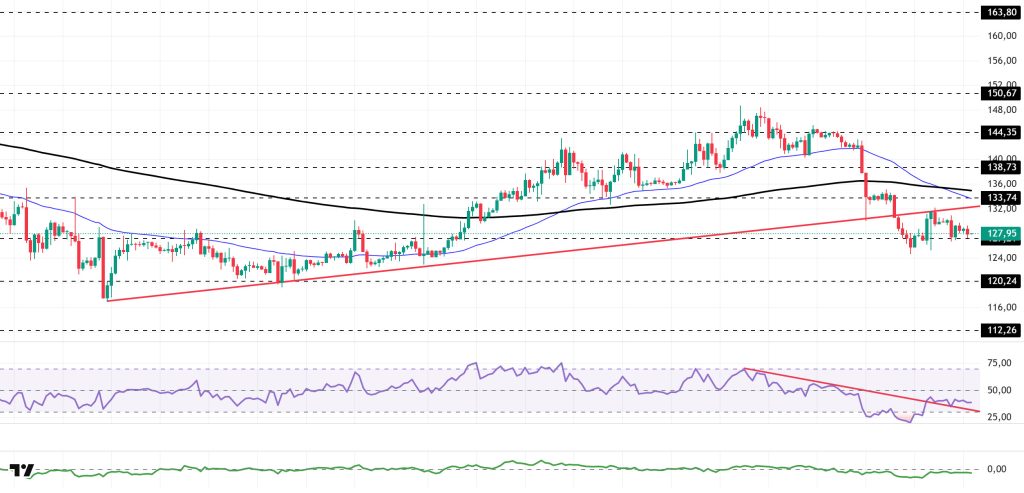
The SOL price experienced a slight pullback. The asset remained in the lower region of the rising line that began on December 18. After finding support at the strong support level of $127.21 and experiencing a slight uptick, the asset is currently preparing to retest the strong support level of $127.21. If the candle closes above the rising line, the 200 EMA (Black Line) may act as resistance. If it experiences a pullback, the strong support level of $120.24 may be triggered as support.
On the 4-hour chart, the 50 EMA (Exponential Moving Average – Blue Line) continues to be below the 200 EMA (Black Line). This indicates that a downtrend may begin in the medium term. At the same time, the price being below both moving averages indicates that the asset is trending downward in the short term. The Chaikin Money Flow (CMF-20) has fallen from neutral to negative territory. However, an increase in money inflows could push the CMF into positive territory. The Relative Strength Index (RSI-14) tested the support level of the downward trend that began on January 14 and remained in the upper region of the trend. This indicates that selling pressure is continuing but has decreased. In the event of an uptrend driven by macroeconomic data or positive news related to the Solana ecosystem, the $150.67 level stands out as a strong resistance point. If this level is broken upward, the uptrend is expected to continue. In the event of pullbacks due to developments in the opposite direction or profit-taking, the $120.24 level could be tested. A decline to these support levels could increase buying momentum, presenting a potential opportunity for an upward move.
Supports: 127.21 – 120.24 – 112.26
Resistances: 133.74 – 138.73 – 144.35
DOGE/USDT
21Shares launched the first spot Doge ETF on NASDAQ.
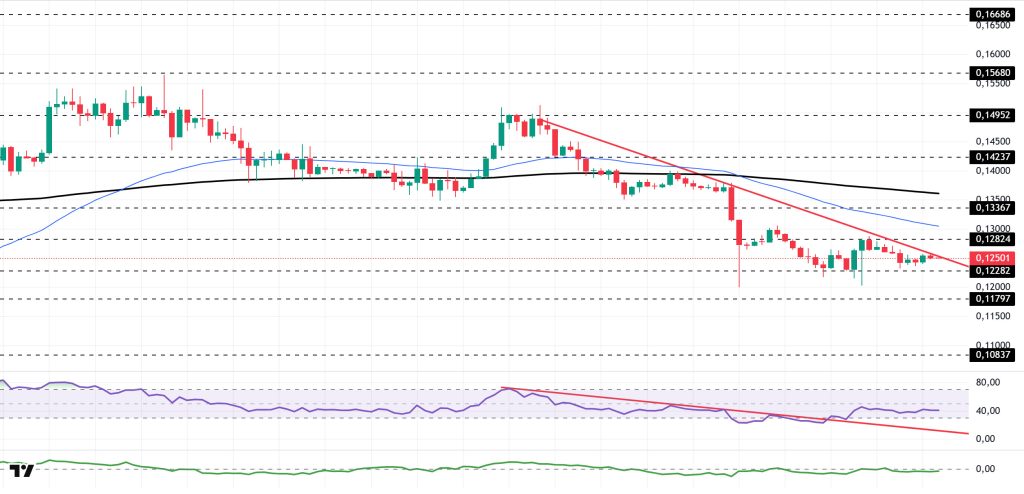
The DOGE price remained flat during the day. The asset continued to trade in the lower region of the downtrend that began on January 14. Testing the strong support level of $0.12282, the price gained momentum from this level and rose, and is currently testing the downtrend as resistance. Above this level, the 50 EMA (Blue Line) moving average may act as resistance in the event of a candle close. In the event of a pullback, it may retest the $0.12282 level as support.
On the 4-hour chart, the 50 EMA (Exponential Moving Average – Blue Line) remained below the 200 EMA (Black Line). This indicates a medium-term downtrend. The price being below both moving averages suggests a short-term downward trend. The Chaikin Money Flow (CMF-20) remained in negative territory. Additionally, an increase in money outflows could push the CMF deeper into negative territory. The Relative Strength Index (RSI-14) remained in the middle of negative territory. At the same time, it continued to stay above the downward trend line that began on January 14, indicating a decrease in selling pressure. In the event of a rise driven by political developments, macroeconomic data, or positive news flow in the DOGE ecosystem, the $0.14952 level stands out as a strong resistance zone. Conversely, in the event of negative news flow, the $0.10837 level could be triggered. A decline to these levels could increase momentum and initiate a new wave of growth.
Supports: 0.12282 – 0.11797 – 0.10837
Resistances: 0.12824 – 0.13367 – 0.14237
Legal Notice
The investment information, comments, and recommendations contained herein do not constitute investment advice. Investment advisory services are provided individually by authorized institutions taking into account the risk and return preferences of individuals. The comments and recommendations contained herein are of a general nature. These recommendations may not be suitable for your financial situation and risk and return preferences. Therefore, making an investment decision based solely on the information contained herein may not produce results in line with your expectations.

