
BTC/USDT
As the Fed shifted to a monitoring mode on interest rates and expectations grew that it would keep its policy rate unchanged this week, the message that the resumption of rate cuts would be tied to inflation and labor market data stood out. On the crypto front, the Trump family-backed American Bitcoin’s new BTC purchase signaled continued institutional demand, while Japan launched a regulatory process for bonds to be used in stablecoin reserves. On the stablecoin side, Tether’s launch of the federally regulated USA₮ in the US and its strengthening of its balance sheet with increased treasury bill, gold, and Bitcoin reserves stood out as an important step in the integration of digital assets with traditional finance.
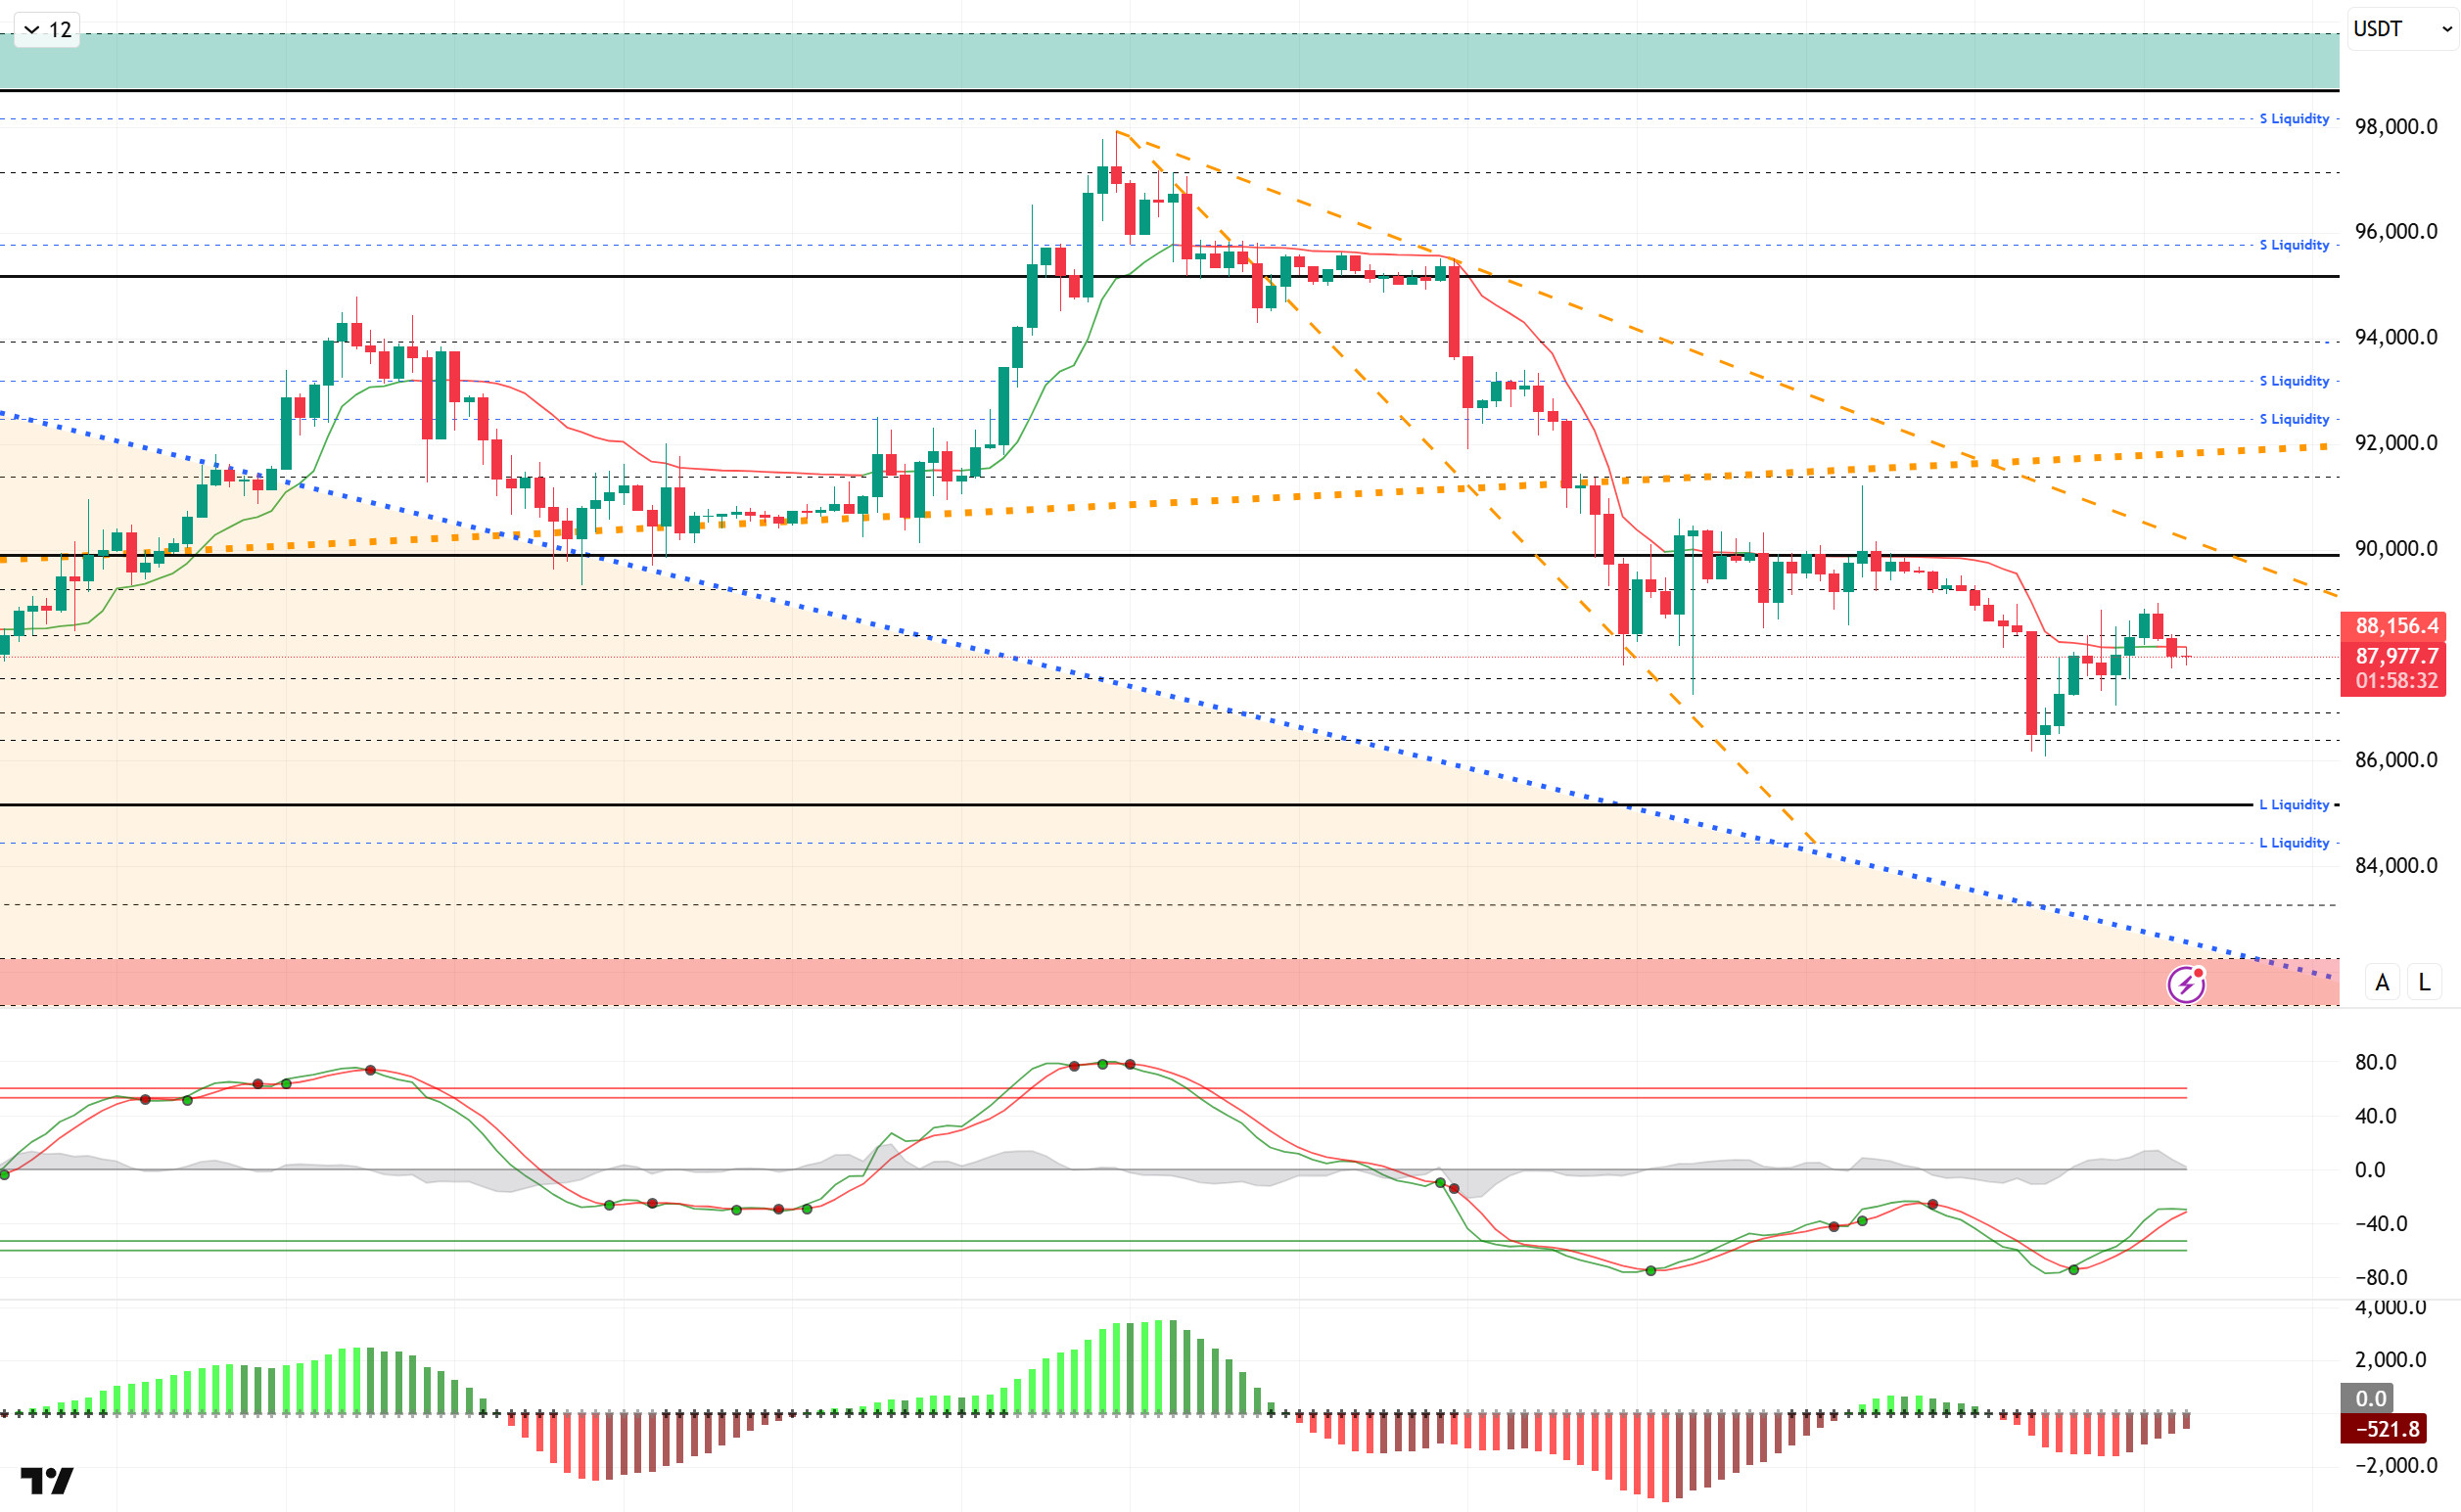
From a technical perspective, low volatility and volume continue in BTC compared to the previous analysis. The limited upward reaction of the price, which is showing a slightly bearish picture, may indicate that upward movements could be limited. However, its structure within the declining trend could bring a move towards the 85,000 reference level back into focus. The only obstacle to this scenario could be the breakout of the declining channel and the crossing of minor and major lines.
Technical indicators show that the Wave Trend (WT) oscillator’s buy signal in the oversold zone is beginning to weaken. The Squeeze Momentum (SM) indicator’s histogram attempt to move into positive territory was short-lived and is back in negative territory. The Kaufman Moving Average (KAMA) is currently trading just above the price at $88,156.
Looking at liquidation data, although the buy level was liquidated at 86,000 and 88,000, the recent decline has created a new buy level at 86,000. On the other hand, part of the intensity created by the sell level in the short term in the 88,000-89,000 band has been liquidated. In the long term, positions above the 90,000 level continue to accumulate.
In summary, while the Fed’s messages of a pause in its interest rate cut path are prominent, institutional Bitcoin purchases continue. On the stablecoin front, Tether’s new stablecoin integration with traditional finance is quite noteworthy. Looking at liquidity data, buying levels have become sparse with the recent decline, while selling levels continue to dominate.In technical terms, BTC started the new year with positive momentum, but after testing the 98,000 level, it entered a new wave of selling pressure with profit-taking, falling back to the 86,000 level. The price, which lost the minor upward channel it had formed, confirmed the decline with the falling flag seen in its structure. From this point on, the 85,000 level will be monitored as a reference zone, while in the event of a recovery, 89,000 will be monitored as resistance and 90,000 as a critical reference zone.
Supports: 87,500 – 86,000 – 85,000
Resistances: 89,000 – 90,000 – 91,400
ETH/USDT
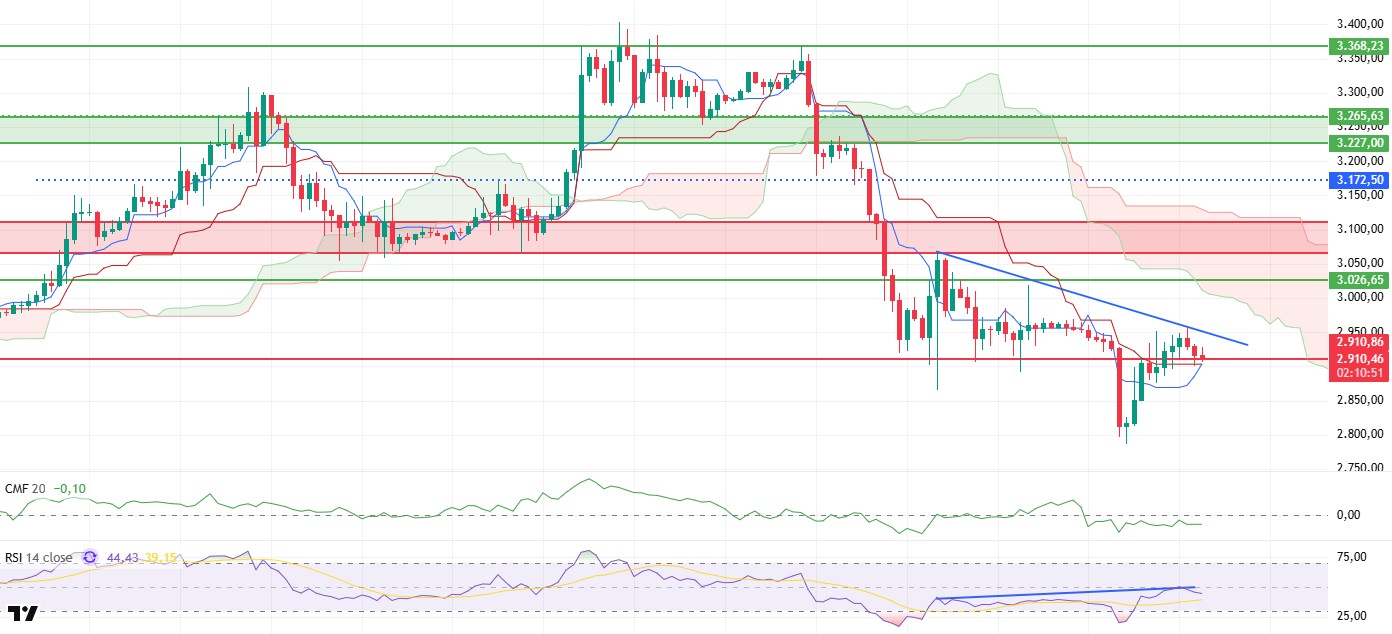
The ETH price experienced the expected pullback during the day and fell to the $2,910 support level due to the negative divergence on the RSI mentioned in the morning analysis. The price is currently trying to hold in this area. The reaction at this level will be decisive for the continuation of the upward attempt.
The picture on the liquidity side remains unchanged. Chaikin Money Flow (CMF) continues its horizontal course in negative territory. This outlook indicates that the money entering the market is still limited and that buyers do not have the strength to reverse the decline. It is difficult to expect a strong recovery without a clear improvement on the liquidity side.
The momentum front also continues to weaken. The Relative Strength Index (RSI) has fallen below the 50 level and continues its downward movement. This structure suggests that momentum has shifted back in favor of sellers and that rebound rallies may remain fragile.
On the technical side, the Ichimoku indicator presents a more balanced picture in the short term. The price remaining above the Tenkan level and the Tenkan line cutting the Kijun line upwards keeps the short-term positive scenario alive. However, the price still trading below the kumo cloud indicates that the main trend is negative and that this recovery has not yet been confirmed.
In the overall assessment, the $2,910 level is critically important in terms of intraday direction. A close below this level, combined with the negative outlook on the RSI, could pave the way for a continued decline. Conversely, maintaining $2,910, combined with the short-term positive structure on the Ichimoku side, could pave the way for a new upward attack. The price reaction at this stage will be decisive in determining the direction.
Supports: 2,910 – 2,727 – 2,625
Resistances: 3,026 – 3,111 – 3,227
XRP/USDT
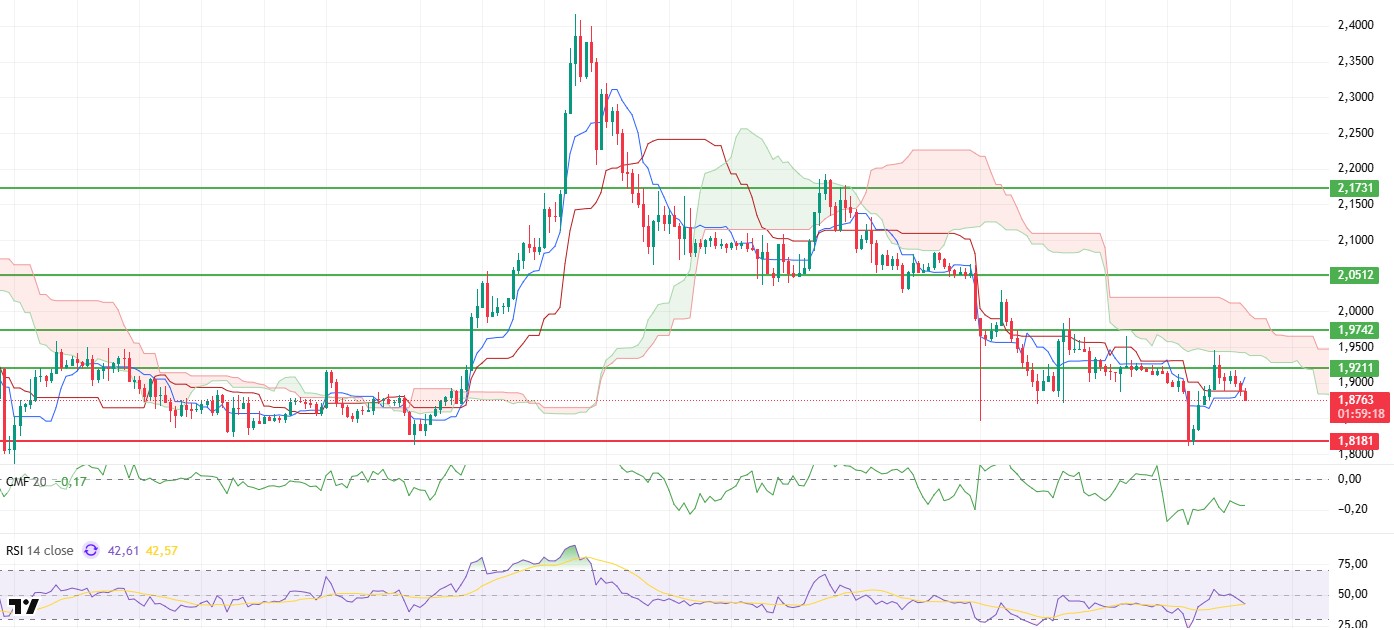
The XRP price continued its weak performance during the day and retreated to the $1.87 level under the influence of selling pressure. After selling pressure from the $1.92 region tested yesterday evening, the price returned to the lower band, indicating that buyers still lack clear control. The current pricing suggests that the market remains indecisive about its direction in the short term and that a cautious stance is being maintained.
The liquidity outlook remains unchanged compared to the morning hours. The Chaikin Money Flow (CMF) continues its horizontal movement in negative territory. This structure reveals that the money entering the market remains weak and that the liquidity power to support upward attempts in the price has not yet formed. Unless there is a clear recovery in liquidity, it seems difficult for the upward trend to become sustainable.
Pressure is becoming more pronounced on the momentum front. The Relative Strength Index (RSI) continues to pull back from the 50 level, signaling a continued weakening in momentum. This movement in the RSI indicates that buyers are losing strength and downside risks are coming to the fore again.
The technical outlook still produces mixed signals from the Ichimoku indicator. Although the Tenkan level crossing above the Kijun level stands out as a positive detail in the short term, the price remaining below the kumo cloud confirms that the main trend is negative. Therefore, the buy signal that has formed does not yet confirm a strong trend reversal.
In the overall assessment, the $1.92 level retains its importance. As long as this area is not breached, attempts at recovery are likely to remain weak, and the price is likely to remain under downward pressure. However, if a sustained price above $1.92 is seen, the short-term outlook could improve again. At this stage, the XRP price is under pressure and needs a strong buyer response for the direction to become clear.
Supports: 1.8181 – 1.7705 – 1.6224
Resistances: 1.9211 – 1.9742 – 2.0512

SOL/USDT
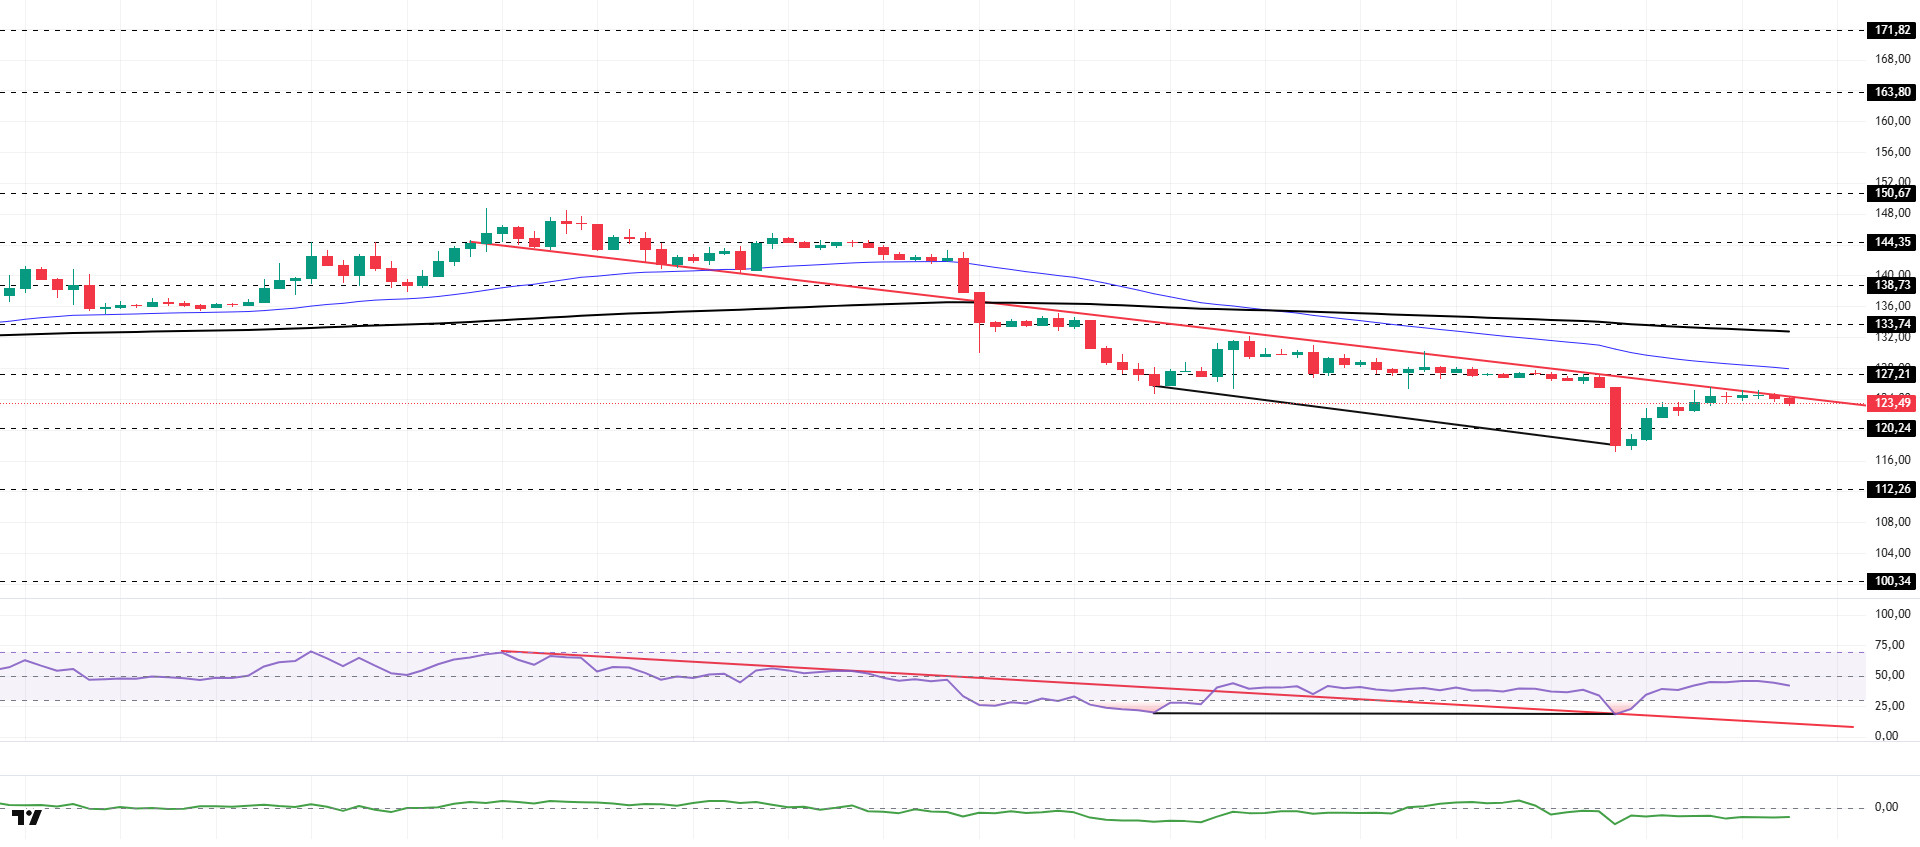
The SOL price traded sideways during the day. The asset remained in the lower region of the downtrend that began on January 13. Testing the strong support level of $120.24, the asset gained momentum and rose from there. Currently testing the downward trend line as resistance, the price could test the 50 EMA (Blue Line) moving average as resistance if it breaks above this level. In the event of a pullback, the $120.24 level should be monitored.
On the 4-hour chart, the 50 EMA (Exponential Moving Average – Blue Line) continues to be below the 200 EMA (Black Line). This indicates that a downtrend may begin in the medium term. At the same time, the price being below both moving averages shows that the asset is trending downward in the short term. The Chaikin Money Flow (CMF-20) remained in negative territory. However, the decrease in money inflows could pull the CMF deeper into negative territory. The Relative Strength Index (RSI-14) is near the neutral level in negative territory. It also remained in the upper region of the downward trend that began on January 14. This indicates that although selling pressure continues, it has decreased. In the event of an upturn due to macroeconomic data or positive news related to the Solana ecosystem, the $150.67 level stands out as a strong resistance point. If this level is broken upwards, the uptrend is expected to continue. If pullbacks occur due to developments in the opposite direction or profit-taking, it may test the $112.26 level. A decline to these support levels could increase buying momentum, presenting a potential upside opportunity.
Supports: 120.24 – 112.26 – 100.34
Resistances: 127.21 – 133.74 – 138.73
DOGE/USDT
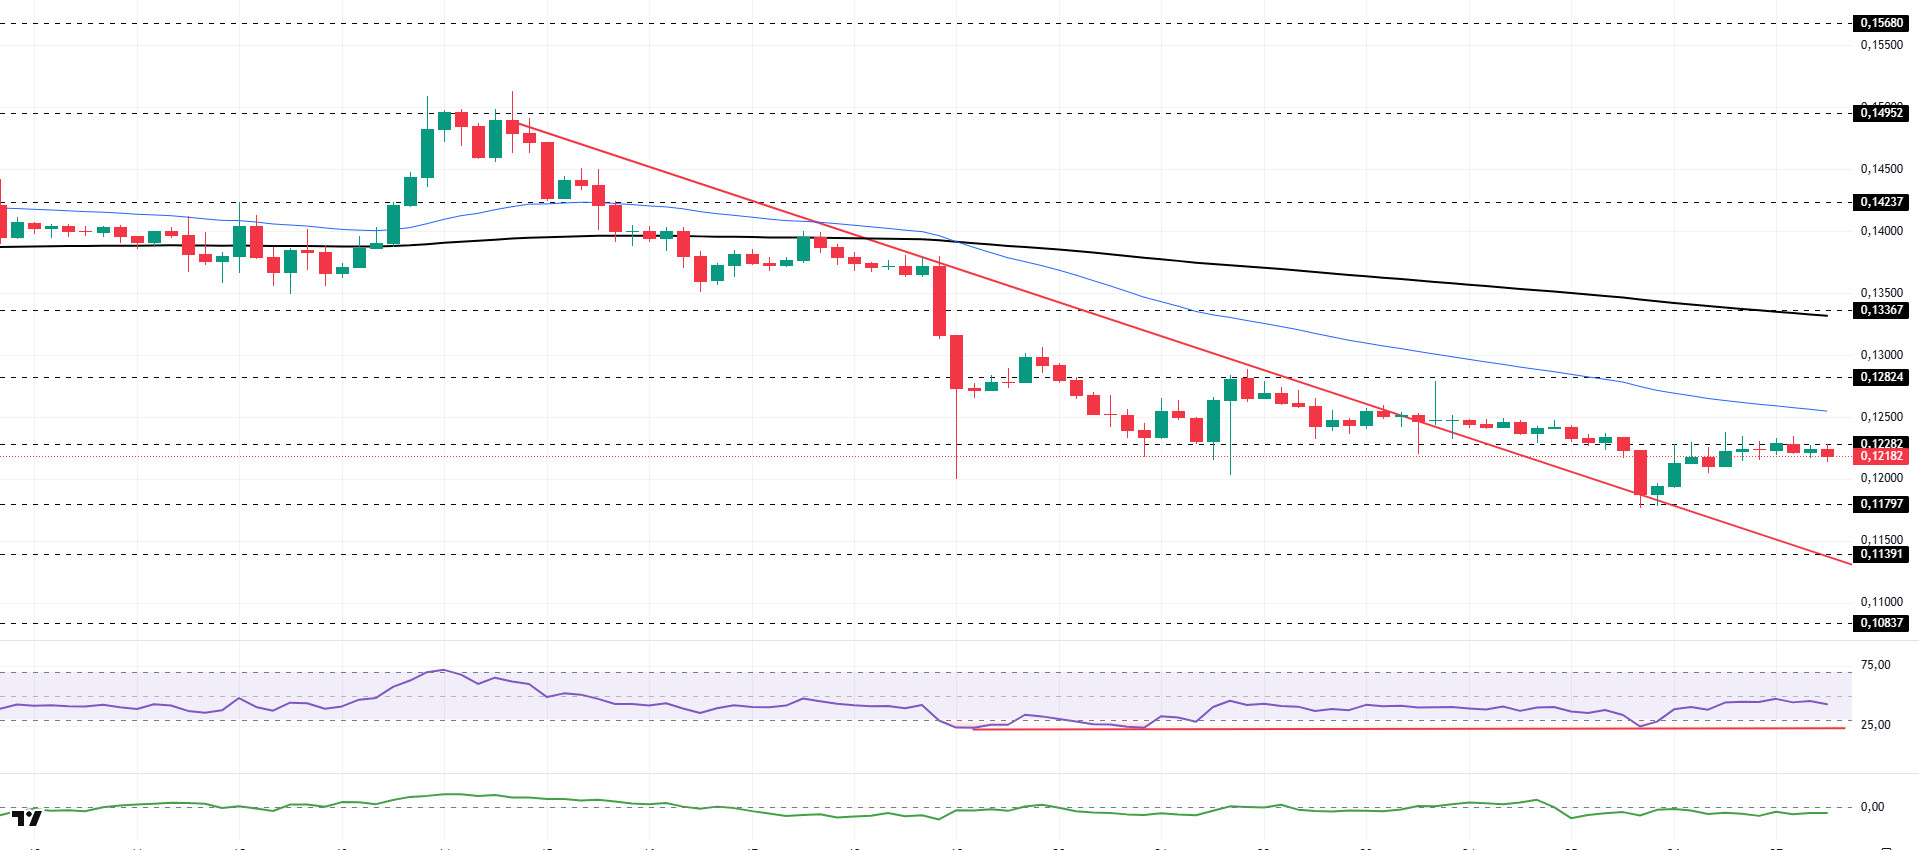
The DOGE price traded sideways during the day. The asset remained in the upper region of the downtrend that began on January 14, signaling that buying pressure could increase. Testing the strong support level of $0.11797 and the descending trend line as support, the price gained momentum from this level and rose, currently testing the $0.12282 level as resistance. The 50 EMA (Blue Line) moving average may act as resistance in candle closes above this level. In the event of a pullback, it may retest the $0.11797 level or the descending trend line as support.
On the 4-hour chart, the 50 EMA (Exponential Moving Average – Blue Line) remained below the 200 EMA (Black Line). This indicated a downtrend forming in the medium term. The price being below both moving averages suggests that the price may be trending downward in the short term. The Chaikin Money Flow (CMF-20) remained in negative territory. Additionally, an increase in money inflows could push the CMF into positive territory. The Relative Strength Index (RSI-14) remained near the neutral level in negative territory. At the same time, it continued to be in the upper region of the line that began on January 19, indicating a decrease in selling pressure. In the event of an uptrend driven by political developments, macroeconomic data, or positive news flow in the DOGE ecosystem, the $0.13367 level stands out as a strong resistance zone. Conversely, in the event of negative news flow, the $0.10837 level could be triggered. A decline to these levels could increase momentum and initiate a new wave of growth.
Supports: 0.11797 – 0.11391 – 0.10837
Resistances: 0.12282 – 0.12824 – 0.13367
TRX/USDT
As mentioned in this morning’s analysis, TRX failed to stay above the 0.2950 support level after the decline and is currently trading at 0.2942. Currently just above the middle band of the bearish channel, TRX is trading very close to the 0.2950 resistance level on the 4-hour chart. The Relative Strength Index (RSI) value is seen approaching the oversold zone at 39. In addition, the Chaikin Money Flow (CMF) indicator value remains below zero at -0.14, indicating continued money outflows. The CMF’s persistence in the negative zone signals that downward pressure on the price may increase.
In light of all these indicators, TRX may decline further in the second half of the day and move towards the lower band of the bearish channel. In such a case, it may test the 0.2890 support level. It could continue its decline with a candlestick close below the 0.2890 support level and may test the 0.2820 support level. If there is no candlestick close below the 0.2890 support level and the CMF moves into positive territory, capital inflows could gain strength and the price could test the 0.2950 resistance level after a possible rise.
On the 4-hour chart, 0.2765 is an important support level, and as long as it remains above this level, the upward momentum is expected to continue. If this support level is broken, selling pressure may increase.
Supports: 0.2890 – 0.2820 – 0.2765
Resistances: 0.2950 – 0.3015 – 0.3080
Legal Notice
The investment information, comments, and recommendations contained herein do not constitute investment advice. Investment advisory services are provided individually by authorized institutions taking into account the risk and return preferences of individuals. The comments and recommendations contained herein are of a general nature. These recommendations may not be suitable for your financial situation and risk and return preferences. Therefore, making an investment decision based solely on the information contained herein may not produce results in line with your expectations.

