
BTC/USDT
Markets are focused on the Fed’s first-interest rate decision of 2026. While a pause in rate cuts seems almost certain, the Fed’s independence, discussions surrounding the new chair nominee, and uncertainty over whether Jerome Powell will continue in his role are increasing. During this process, gold prices have risen to record levels while the dollar index has fallen to its lowest level in four years.
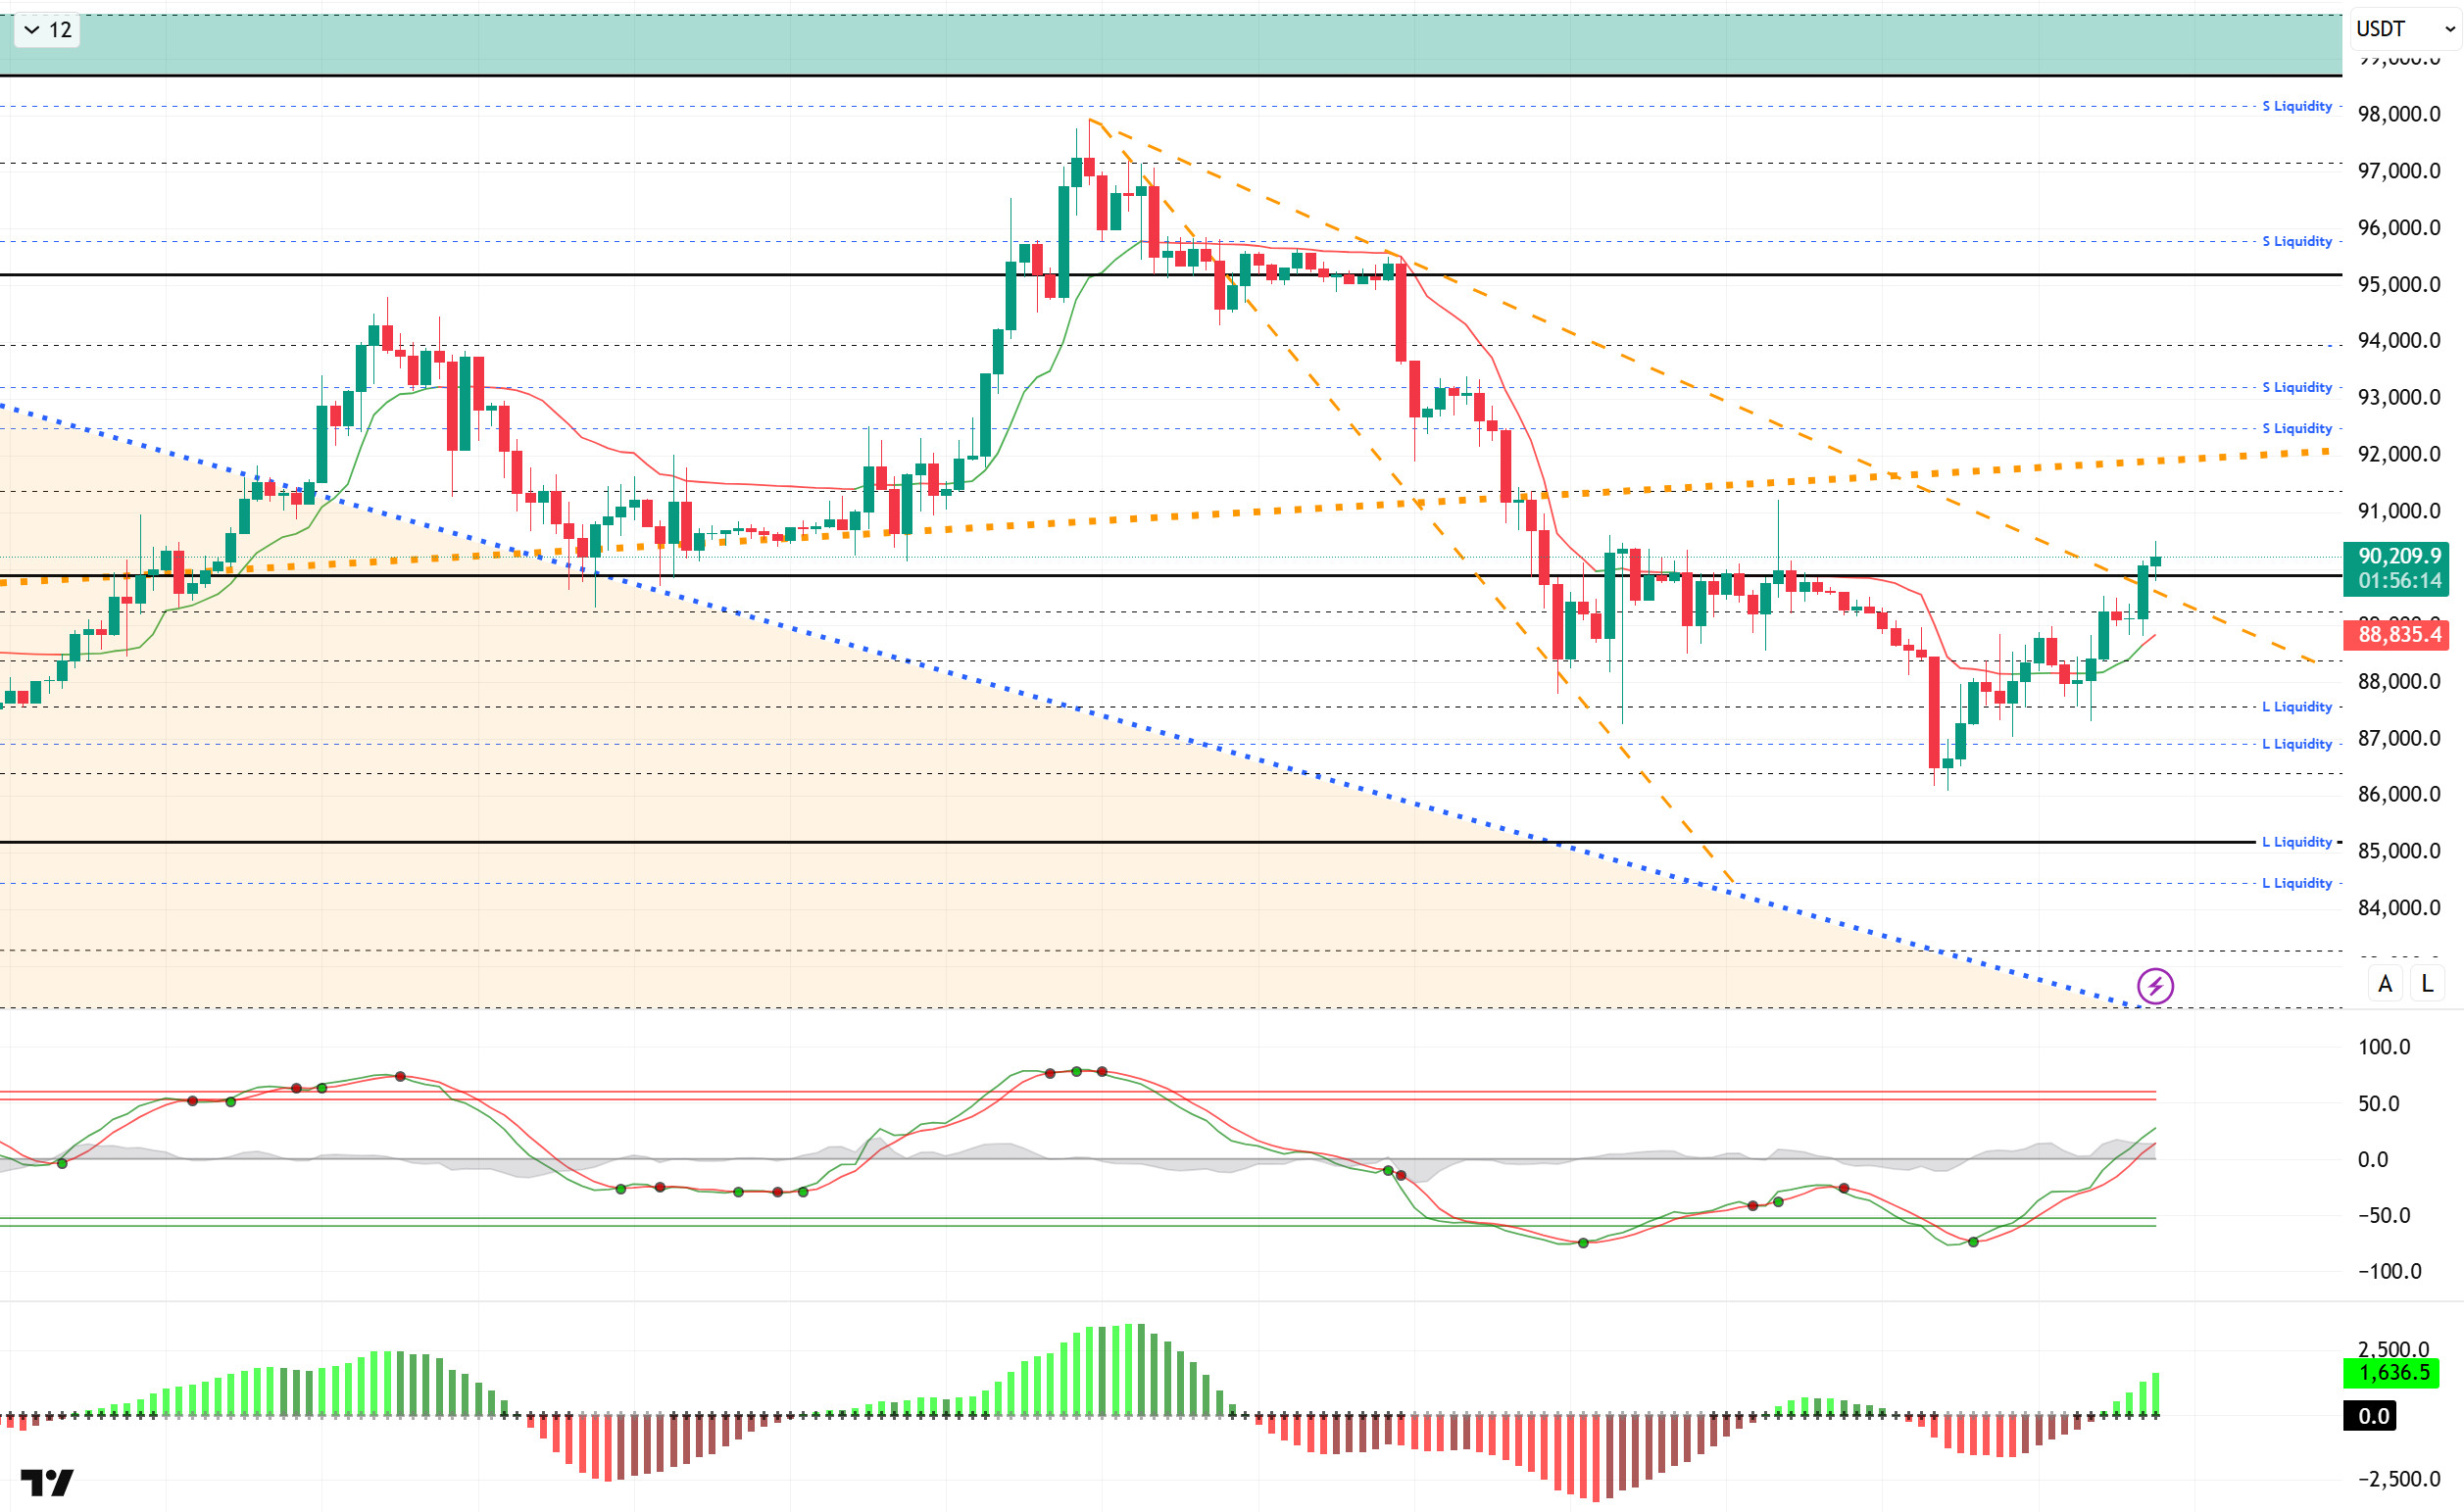
From a technical perspective, BTC had started to challenge the 90,000 level in the previous analysis. At the time of writing, the price has surpassed this level and reached 90,300. With this movement, the price broke the minor downtrend and closed above this level for four hours. In the next stage, the major uptrend line will be followed for the start of a new uptrend, and momentum may increase if this level is exceeded. While volatility is expected to increase with rising volume, attention should be paid to ensure that the breakouts are not fake.
Technical indicators show that the Wave Trend (WT) oscillator continues to sustain its buy signal, breaking above the channel’s middle band. The histogram on the Squeeze Momentum (SM) indicator has once again moved into positive territory. The Kaufman Moving Average (KAMA) is currently trading below the price level at $88.843.
When examining liquidation data, the buy level has once again gained intensity at the 86,000 – 87,000 level with the recent rise. In contrast, the selling level completely liquidated the concentration it had formed in the short term at the 88,000 – 89,000 band, while the next short-term liquidity area was liquidated at the 89,000 – 90,000 band. In the long term, positions above the 91,000 level continue to accumulate.
In summary, while the Fed remains the focus of the markets, interest rates are expected to remain unchanged. As negotiations continue regarding the US government shutdown, Trump’s comments on the dollar drew attention. In the Middle East, military exercises continue to escalate geopolitical tensions, while the use of cryptocurrency in Maduro’s funds is under investigation.Looking at liquidity data, the recent rise has once again intensified buying levels, while short-term trades continue to be targeted at selling levels. Technically, BTC started the new year with positive momentum, but after testing the 98,000 level, it fell back to the 86,000 level under renewed selling pressure following profit-taking at . The price, which lost the minor upward channel it had formed, confirmed the decline with the falling flag seen in its structure. From this point on, BTC, which recorded a recovery once again, surpassed the 90,000 level. If daily closes occur above this level, the 91,400 level, where the major uptrend line passes, will be followed by the 92,600 resistance. On the other hand, in the event of a potential new selling pressure, the 88,000–89,000 support band will be monitored.
Supports: 89,000 – 87,500 – 86,000
Resistances: 90,000 – 91,400 – 92,600
ETH/USDT
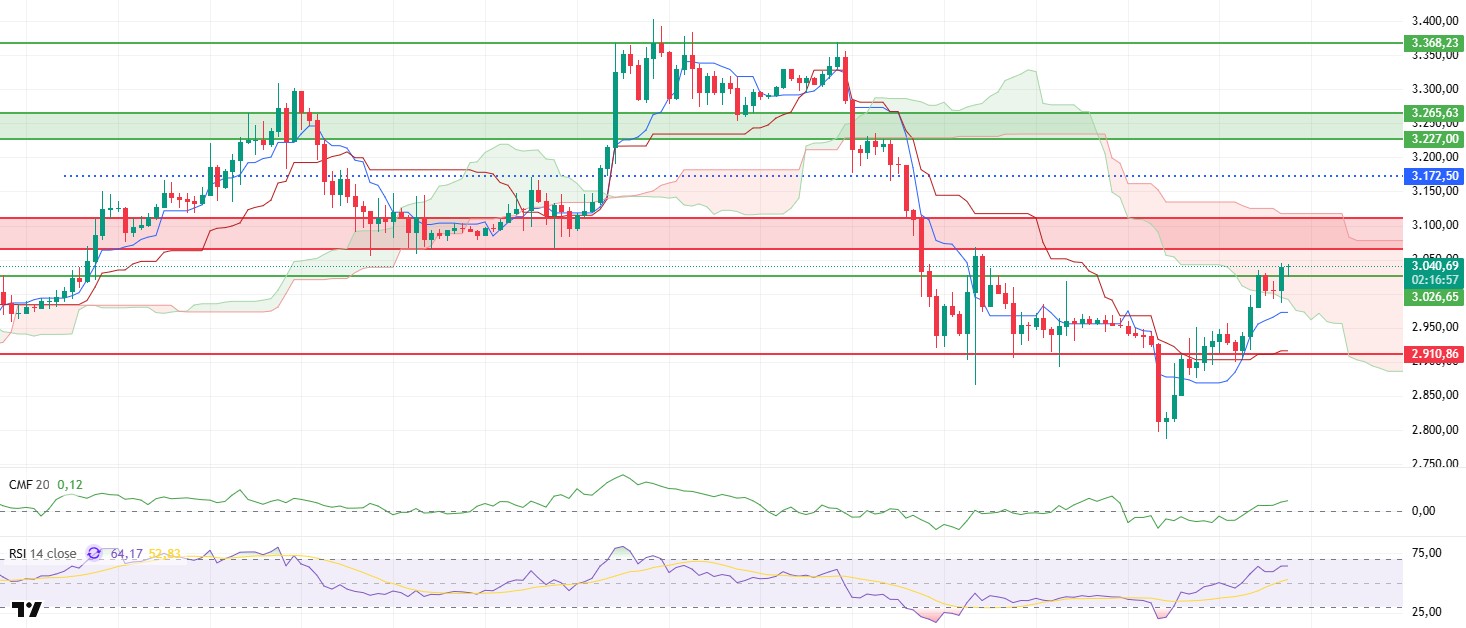
After breaking through the $3,026 resistance level during the day, the ETH price continued its upward movement and rose to $3,045. Although there was a pullback towards $3,026 after this level, the price held here and showed an upward trend again. The current pricing indicates that the uptrend has not yet lost momentum.
The liquidity picture is clearly strong. Chaikin Money Flow (CMF) is maintaining its upward movement in positive territory. The increase in money entering the market indicates that the rise is not merely a technical reaction and that it is also finding support on the spot side. As long as liquidity flows continue in this manner, upward price attempts can be expected to progress more smoothly.
On the momentum front, the outlook is leveling off. The Relative Strength Index (RSI) is following a calm course after the recent rise, and negative divergence still holds true. This structure indicates that the upward movement may slow down from time to time. For this divergence on the RSI side to disappear, it will be important for the price to clearly exceed the $3,066 level.
The technical outlook has not changed from the Ichimoku indicator perspective. The price continues to remain above the Tenkan and Kijun levels while moving within the kumo cloud. This structure supports the positive outlook in the short term, but for the main trend to be fully confirmed as strengthened, the upper band of the kumo cloud must also be broken.
In the overall assessment, the critical range remains between $3,000 and $3,026. As long as this region is maintained, the upward trend is likely to continue towards the $3,111 level. If sustainability is achieved above $3,111, the overall trend for ETH could shift back to a positive structure . Conversely, a loss of the $3,000 level would weaken the upward scenario and could lead to renewed downward pressure.
Supports: 3,026 – 2,910 – 2,727
Resistances: 3,111 – 3,227 – 3,368
XRP/USDT
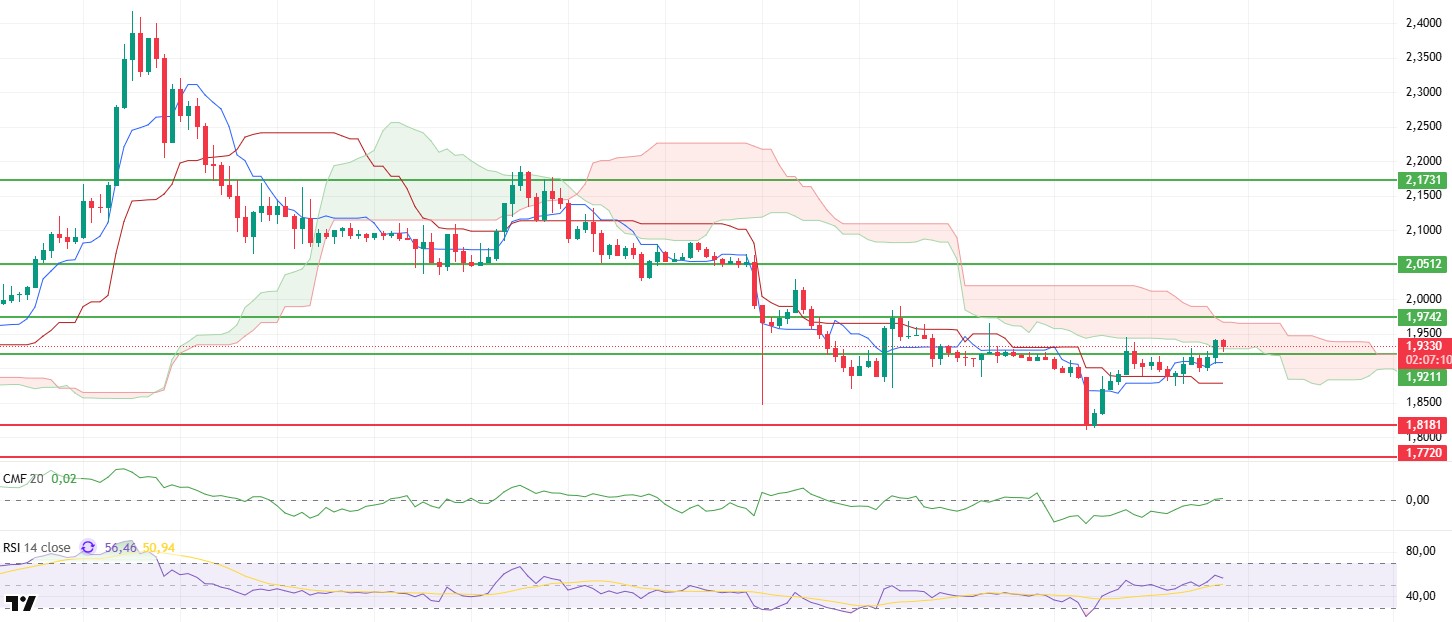
The XRP price managed to break through the key resistance level of $1.92 during the day and rose above the $1.93 level. The breakout above the challenging zone in the morning hours indicates that buyers are becoming more eager in the short term and that the price is beginning to find direction. At this stage, the price is attempting to hold above this band, and the $1.92 level has now become a critical equilibrium zone.
There is a significant change on the liquidity side. Chaikin Money Flow (CMF) has moved into positive territory after a long hiatus, signaling an acceleration in cash inflows into the market. This picture shows that the rise is not merely a technical rally and that it is also finding support on the spot side. Liquidity remaining in positive territory creates an important foundation for the continuation of upward movements.
The momentum front appears balanced. The Relative Strength Index (RSI) is moving sideways above the 50 level. This structure suggests that buyers have not completely lost control and that the price is not under severe downward pressure. Although there is no significant acceleration on the momentum front, the current level appears sufficient to maintain the uptrend.
On the technical side, the Ichimoku indicator is showing a positive signal. The price has entered the kumo cloud. This transition indicates that the short-term outlook has turned positive and downward pressure has weakened. Pricing above the Tenkan and Kijun levels also supports this structure.
In the overall assessment, the $1.92 level is now the main reference point. As long as it remains above this level, the price is expected to continue its attempts to rise towards the $1.97 level. However, if the $1.92 level is lost again, the short-term outlook could deteriorate rapidly, and sharp pullbacks could return. At present, the picture has turned positive in a controlled manner.
Supports: 1.9211 – 1.8181 – 1.7705
Resistances: 1.9742 – 2.0512 – 2.1731
SOL/USDT
WisdomTree Inc. integrated its tokenized funds into the Solana blockchain on January 28 via the WisdomTree Connect and WisdomTree Prime platforms.
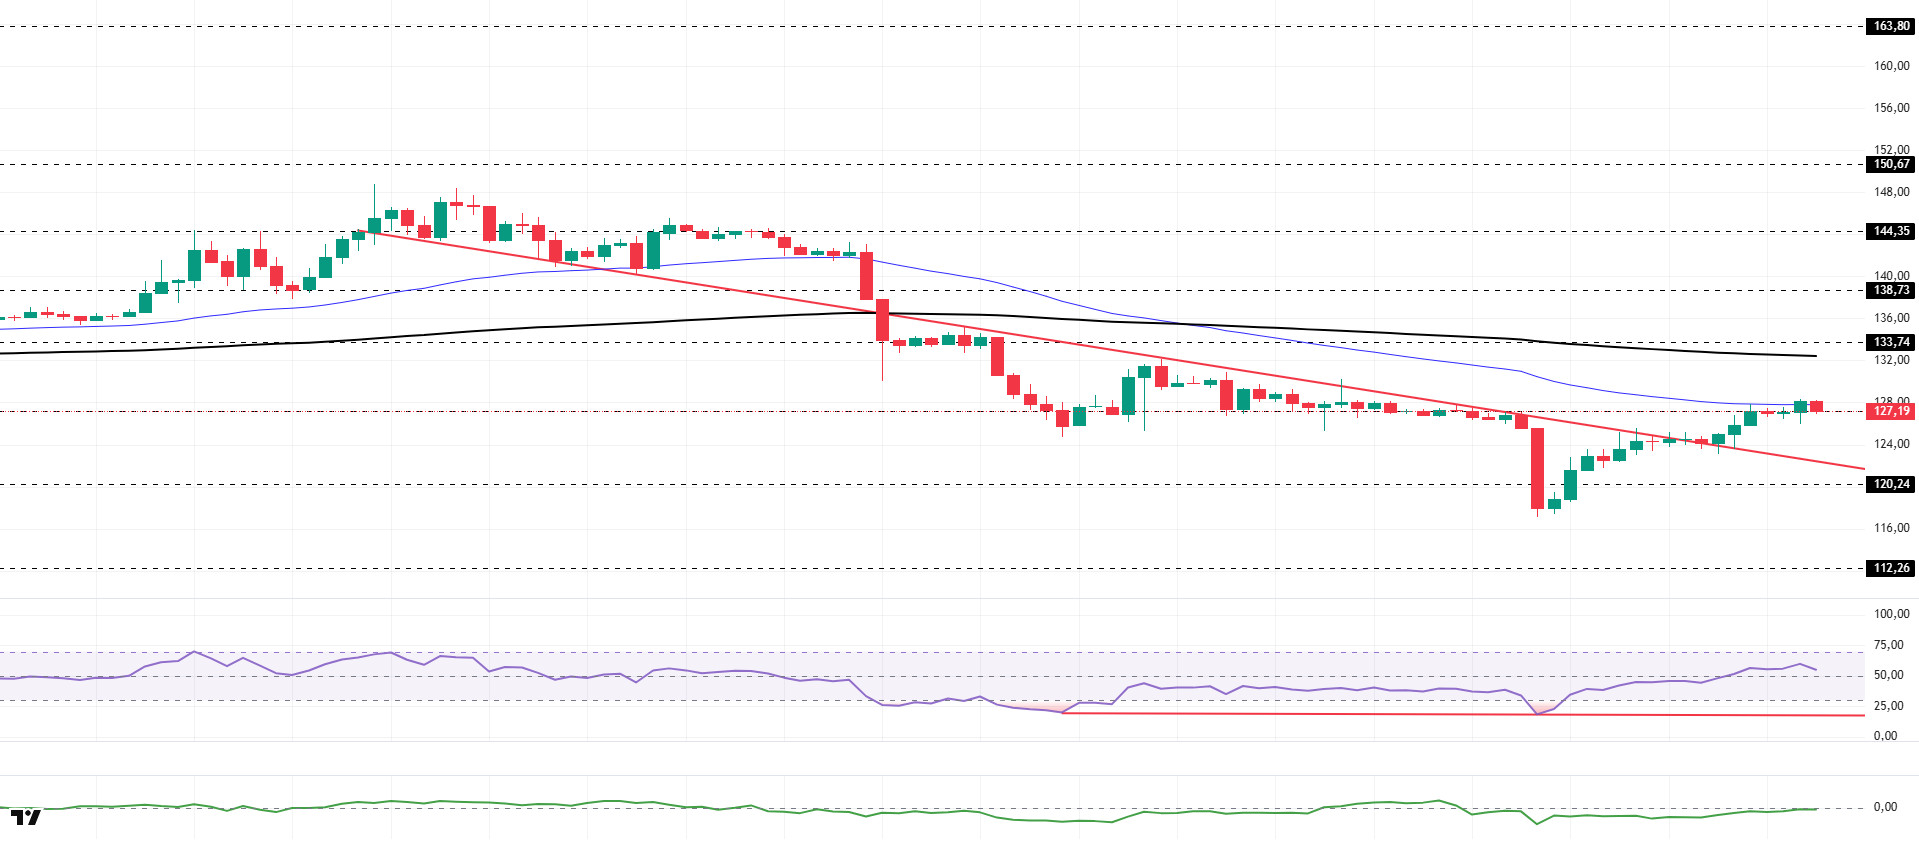
SOL price remained flat during the day. The asset continued to trade in the upper region of the downward trend that began on January 13, signaling sustained buying pressure. Testing the strong support level of $120.24, the asset gained momentum from there and experienced an uptrend. Currently testing the 50 EMA (Blue Line) moving average as resistance, the asset may test the 200 EMA (Black Line) moving average as resistance if the uptrend continues. In the event of a pullback, the downward trend should be monitored as support.
On the 4-hour chart, the 50 EMA (Exponential Moving Average – Blue Line) continues to be below the 200 EMA (Black Line). This indicates that a downtrend may begin in the medium term. At the same time, the price being below both moving averages shows that the asset is trending downward in the short term. The Chaikin Money Flow (CMF-20) rose from negative territory to neutral. However, the balance of money inflows and outflows may keep the CMF at this level. The Relative Strength Index (RSI-14) rose from near neutral in negative territory to the middle of positive territory. At the same time, it continued to remain in the upper region of the upward trend that began on January 20. This signaled the formation of buying pressure. If there is an increase due to macroeconomic data or positive news related to the Solana ecosystem, the $150.67 level stands out as a strong resistance point. If this level is broken upwards, the increase is expected to continue. If there are pullbacks due to developments in the opposite direction or profit-taking, it could test the $112.26 level. A decline to these support levels could increase buying momentum, presenting a potential opportunity for an uptrend.
Supports: 127.21 – 120.24 – 112.26
Resistances: 133.74 – 138.73 – 144.35
DOGE/USDT
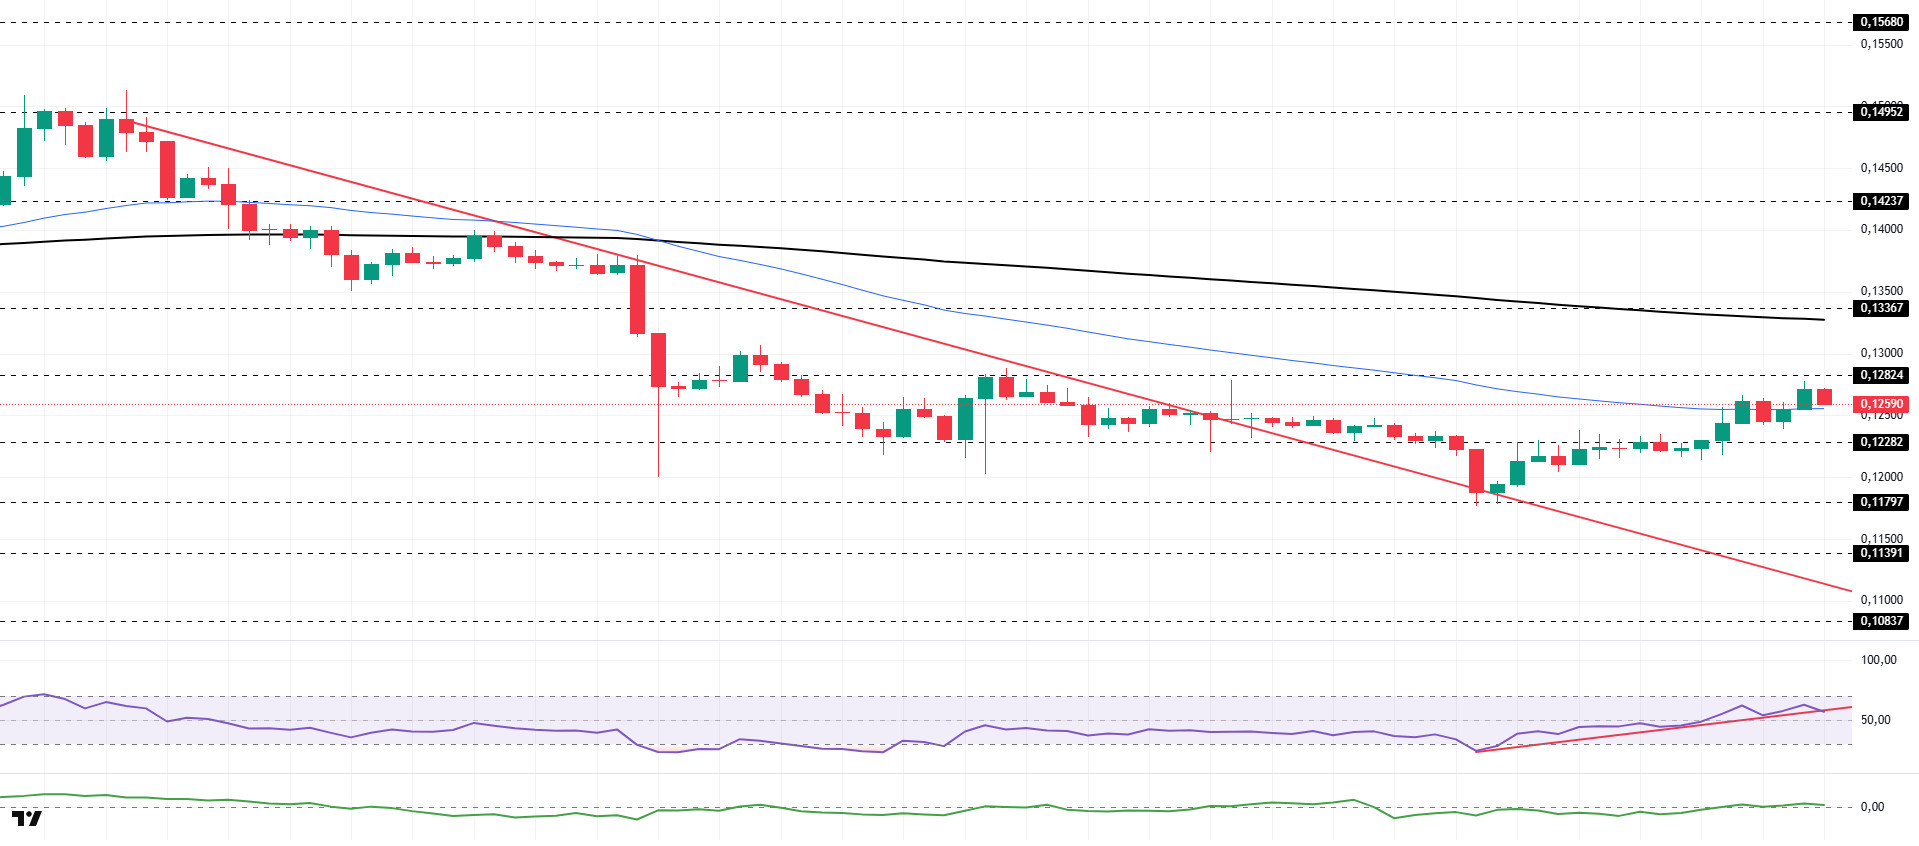
The DOGE price experienced a slight increase during the day. The asset remained in the upper region of the downward trend that began on January 14, indicating buying pressure. Breaking above the strong resistance level of $0.12282, the asset is currently testing the 50 EMA (Blue Line) moving average as support. If it manages to hold above this level, the 200 EMA (Black Line) moving average could act as a resistance level. In the event of a pullback, it could test the $0.12282 level as a support level.
On the 4-hour chart, the 50 EMA (Exponential Moving Average – Blue Line) remained below the 200 EMA (Black Line). This indicated that a medium-term downtrend was forming. The price being below both moving averages suggests that the price may be inclined to fall in the short term. Chaikin Money Flow (CMF-20) remained in positive territory. Additionally, a decrease in cash inflows could pull the CMF back into negative territory. The Relative Strength Index (RSI-14) rose from near the neutral level in the negative zone to the mid-level in the positive zone. It also continued to remain in the upper region of the line that began on January 25 and is currently testing this line as support. A break below this level could increase selling pressure. In the event of an uptrend driven by political developments, macroeconomic data, or positive news flow in the DOGE ecosystem, the $0.13367 level stands out as a strong resistance zone. Conversely, in the event of negative news flow, the $0.11391 level could be triggered. A decline to these levels could increase momentum and initiate a new wave of growth.
Supports: 0.12282 – 0.11797 – 0.11391
Resistances: 0.12824 – 0.13367 – 0.14237
TRX/USDT
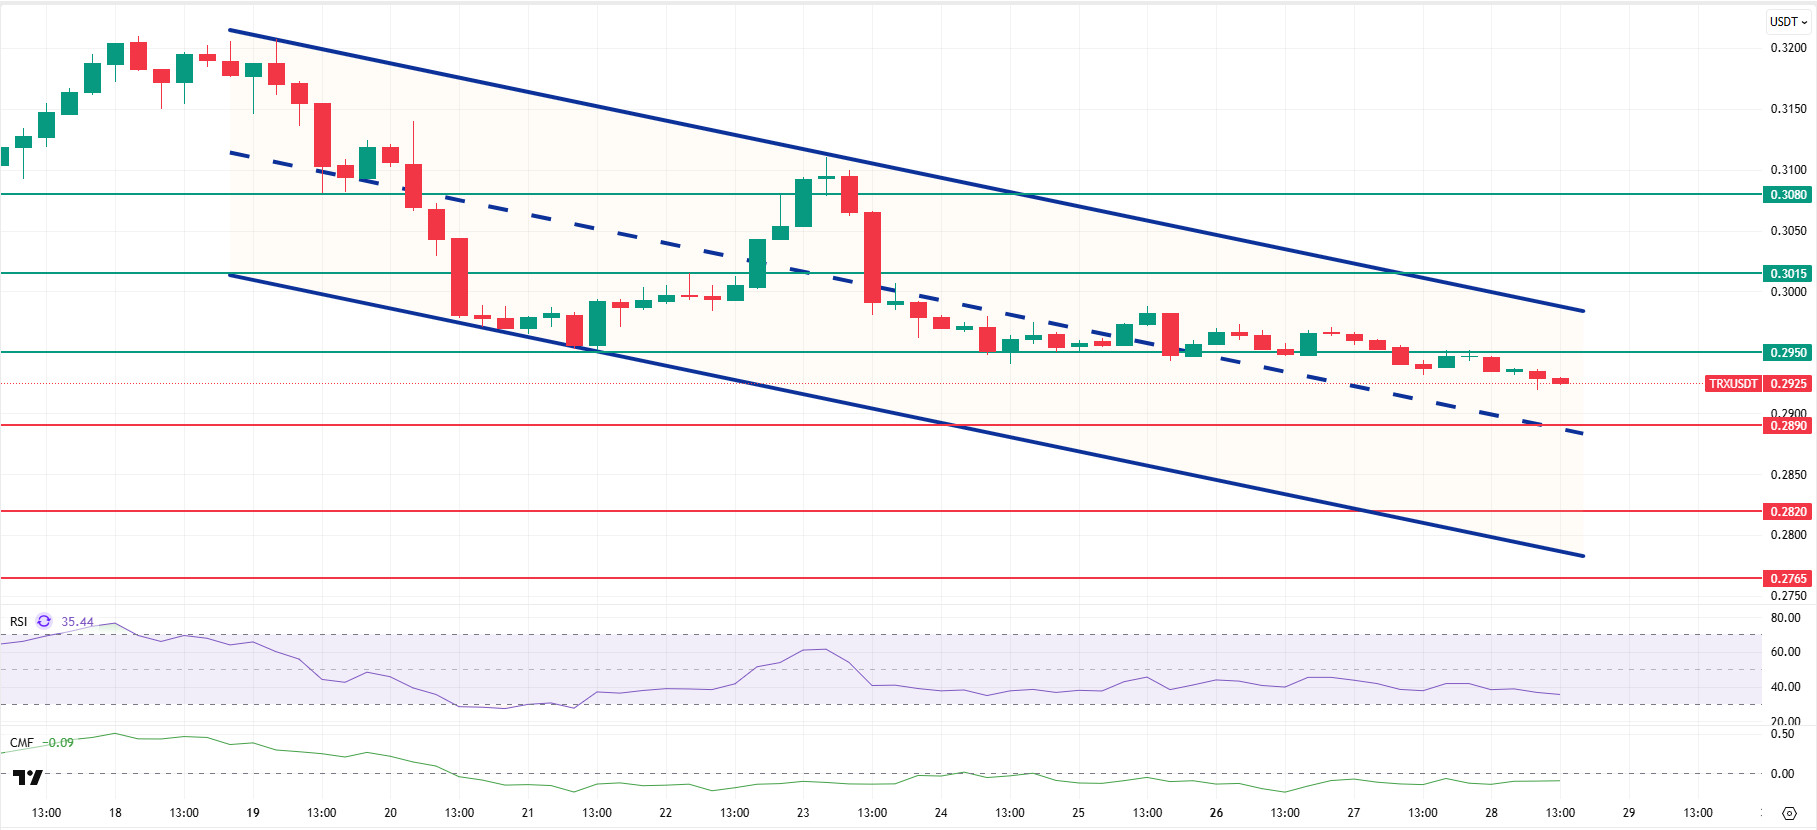
Following the pullback highlighted in this morning’s analysis, TRX continues to hold above the 0.2890 support level and is currently trading at 0.2925. Currently just above the middle band of the bearish channel, TRX is hovering near the 0.2950 resistance level on the 4-hour chart. The Relative Strength Index (RSI) value is seen to be very close to the oversold zone at 35. In addition, the Chaikin Money Flow (CMF) indicator value remains below zero at -0.09, indicating continued money outflows. The CMF’s persistence in the negative zone signals that downward pressure on the price may increase.
In light of all these indicators, TRX may decline further in the second half of the day, moving towards the lower band of the bearish channel. In such a scenario, it may test the 0.2890 support level. It may continue its decline with a candlestick close below the 0.2890 support level and may test the 0.2820 support level. If there is no candlestick close below the 0.2890 support level and the CMF moves into positive territory, cash inflows may gain strength and the price may test the 0.2950 resistance level after a possible rise.
On the 4-hour chart, 0.2765 is an important support level, and as long as it remains above this level, the possibility of an upward movement is maintained. If this support is broken, selling pressure may increase.
Supports: 0.2890 – 0.2820 – 0.2765
Resistances: 0.2950 – 0.3015 – 0.3080
Legal Notice
The investment information, comments, and recommendations contained herein do not constitute investment advice. Investment advisory services are provided individually by authorized institutions taking into account the risk and return preferences of individuals. The comments and recommendations contained herein are of a general nature. These recommendations may not be suitable for your financial situation and risk and return preferences. Therefore, making an investment decision based solely on the information contained herein may not produce results in line with your expectations.

