
Active Addresses
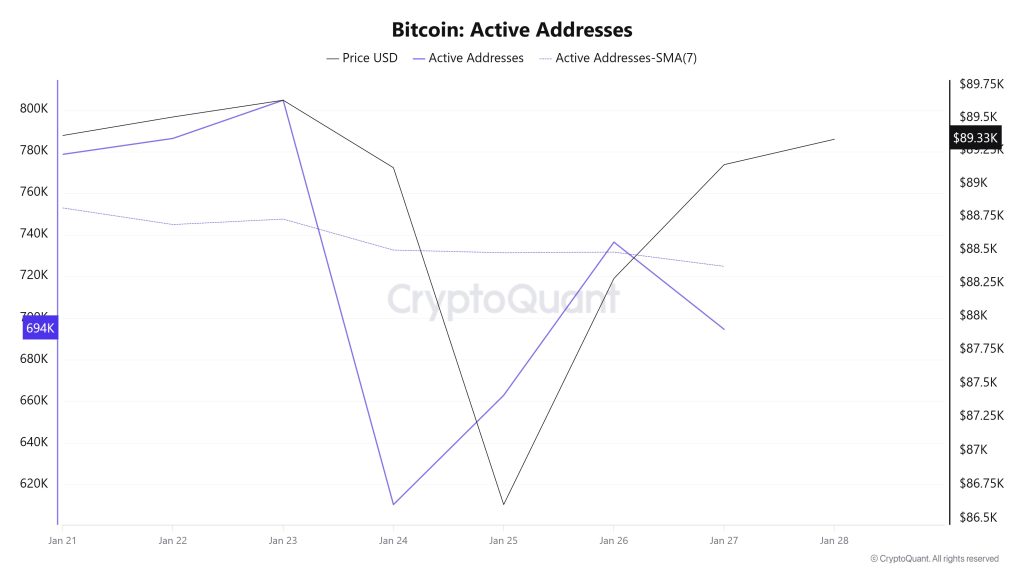
Between January 21 and January 28, recorded 804,588 active addresses on the Bitcoin network. During this period, Bitcoin’s price fell from $89,000 at the beginning of the week to $86,000 on January 24. From a technical perspective, the 7-day simple moving average (SMA) shows a downward trend.
Active Sending Addresses
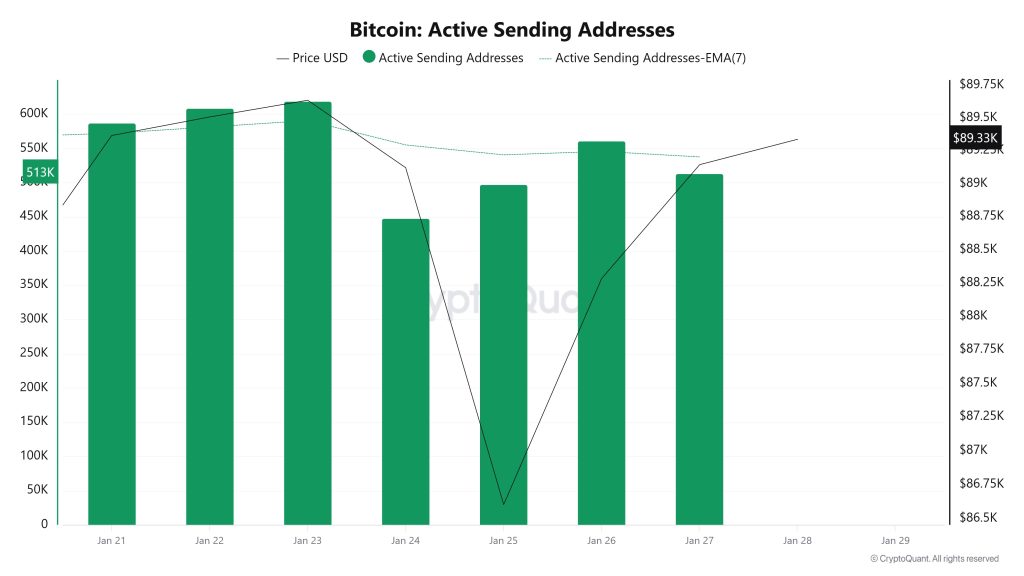
Between January 21 and January 28, an upward trend was observed in the active sending addresses metric. On the day the price reached its highest level, this metric stood at 619,017, indicating that user activity on the Bitcoin network was moving in parallel with the price. This data shows that the $89,000 level is supported not only by price but also by on-chain address activity. Overall, the Active Sending Addresses metric has followed a high trajectory during this period.
Active Receiving Addresses
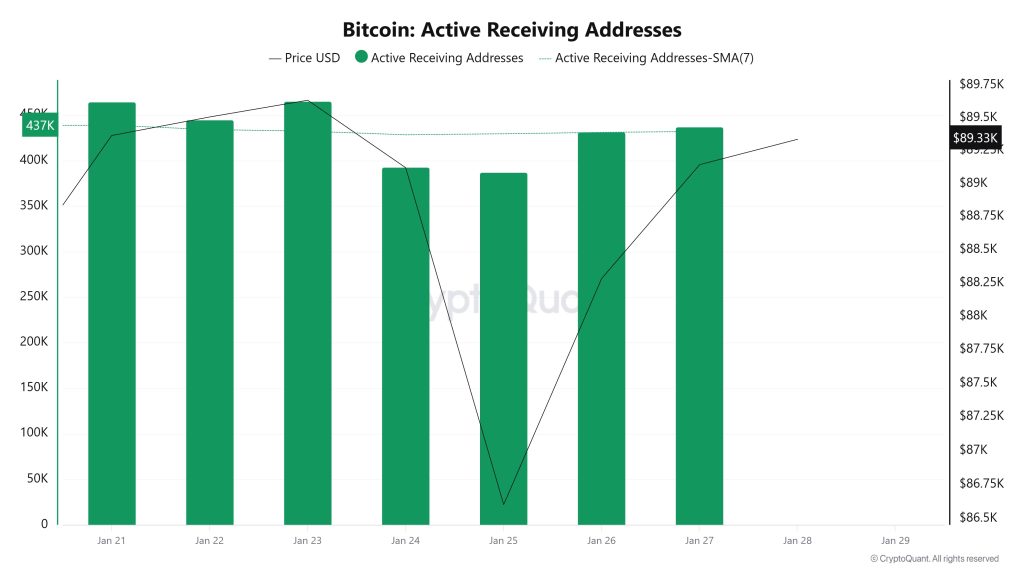
Between January 21 and January 28, active receiving addresses experienced a typical rise alongside the Black Line (price line). On the day the price reached its peak, active receiving addresses rose to 465,253 levels, indicating that buyers acquired Bitcoin at around the $89,000 level.
Breakdowns
MVRV
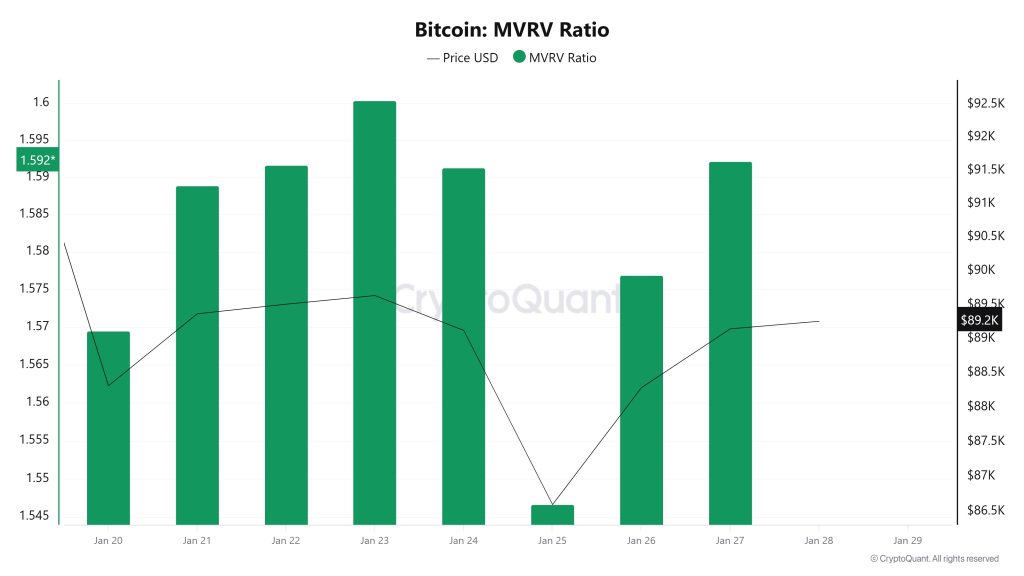
On January 21, while the Bitcoin price was trading at $89,365, the MVRV Ratio was at 1.588. As of January 27, the Bitcoin price fell to $89,144, recording a limited decline of 0.25%, while the MVRV Ratio rose to 1.592, recording an increase of 0.25%. The MVRV Ratio’s near-flat trajectory indicates that there has been no significant narrowing in the price premium relative to the realized cost basis this week and that unrealized profits have rebalanced. This outlook may signal that downward pressure has slowed in the short term.
Realized Price
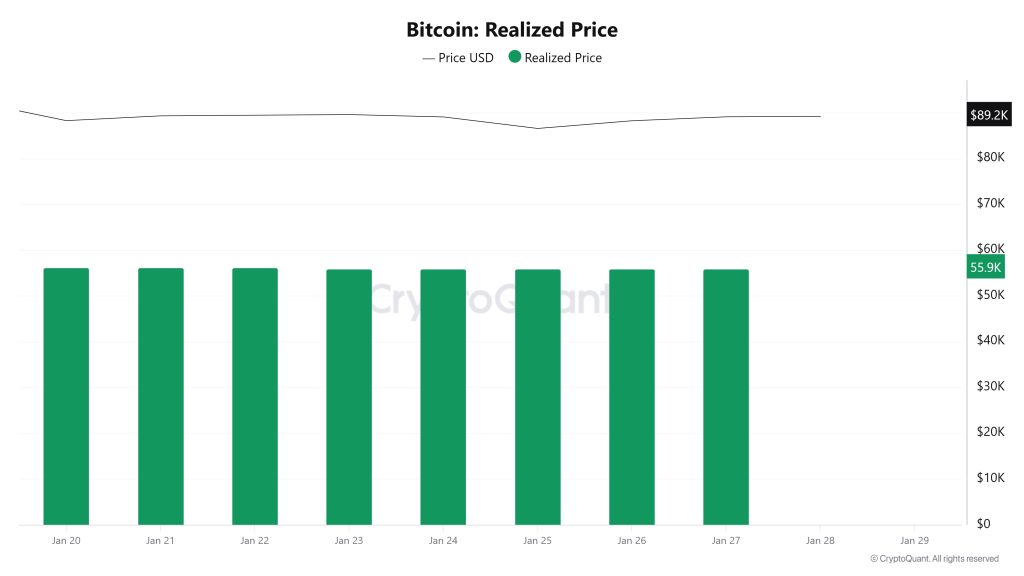
On January 21, while the Bitcoin price traded at $89,365, the Realized Price was at $56,243. As of January 27, the Bitcoin price fell to $89,144, recording a 0.25% decline, while the Realized Price fell to $55,990, recording a 0.45% decline. The pullback in the Realized Price indicates a limited downward adjustment in the network’s average cost base, showing that the spot price’s premium over the cost base has narrowed somewhat despite being preserved. This picture suggests that the pullback has not turned into a sharp cost disruption across the network, but that the cost base has also accompanied it slightly downward this time.
Spent Output Profit Ratio (SOPR)
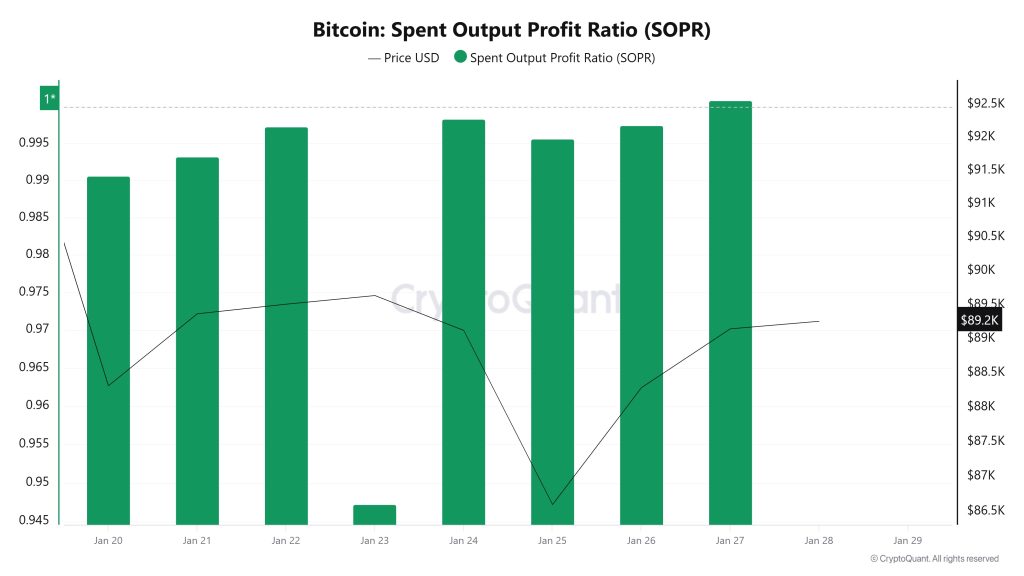
On January 21, while the Bitcoin price was trading at $89,365, the SOPR metric was at 0.993. As of January 27, the Bitcoin price fell to $89,144, recording a 0.25% decline, while the SOPR metric rose to 1.000, recording a 0.70% increase. The return of SOPR to the 1 level indicates that spent coins are approaching break-even on average and that the weight of loss-making transactions has decreased. This outlook may signal that selling pressure has eased in the short term and that recovery attempts may proceed on less fragile ground compared to the previous week.
Derivatives
Open Interest
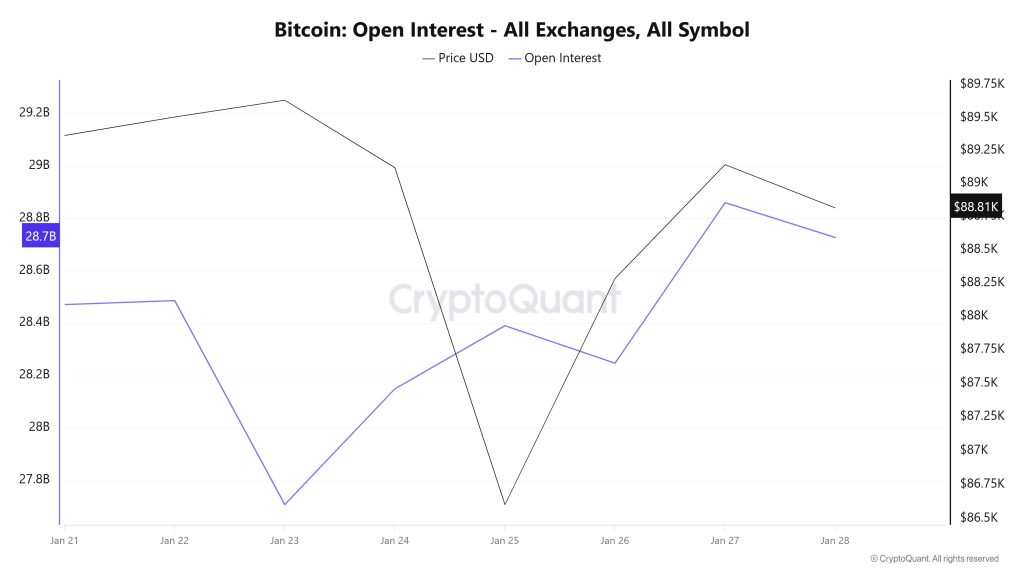
The BTC price experienced a decline as of 23 January, falling to the $86,000 level. Although there was a slight pullback in open interest, it quickly recovered and reached the $28.4 billion level again. In the following days, open interest increased alongside the rise in the BTC price, reaching $28.7 billion. This outlook suggests that traders’ appetite has not waned and that buyer demand remains active.
Funding Rate
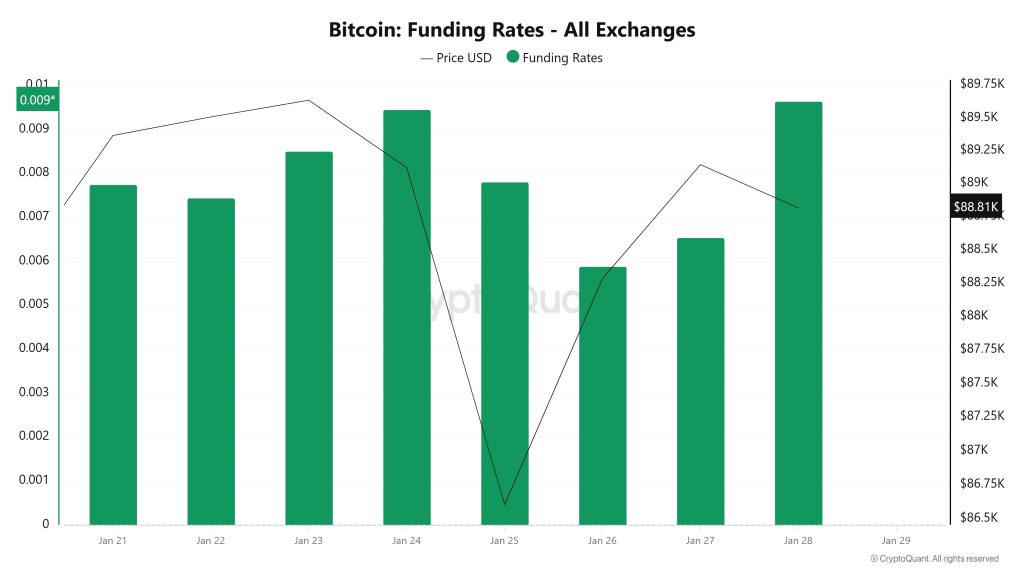
The chart shows that BTC open interest was on an upward trend between January 21 and 24, with leveraged long positions increasing. A sharp decline in open interest on January 25 indicates a strong position unwinding in the market.
The subsequent recovery in open interest, accompanied by the price, indicates that long appetite has returned. However, the volatile structure in the last section suggests that the market remains fragile after the rise and that a cautious stance persists.
Long & Short Liquidations
Last week, the BTC price fell from the $88,000 level to the $86,000 level. As a result, a total of $683 million in long positions were liquidated, while $223 million in short positions were liquidated.
| Date | Long Amount (Million $) | Short Amount (Million $) |
|---|---|---|
| January 21 | 220.08 | 154.08 |
| January 22 | 180.68 | 5.15 |
| January 23 | 16.68 | 18.79 |
| January 24 | 1.35 | 0.38 |
| January 25 | 243.33 | 2.85 |
| January 26 | 12.21 | 20.02 |
| January 27 | 9:33 | 10:50 |
| Total | 683.66 | 223.77 |
Supply Distribution
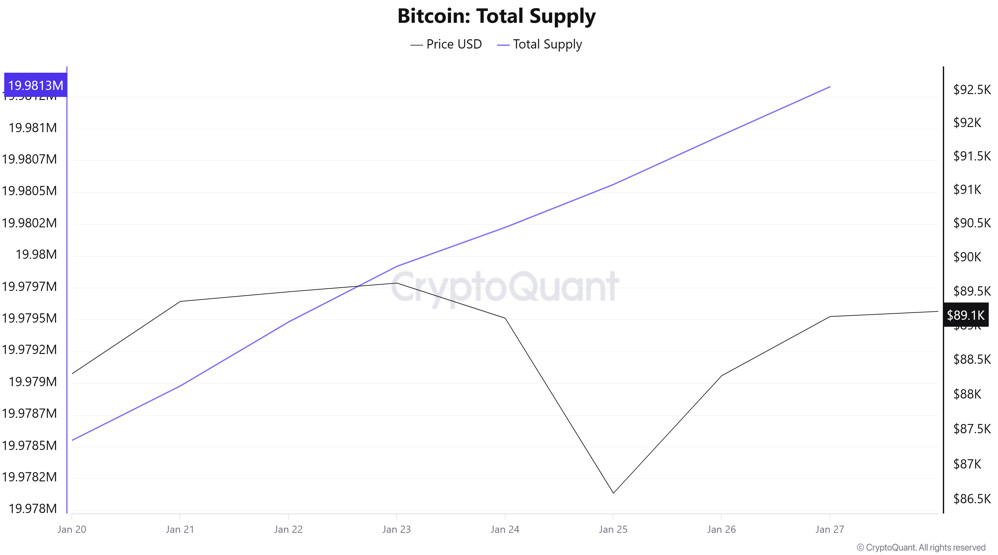
Total Supply: Reached 19,981,330 units, an increase of approximately 0.0089% compared to last week.
New Supply: The amount of BTC produced this week was 1,781.
Velocity: The velocity, which was 12.32 last week, remained at the same level as of January 27.
| Wallet Category | January 20, 2025 | January 27, 2025 | Change (%) |
|---|---|---|---|
| < 1 BTC | 8.4565% | 8.4592% | 0.0319% |
| 1 – 10 BTC | 11.2870% | 11.2931% | 0.0541% |
| 10 – 100 BTC | 22.8721% | 22.8814% | 0.0407% |
| 100 – 1k BTC | 28.4796% | 28.3403% | −0.4892% |
| 1k – 10k BTC | 21.1518% | 21.1791% | 0.1291% |
| 10k+ BTC | 7.7525% | 7.8465% | 1.2120% |
The very limited increase in the <1 BTC and 1–10 BTC groups indicates that retail investors remain cautious but have not completely withdrawn. The small increase in the 10–100 BTC band points to gradual accumulation in this segment. In contrast, the significant decline in the 100–1,000 BTC group suggests a reduction/distribution of positions in mid-sized wallets. The increase in the 1k–10k BTC and especially the 10k+ BTC segments highlights a trend of strengthening/concentration rather than a clear exit from large wallets.
Exchange Supply Ratio
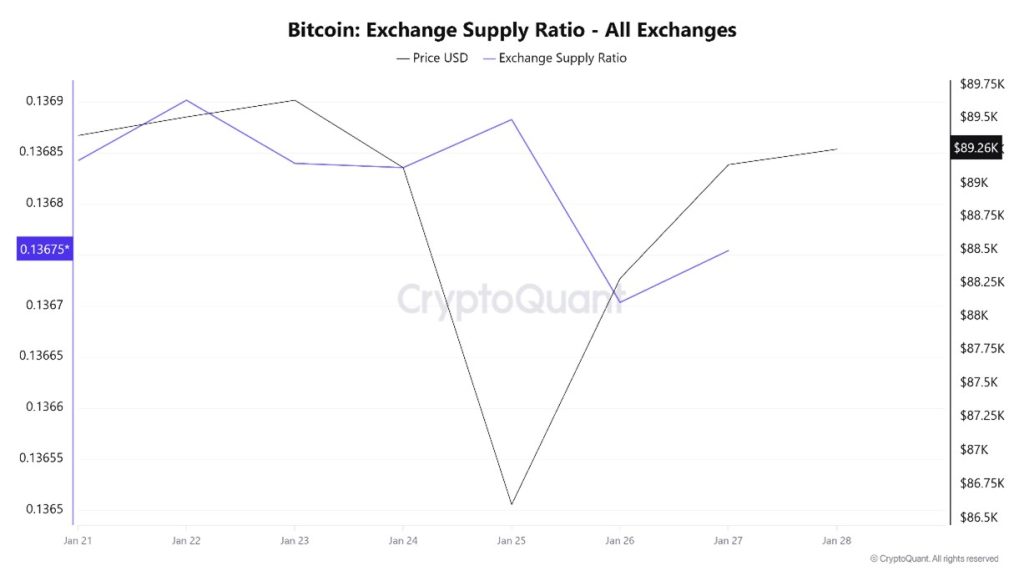
According to Bitcoin Exchange Supply Ratio data, a gradual decline in the Bitcoin supply ratio held on exchanges was observed throughout the week under review. This week, a positive correlation between the Bitcoin price and the supply ratio on exchanges was dominant. The decline in the Exchange Supply Ratio indicates that Bitcoins are being withdrawn from exchanges and held in cold wallets, and that selling pressure remains limited in the short term. Between January 21 and January 28, the Bitcoin Exchange Supply Ratio declined slightly from approximately 0.136842 to 0.136815. During the same period, the Bitcoin price retreated from the $89,000 level to the $86,000 range.
The fact that both the price and the Exchange Supply Ratio moved downwards in the same direction during this period indicates that risk appetite among market participants has weakened and that new Bitcoin inflows into exchanges have remained limited.
Exchange Reserve
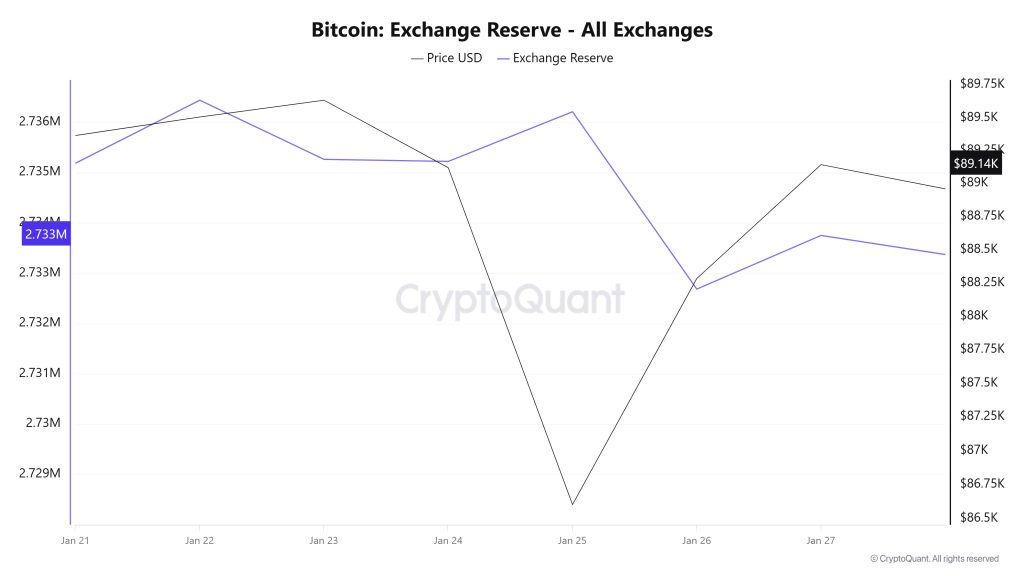
Between January 21 and 27, 2026, Bitcoin reserves on exchanges rose from 2,728,402 BTC to 2,733,752 BTC, resulting in a net inflow of 5,350 BTC. During this period, exchange reserves increased by approximately 0.20%, while the BTC price rose from $88,328 to $89,144, experiencing a 0.92% increase in value. The increase in exchange reserves during this period of rising prices indicates that investors were cautious at these levels and viewed the rise as a partial selling opportunity. Price movements may remain limited and volatile in the short term. The increase in exchange reserves indicates a rise in selling liquidity, while the price remaining upward shows that demand has not completely weakened.
| Date | 21-Jan | 22-Jan | 23-Jan | 24-Jan | Jan 25 | Jan 26 | Jan 27 |
|---|---|---|---|---|---|---|---|
| Exchange Inflow | 42,684 | 30,107 | 22,904 | 6,354 | 11,600 | 25,379 | 16,620 |
| Exchange Outflow | 35,898 | 28,855 | 24,080 | 6,395 | 10,613 | 28,904 | 15,554 |
| Exchange Netflow | 6,786 | 1,252 | -1,176 | -41 | 987 | -3,525 | 1,066 |
| Exchange Reserve | 2,728,402 | 2,736,440 | 2,735,265 | 2,735,224 | 2,736,211 | 2,732,686 | 2,733,752 |
| BTC Price | 88,328 | 89,507 | 89,634 | 89,121 | 86,602 | 88,285 | 89,144 |
Fees and Revenues
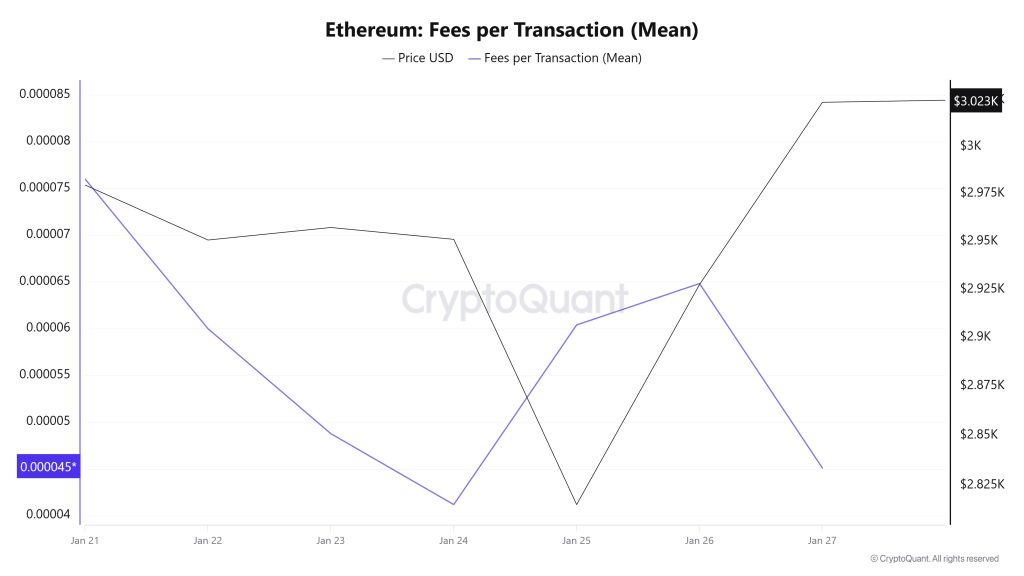
When examining the Bitcoin Fees per Transaction (Mean) data for the period between January 21 and 27, it is observed that on January 21, the first day of the week, the indicator stood at 0.00000627.
A decline was observed until January 22, when the indicator recorded the week’s lowest value at 0.00000493.
In this context, as a result of the increase in Bitcoin price volatility as of January 22, the indicator regained momentum and followed a positive trend due to the impact of price volatility.
On January 27, the last day of the weekly period, the indicator closed the week at 0.00000636 .
Bitcoin: Fees (Total)
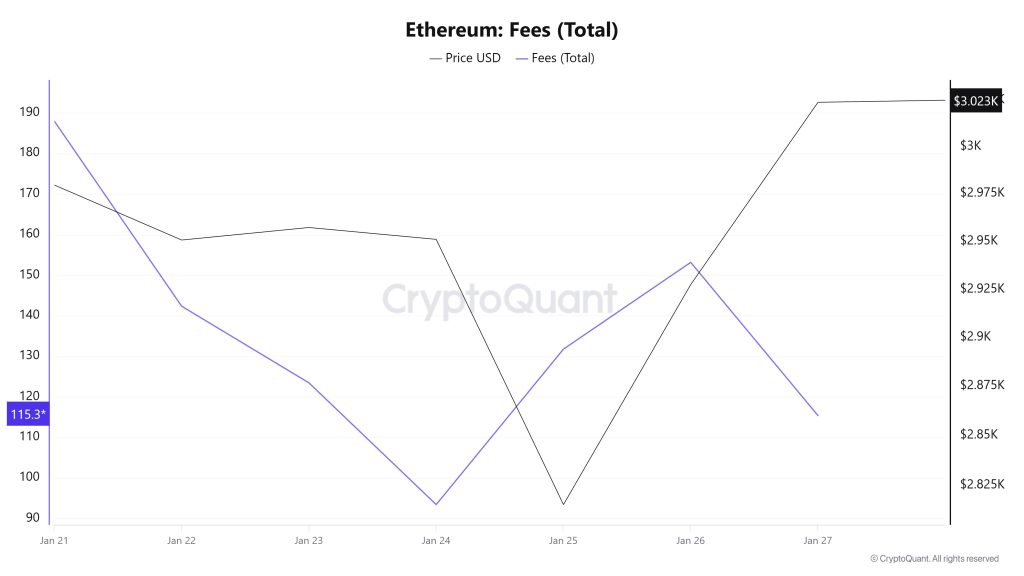
Similarly, when examining the Bitcoin Fees (Total) data for the period between January 21 and 27, it is observed that the indicator reached 2.68551253 on January 21, the first day of the week.
A decline was observed until January 25, and on that date, the indicator recorded the week’s lowest value at 1.92790523.
In this context, as a result of the increase in Bitcoin price volatility as of January 25, the indicator regained momentum and followed a positive trend due to the impact of price volatility.
On January 27, the last day of the weekly period, the indicator closed the week at 2.30411534.
Miner Flows
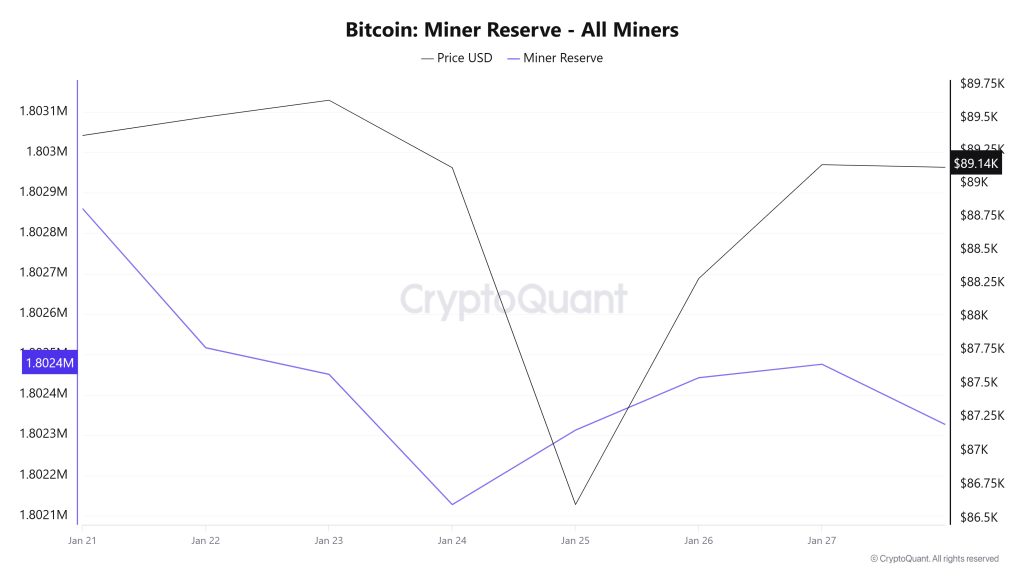
According to data obtained from the Miner Reserve table, a slight decrease in Bitcoin reserves held in miners’ wallets was observed this week. A time-dependent correlation structure between the Bitcoin price and miner reserve was observed during the period under review. However, the general trend shows that a positive correlation between these two variables is dominant.
Miner Inflow, Outflow, and Netflow
Between January 21 and 27, 43,510 Bitcoin flowed out of miners’ wallets, while 42,856 Bitcoin flowed into miner wallets during the same period. This week’s Miner Netflow was -654 Bitcoin. Meanwhile, the Bitcoin price was $89,365 on January 21 and $89,144 on January 27.
Throughout the week, Bitcoin inflows into miner wallets (Miner Inflow) were less than Bitcoin outflows from miner wallets (Miner Outflow), resulting in a negative net flow (Miner Netflow).
| Date | Jan. 21 | Jan. 22 | Jan. 23 | Jan. 24 | Jan. 25 | Jan. 26 | Jan. 27 |
|---|---|---|---|---|---|---|---|
| Miner Inflow | 10,383.89 | 6,196.68 | 6,339.57 | 2,044.36 | 3,552.22 | 7,475.94 | 6,863.49 |
| Miner Outflow | 10,652.19 | 6,541.17 | 6,405.35 | 2,366.73 | 3,367.82 | 7,346.37 | 6,830.13 |
| Miner Netflow | -268.30 | -344.49 | -65.77 | -322.37 | 184.41 | 129.57 | 33.37 |
Whale Activities
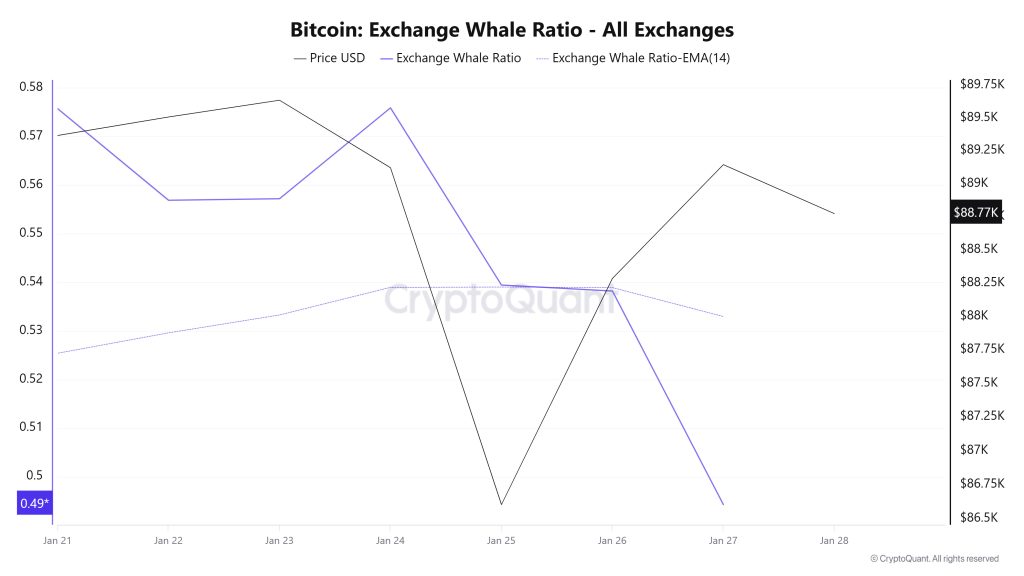
Whale Data:
Looking at whale activity on centralized exchanges over the past 7 days based on cryptocurrency market data, we see a decline from start to finish. This indicates a decrease in activity on these centralized exchanges. Looking at the Exchange Whale Ratio metric, on January 21, the first day of the 7-day period, the ratio of whales using centralized exchanges was 0.575, which was the peak of the process. When this ratio is above the 0.35-0.45 band, it usually means that whales frequently use centralized exchanges. Currently at 0.494, the metric marks the lowest point of the process, coinciding with the time when whales began to pull back, even though they continued to use centralized exchanges intensively throughout the ongoing process. During this process, the price fluctuated between the $89,500 and $86,000 levels. This indicates that there is a balance in the buying and selling competition among whales on centralized exchanges. At the same time, the total BTC transfer shows a decrease of approximately 8% compared to last week, with 4,921,247 BTC moving. The data shows that wallets holding at least 1,000 BTC have accumulated more than 100,000 bitcoins recently. The assets held by new whales exceeded 100,000, reaching a value of approximately $12 billion. As a result, whales continuing to accumulate BTC and the continued decline in the value of using centralized exchanges could strengthen the upward movement.
BTC Onchain Overall
| Metric | Positive 📈 | Negative 📉 | Neutral ➖ |
|---|---|---|---|
| Active Addresses | ✓ | ||
| Breakdowns | ✓ | ||
| Derivatives | ✓ | ||
| Supply Distribution | ✓ | ||
| Exchange Supply Ratio | ✓ | ||
| Exchange Reserve | ✓ | ||
| Fees and Revenues | ✓ | ||
| Miner Flows | ✓ | ||
| Whale Activities | ✓ |
*The metrics and guidance provided in the table do not alone explain or imply any expectation regarding future price changes for any asset. Digital asset prices can fluctuate based on numerous variables. The on-chain analysis and related guidance are intended to assist investors in their decision-making process, and basing financial investments solely on this analysis may lead to unfavorable outcomes. Even if all metrics simultaneously produce positive, negative, or neutral results, the expected outcomes may not materialize depending on market conditions. It would be beneficial for investors reviewing the report to take these warnings into consideration.
Legal Notice
The investment information, comments, and recommendations contained in this document do not constitute investment advisory services. Investment advisory services are provided by authorized institutions on a personal basis, taking into account the risk and return preferences of individuals. The comments and recommendations contained in this document are of a general nature. These recommendations may not be suitable for your financial situation and risk and return preferences. Therefore, making an investment decision based solely on the information contained in this document may not result in outcomes that align with your expectations.
NOTE: All data used in Bitcoin on-chain analysis is based on CryptoQuant.
