
Crypto Insight
| Market Overview | Current Value | Change (30d) |
|---|---|---|
| Bitcoin Price | 82,591 $ | -6.56 📉 |
| Ethereum Price | 2,728 $ | -8.03 📉 |
| Bitcoin Dominance | 59.33% | -0.59 📉 |
| Ethereum Dominance | 11.84% | -2.27 📉 |
| Tether Dominance | 6.67% | +5.47 📈 |
| Crypto Total Market Cap | $ 2.78 T | -6.01 📉 |
| Fear and Greed Index | Extreme Fear (16) | Extreme Fear (21) |
| Altcoin Season Index | 33 / 100 | 20 / 100 |
| Total Crypto ETFs Net Flow | $55.88 B | — |
| Open Interest – Perpetuals | $ 629.94 B | — |
| Open Interest – Futures | $ 3.4 B | — |
*Prepared on January 30, 2026, at 6:26 a.m. (UTC)
Crypto Market Metrics – Summary of January
| Asset | 1st Week | 2nd Week | 3rd Week | 4th Week | Net Total $ (m) |
|---|---|---|---|---|---|
| Bitcoin (BTC) | 512 | -404.7 | 1,551 | -1,089 | 107,762 |
| Ethereum (ETH) | 119.1 | -116.1 | 496.8 | -630.3 | -130.5 |
| XRP (Ripple) | 10.7 | 45.8 | 69.5 | -18.2 | 107.8 |
| Solana (SOL) | -30.2 | 32.8 | 45.5 | 17.1 | 65.2 |
| Litecoin (LTC) | – | – | 2.3 | 0.3 | 2.6 |
| Cardano (ADA) | – | – | – | 0.3 | 0.3 |
| SUI | 0.5 | 7.6 | 5.7 | -6.0 | 7.8 |
| Others | 0.6 | 7.2 | 13.9 | 6.0 | 27.7 |
In January, inflows into digital assets were observed to be weak. While no outflows were observed for Bitcoin, inflows of $107.762 million were seen. Ethereum experienced a net outflow of $130.5 million. Ripple stood out with $107.8 million in inflows. Inflows continued in Solana, while Litecoin remained weak. Cardano experienced weakness in inflows at 0.3. Other coins saw inflows of $27.7 million.
Crypto Total Market Cap
The cryptocurrency market gained approximately $60.7 billion in value this month, achieving a 2.07% increase in total market capitalization. With this recovery, the market capitalization reached $3 trillion. Although the market capitalization reached a record high of $3.29 trillion during the month, it was not able to maintain this level. On the other hand, the monthly low was recorded at $2.87 trillion. These figures show that the market fluctuated within a wide range of approximately $422 billion during the month, equivalent to about 14% of the current total market. This fluctuation reveals that the cryptocurrency market still has high volatility on a monthly basis.
U.S. Spot Crypto ETF Markets
Spot Bitcoin ETFs recorded strong inflows on some trading days in January. However, due to significant outflows seen throughout the month, the cumulative picture was negative. During this period, there was a total net outflow of $277.3 million from Spot Bitcoin ETFs. Notably, a net inflow of $1.8 billion was observed between January 12-15. However, strong net outflows on other trading days turned the overall monthly outlook negative. This pattern revealed that demand on the ETF side struggled to gain momentum and that flows were highly volatile.
January was a period marked by strong inflows and outflows in spot Ethereum ETFs, with the balance disrupted by a wave of selling during specific periods. During this period, there was a cumulative total of $66 million in net inflows to . The strongest inflows of the month occurred on January 2nd with $174.5 million and on January 14th with $175.1 million. In contrast, net outflows of $230 million were seen on January 20th and $287 million on January 21st. Overall, flows throughout the month appeared volatile.
Crypto Options Markets
In the Bitcoin options market, contracts worth approximately $16.55 billion in BTC expired by the end of the month. Call options totaled 449,031 thousand contracts expiring between $95,000 and $105,000, while put options totaled 358,510 thousand contracts expiring between $75,000 and $85,000. The put/call ratio was 0.77, with the maximum pain point occurring at an average of $90,200.
In Ethereum options, ETH contracts worth $1.27 billion expired on January 30, the last trading day of the month. The total number of call options was 247,187, while put options totaled 183,983. The put/call ratio is at 0.74, and the maximum pain point is calculated at $3,100. Based on the same date’s data, the ATM volatility is at 51.92 and has remained nearly stable. This indicates that short-term uncertainty in the market has neither increased nor decreased.
CryptoSide – February
Bitcoin’s January Performance: A Volatile Ride
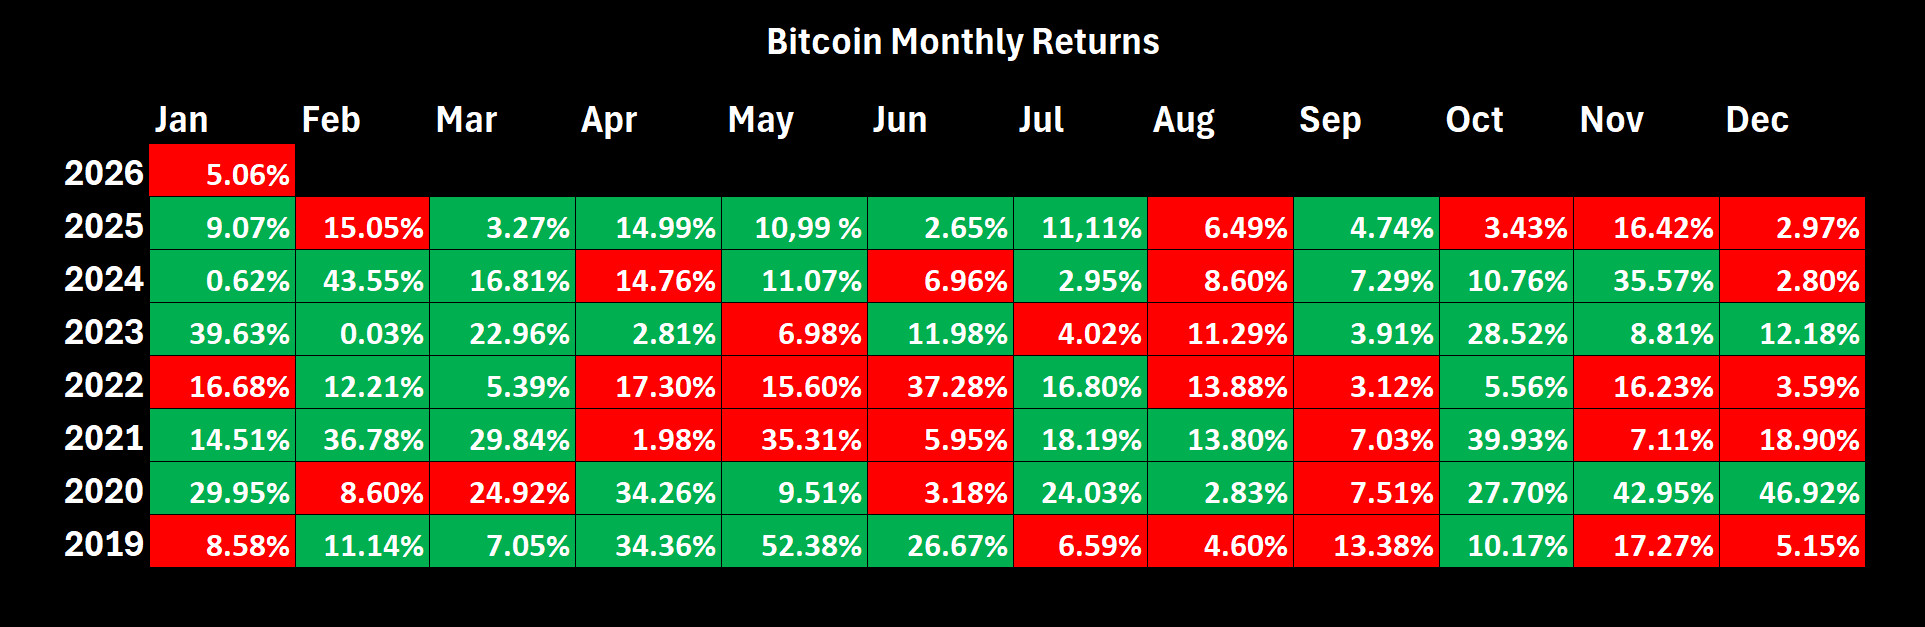
Bitcoin started the first month of the new year on a very optimistic note, recording an increase of approximately 10%. However, the trend reversed in the middle of the month, and Bitcoin gave back its gains, closing the month with a decline of approximately 5%. This volatility observed in Bitcoin, which is highly sensitive to market sentiment, was driven by macroeconomic developments, geopolitical risks, and uncertainties surrounding legislative processes. On the other hand, Bitcoin, which had not closed negatively in January except in 2019 and 2022, recorded a negative January close in 2025 after a three-year hiatus.
Bitcoin February Performance: Double-Digit Gains
Historical data shows that February months have mostly seen double-digit gains, while declines have been more limited and balanced. Bitcoin’s most notable February performance was a 36.78% increase in 2021 and 43.55% in 2024. Last February saw a double-digit loss of 15.05%. Overall, February continues to be a positive month for Bitcoin, with an average gain of approximately 13.12%.
*Prepared on January 30, 2026, at 6:26 a.m. (UTC)
Source: Darkex Research Department
Eyes on February
CLARITY Act
The CLARITY Act, a bill that would establish a regulatory framework for crypto asset markets, was debated in January but failed to pass due to concerns that the bill’s oversight mechanism would be incompatible with crypto companies. The reasons cited during this process included tokenized stocks, DeFi privacy, stablecoin returns, and the transfer of regulatory authority to the SEC. Having lost the support of many crypto companies, the Clarity Act aims to continue establishing a comprehensive regulatory framework for digital assets and defining the responsibilities between the SEC and the CFTC in February.
SEC-CFTC Coordination Activities
New CFTC Chairman Mike Selig, alongside SEC Chairman Paul Atkins, announced an ambitious crypto program at a “harmonization” event aimed at demonstrating a unified effort in digital assets. The leaders of both federal agencies came together at an event and stated that they had decided to pursue common policies to define the regulatory scope of digital assets. The SEC and CFTC’s joint efforts on crypto regulation will continue to be closely monitored by the crypto market.
Senate Committee Processes
In addition to the Clarity Act, the bill known as the Market Structure Act has now begun to be discussed in the Senate. The “Market Structure” bill, which was first discussed in the Senate in the opposite direction of the Clarity Act, will go to the House of Representatives if it passes the Senate. During this process, Democrats and Republicans will need to agree on the bill. Therefore, while this process is expected to take longer, this legislative effort will continue to be decisive for the market.
SEC Crypto Exemptions
SEC Chairman Paul Atkins has delayed the schedule for the “Crypto Innovation Exemption” rules he planned to publish in January. The rules were intended to provide regulatory certainty to tokenized securities and DeFi companies and protect them from SEC enforcement actions. However, Atkins stated that more careful consideration and guidance from Congress were needed, leaving the door open for continued work in February without providing a new release date.
Market Pulse
As the First Month of the Year Comes to a Close…
The first month of the new year ended with similar issues and volatility for global markets, which had experienced a turbulent year. US President Donald Trump’s policy line remained largely unchanged in January, and the concept of “geopolitical risk” remained high on the global agenda.
The challenging period for digital assets continues. Bitcoin is exhibiting pricing behavior consistent with its status as a risky instrument, while both political and macro developments are putting pressure on the largest cryptocurrency. Following the sharp losses experienced in October and November last year, we maintain our view that a prolonged period of stabilization is expected, and we continue to believe that digital assets will follow an upward trend in the long term. This stabilization period began in December, and it appears that we may continue to see the effects of position adjustments and portfolio rebalancing throughout the first quarter of the year.
As we begin the shortest month of the year, macroeconomic developments will continue to be a key factor in determining market direction. As such dynamics, including tariffs, the politicization of the Fed, and geopolitical developments, guide investors with their potential economic outcomes, we will continue to closely monitor the US Federal Reserve and US data, along with the unique variables of the crypto ecosystem.
February 6 – U.S. Employment Data
The employment indicators, which will provide insights into the potential roadmap of the US Federal Reserve (FED) that decided to keep its policy rate unchanged by ending its series of rate cuts at its last meeting, will be the first important macro data of the new month. These figures, which will be extremely important for global market participants, will be under close scrutiny by investors.
Among the labor market statistics to be released on February 6, the Nonfarm Payrolls (NFP) for January, in particular, will shed light on the Federal Open Market Committee’s (FOMC) interest rate cut path this year.
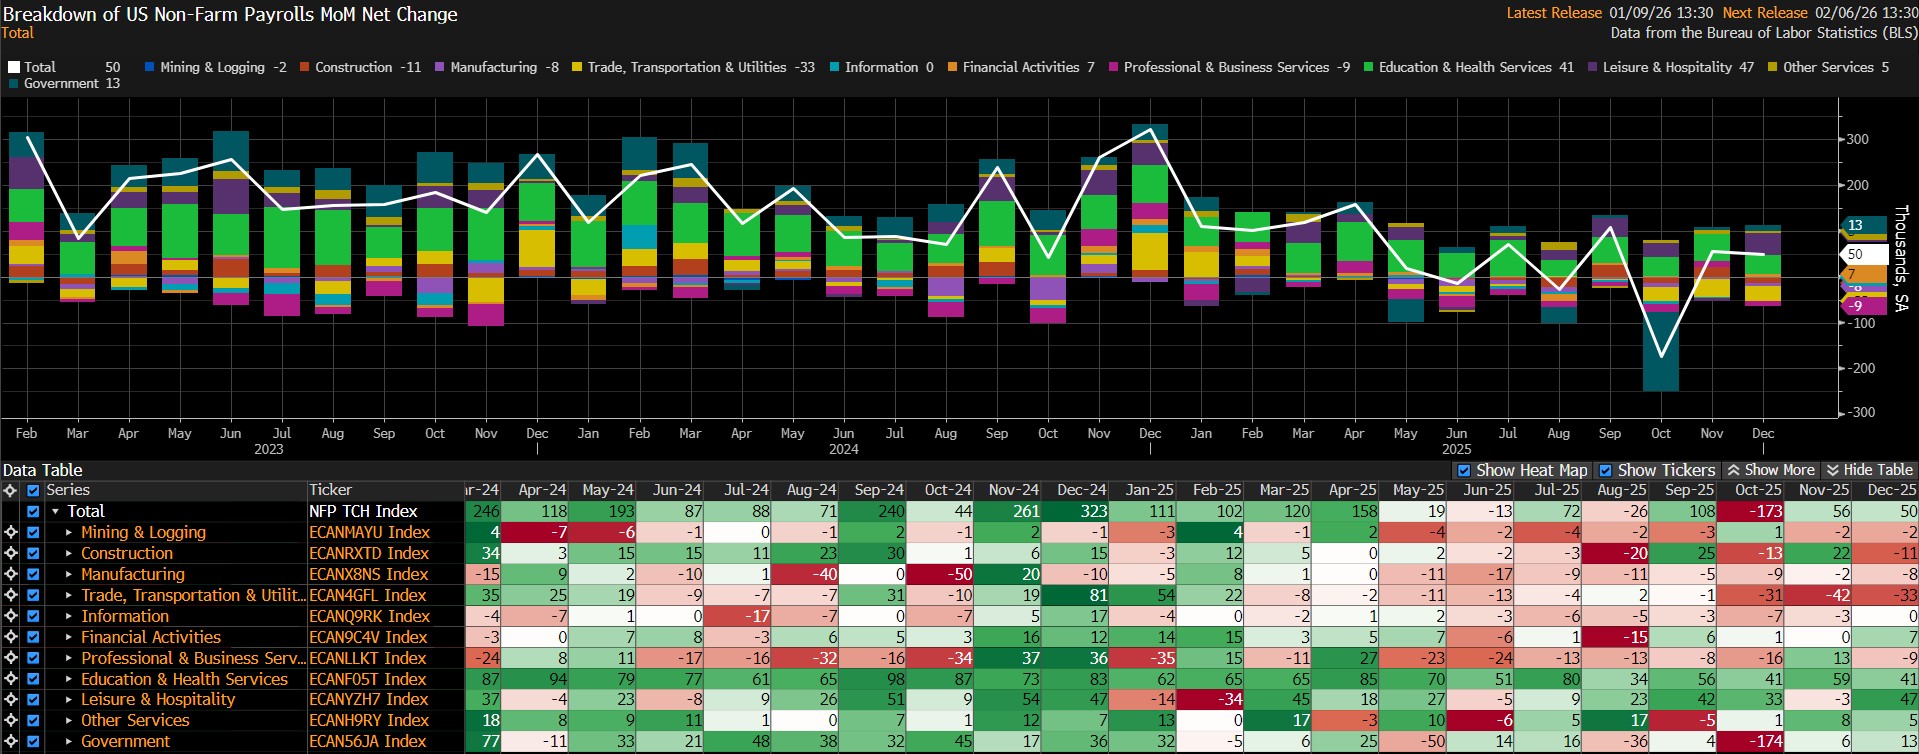
Source: Bloomberg
Given the high market sensitivity surrounding the NFP data, our forecast is that the U.S. economy may have achieved higher-than-expected employment growth in non-farm sectors in January. At the time of writing, although the number of forecasts entered is low, we see that the consensus in the Bloomberg survey is around 65,000. (This expectation figure may change later with new forecasts and new surveys, and most likely will change. However, it is still important to see the approximate analyst forecasts and understand market expectations. It would be beneficial to closely follow Darkex’s weekly newsletters for current forecasts). The average of the forecasts is around 67,500.
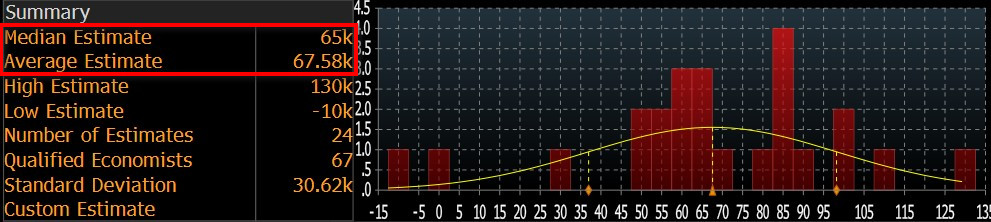
Source: Bloomberg
We believe that if January’s NFP data falls below expectations, it could strengthen expectations that the Fed may be more aggressive in lowering interest rates, thereby increasing risk appetite and positively impacting financial instruments, including digital assets. We believe that data above expectations could have the opposite effect.
February 8 – Japan Lower House Elections
In Japan, which has the world’s third-largest economy and a currency that holds sway in global markets, voters will head to the polls at the end of the first week of the new year. This decision was made by Japan’s new Prime Minister Sanae Takaichi on January 23, and the Prime Minister dissolved the Lower House and announced early elections on February 8.
There is talk that Takaichi’s move aims to strengthen the ruling Liberal Democratic Party (LDP) and the coalition’s power in parliament by taking advantage of her party’s high approval ratings. Although the Lower House’s term continues until October 2028, it remains to be seen whether this is a logical approval move or a risky decision taken prematurely. Takaichi is a popular figure, but the LDP’s power is being questioned. Following the surprise alliance between the main opposition party and the former LDP coalition partner, the opposition has grown stronger, and Takaichi’s early move could lead to an unexpected surprise, which is among the topics covered in the world press.
Over the past few months, the fluctuations observed in the Japanese currency and bonds have been felt across all markets due to the interconnectedness brought about by globalization. Therefore, the upcoming results may also have an impact on the digital asset market. While we do not anticipate it causing significant changes, it would be beneficial to be prepared for possible surprise election results. Takaichi stands out as a pro-monetary easing administrator. Faced with the side effects of this, the Bank of Japan (BoJ) is making some moves with its monetary policy, and there are price movements indicating that the BoJ is close to a new interest rate hike this year. A possible surprise from the Lower House election results could pose obstacles to Takaichi achieving his policy goals. It also carries the potential to create political uncertainty. It will be difficult to gauge the effects of these on the yen. However, if the country’s currency continues to lose value, fragile confidence could be tested again, and we could see pressure on global markets in general.
February 11 – US Consumer Price Index: CPI
One of the key macroeconomic indicators that could provide insight into the Federal Reserve’s (FED) interest rate cut path will be January inflation, specifically the change in the Consumer Price Index (CPI). Fed Chair Powell has been relatively more optimistic about inflation in his recent statements. However, we believe that it is still difficult to measure price increases resulting from tariffs. That said, it should be noted that we do not have deep concerns about inflation being passed on to consumers due to increased customs tariffs.
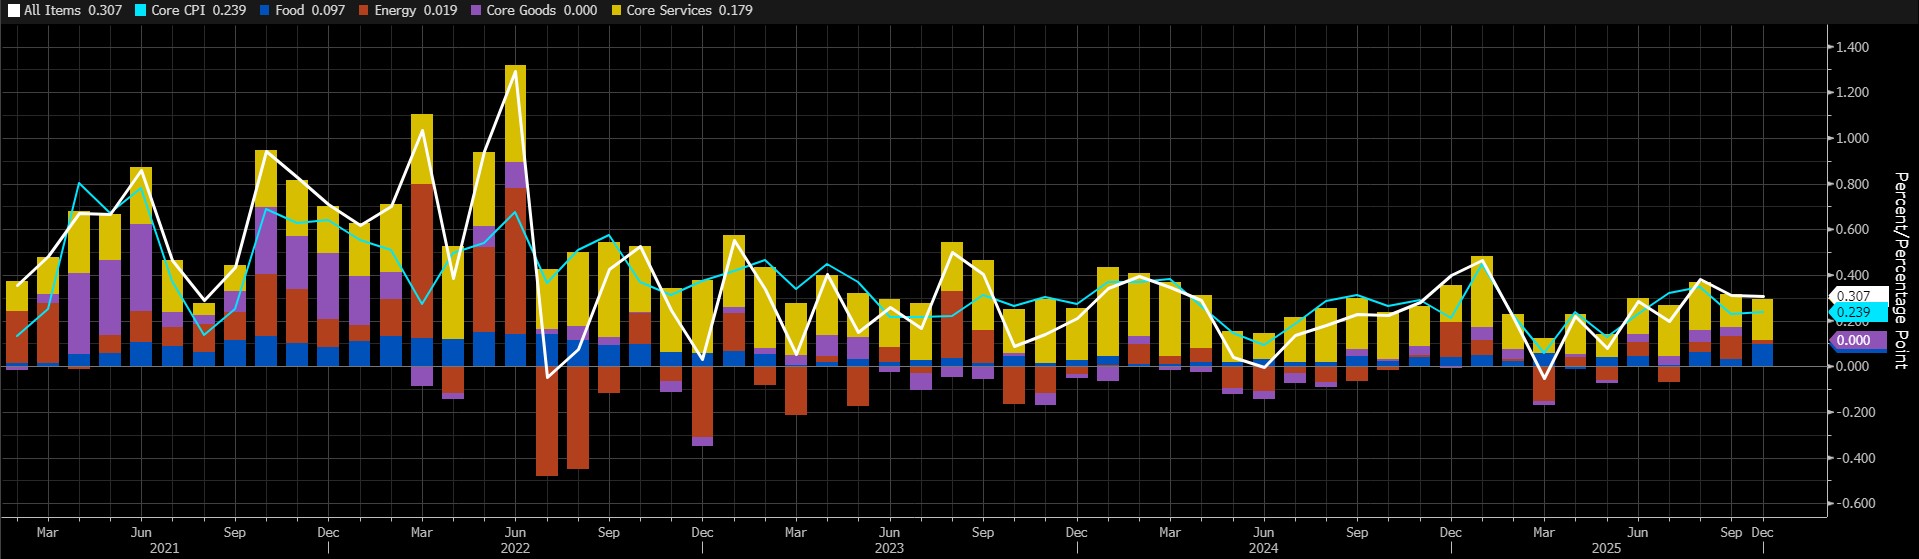
Source: Bloomberg
The Bureau of Labor Statistics (BLS) did not publish indicators for October and November because it was unable to collect data for the October 2025 period due to the government shutdown. U.S. consumer prices rose 0.3% month-on-month in December 2025, meeting market expectations. Core CPI, excluding food and energy, rose 0.2%, slightly below expectations of 0.3%. We estimate that the monthly CPI data could come in at 0.41% in January.
A CPI figure that falls below market expectations could be interpreted as giving the Fed more leeway to cut interest rates, which could have a positive impact on digital assets. A figure that exceeds expectations, however, could reinforce expectations that the Fed may hesitate to implement another rate cut, potentially putting pressure on the market.
February 20 – The Fed’s Favorite Inflation Indicator: PCE
Markets will be looking for clues about the Federal Open Market Committee’s (FOMC) interest rate cut path in 2026 and will closely monitor the Personal Consumption Expenditures (PCE) data for December. This indicator is known as the preferred indicator used by FOMC officials to track changes in inflation. Although it provides delayed information compared to the Consumer Price Index (CPI) data, it is an influential indicator in market prices as it is the Federal Reserve’s benchmark inflation measure.
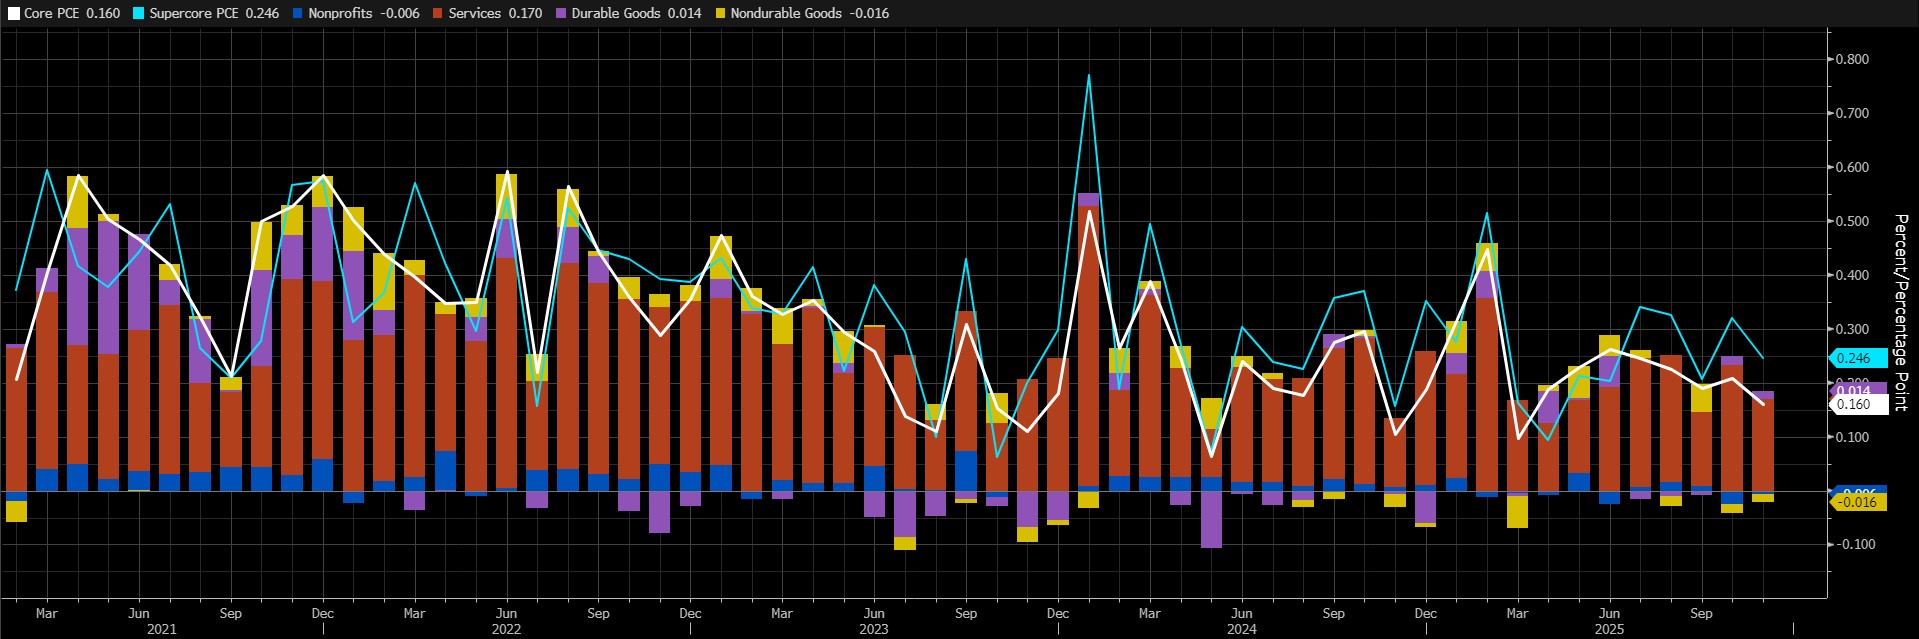
Source: Bloomberg
According to data released by the Bureau of Economic Analysis (BEA) with a delay due to the government shutdown, the U.S. personal consumption expenditures price index, excluding food and energy, rose by 0.2% on a monthly basis in November 2025, unchanged from October’s rate and in line with market expectations. On an annual basis, core PCE inflation rose from 2.7% in October to 2.8% in November, in line with market expectations. Our forecast model projects a 0.2% increase in core PCE on a monthly basis for December.
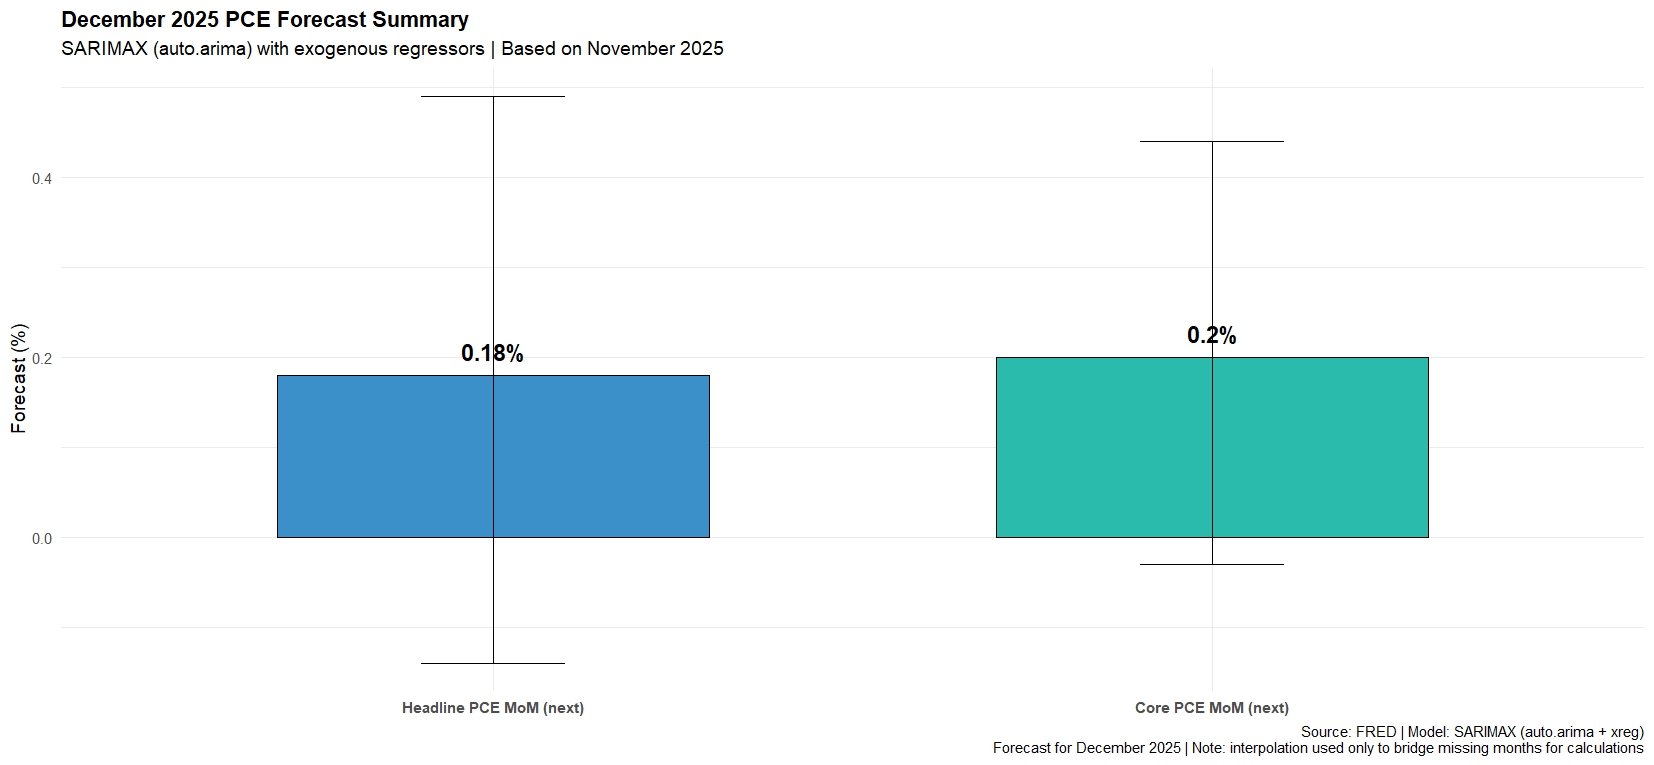
Source: Darkex Research
Data coming in above market expectations could support expectations that the Fed may be cautious about cutting interest rates, reducing risk appetite and putting pressure on digital assets. Data coming in below expectations, on the other hand, could have the opposite effect and pave the way for gains.
February 20 – US GDP Change
U.S.’s GDP data, which will show us how much the world’s largest economy grew in the last three months of the past year, will be the first estimate released by the Bureau of Economic Analysis (BEA) for that quarter. Naturally, it will be closely watched by global markets and will be one of the key indicators determining the level of risk appetite among investors.
As can be seen in the graph below, we are observing fluctuations in GDP in recent periods. The policies of US President Donald Trump on tariffs and the resulting uncertainty, which has influenced the behavior of economic decision-makers, play a significant role in this. The changes in the Net Exports item in the first and second quarters of 2025 reflect this. With these changes in the item, the US economy contracted by 0.6% in the first quarter of the year and grew by 3.8% in the second quarter. This figure marked the highest economic expansion seen since the 4.7% growth in the third quarter of 2023. According to the latest data, the country’s economy managed to achieve 4.4% growth in the third quarter of the year.
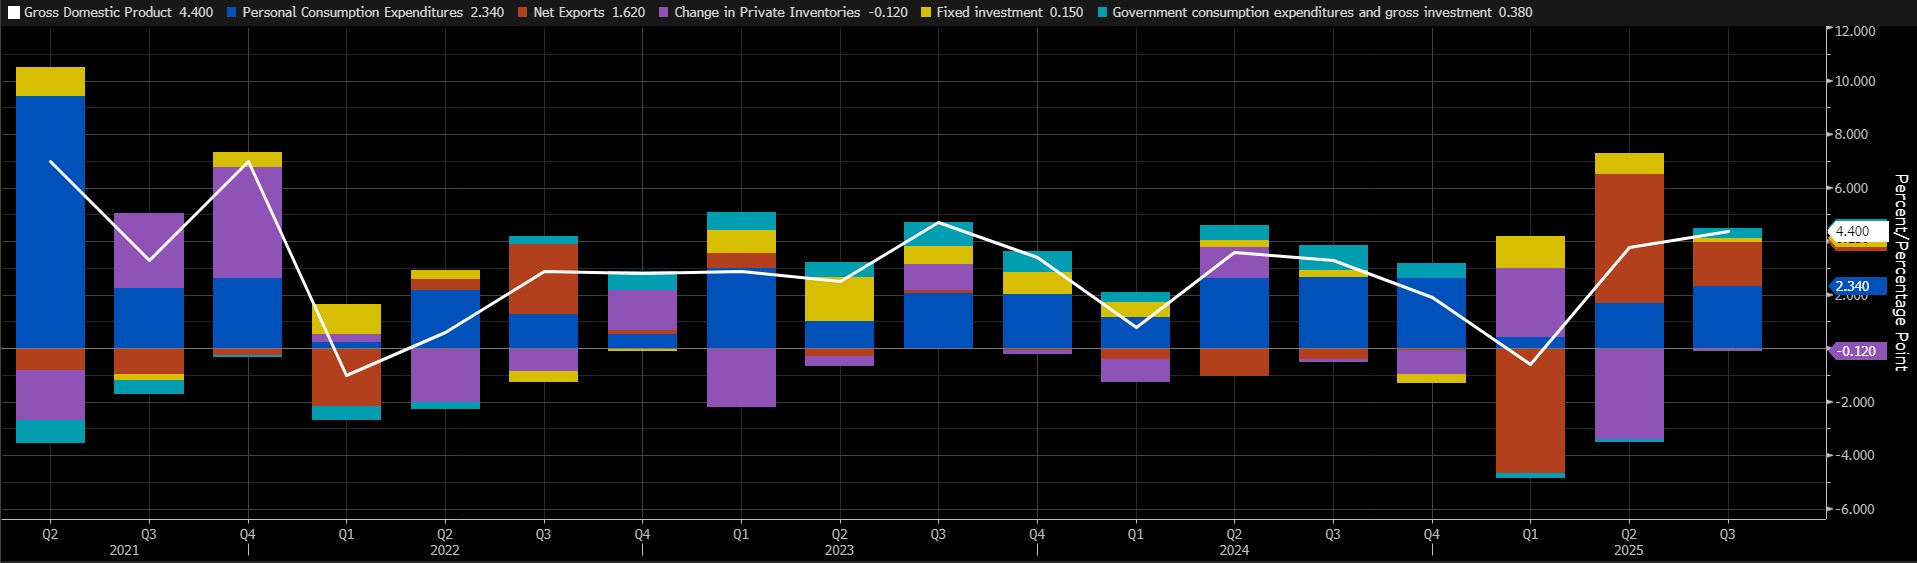
Source: Bloomberg
The new data to be released will be the first figures we see for the last quarter of the year. Our prediction is that the delayed demand that caused the contraction in the first quarter of the year will continue to emerge in subsequent quarters, bringing higher-than-normal growth momentum, and that growth momentum will be maintained, albeit not as much as we saw in the third quarter.
When evaluating the immediate market reaction, we can say that we believe data exceeding consensus expectations could increase risk appetite and have a positive impact on digital assets. Conversely, GDP data falling below expectations could have a negative impact from this perspective.
*General Information About Forecasts
In addition to general market expectations, the forecasts shared in this report are based on econometric modeling tools developed by our research department. Different structures were considered for each indicator, and appropriate regression models were constructed in line with data frequency (monthly/quarterly), leading economic indicators, and data history.
The basic approach in all models is to interpret historical relationships based on data and to produce forecasts that have predictive power with current data. The performance of the models used is measured by standard metrics such as mean absolute error (MAE) and is regularly re-evaluated and improved. While the outputs of the models guide our economic analysis, they also aim to contribute to strategic decision-making processes for our investors and business partners. Data is sourced directly from the FRED (Federal Reserve Economic Data) platform in an up-to-date and automated manner, en ing that every forecast is based on the latest economic data. As the research department, we are also working on artificial intelligence-based modeling methods (e.g., Random Forest, Lasso/Ridge regressions, ensemble models) to improve forecast accuracy and react more sensitively to market dynamics. The macroeconomic context should be considered when interpreting model outputs, and it should be noted that forecast performance may deviate due to economic shocks, policy changes, and unforeseen external factors. With this monthly updated working set, we aim to provide a more transparent, consistent, and data-driven basis for monitoring the macroeconomic outlook and strengthening decision support processes.
Legal Notice
The investment information, comments, and recommendations contained in this document do not constitute investment advisory services. Investment advisory services are provided by authorized institutions on a personal basis, taking into account the risk and return preferences of individuals. The comments and recommendations contained in this document are of a general nature. These recommendations may not be suitable for your financial situation and risk and return preferences. Therefore, making an investment decision based solely on the information contained in this document may not result in outcomes that align with your expectations.