
BTC/USDT
The US agenda presents a picture where macro data, geopolitical tensions, and monetary policy uncertainties are all coming to the fore simultaneously. Manufacturing PMI data returning to expansion territory signals the resilience of the US economy, while weakening expectations of interest rate cuts in the first half of the year. However, softer-toned statements from Fed officials indicate that policy disagreements persist. The risk of a government shutdown in Washington and the Trump–Powell tension increased institutional uncertainty, while the US–Iran talks expected to take place in Istanbul partially balanced geopolitical tensions. Trump’s planned “Treasury Plan” for critical minerals and crypto-friendly rhetoric also drew attention.
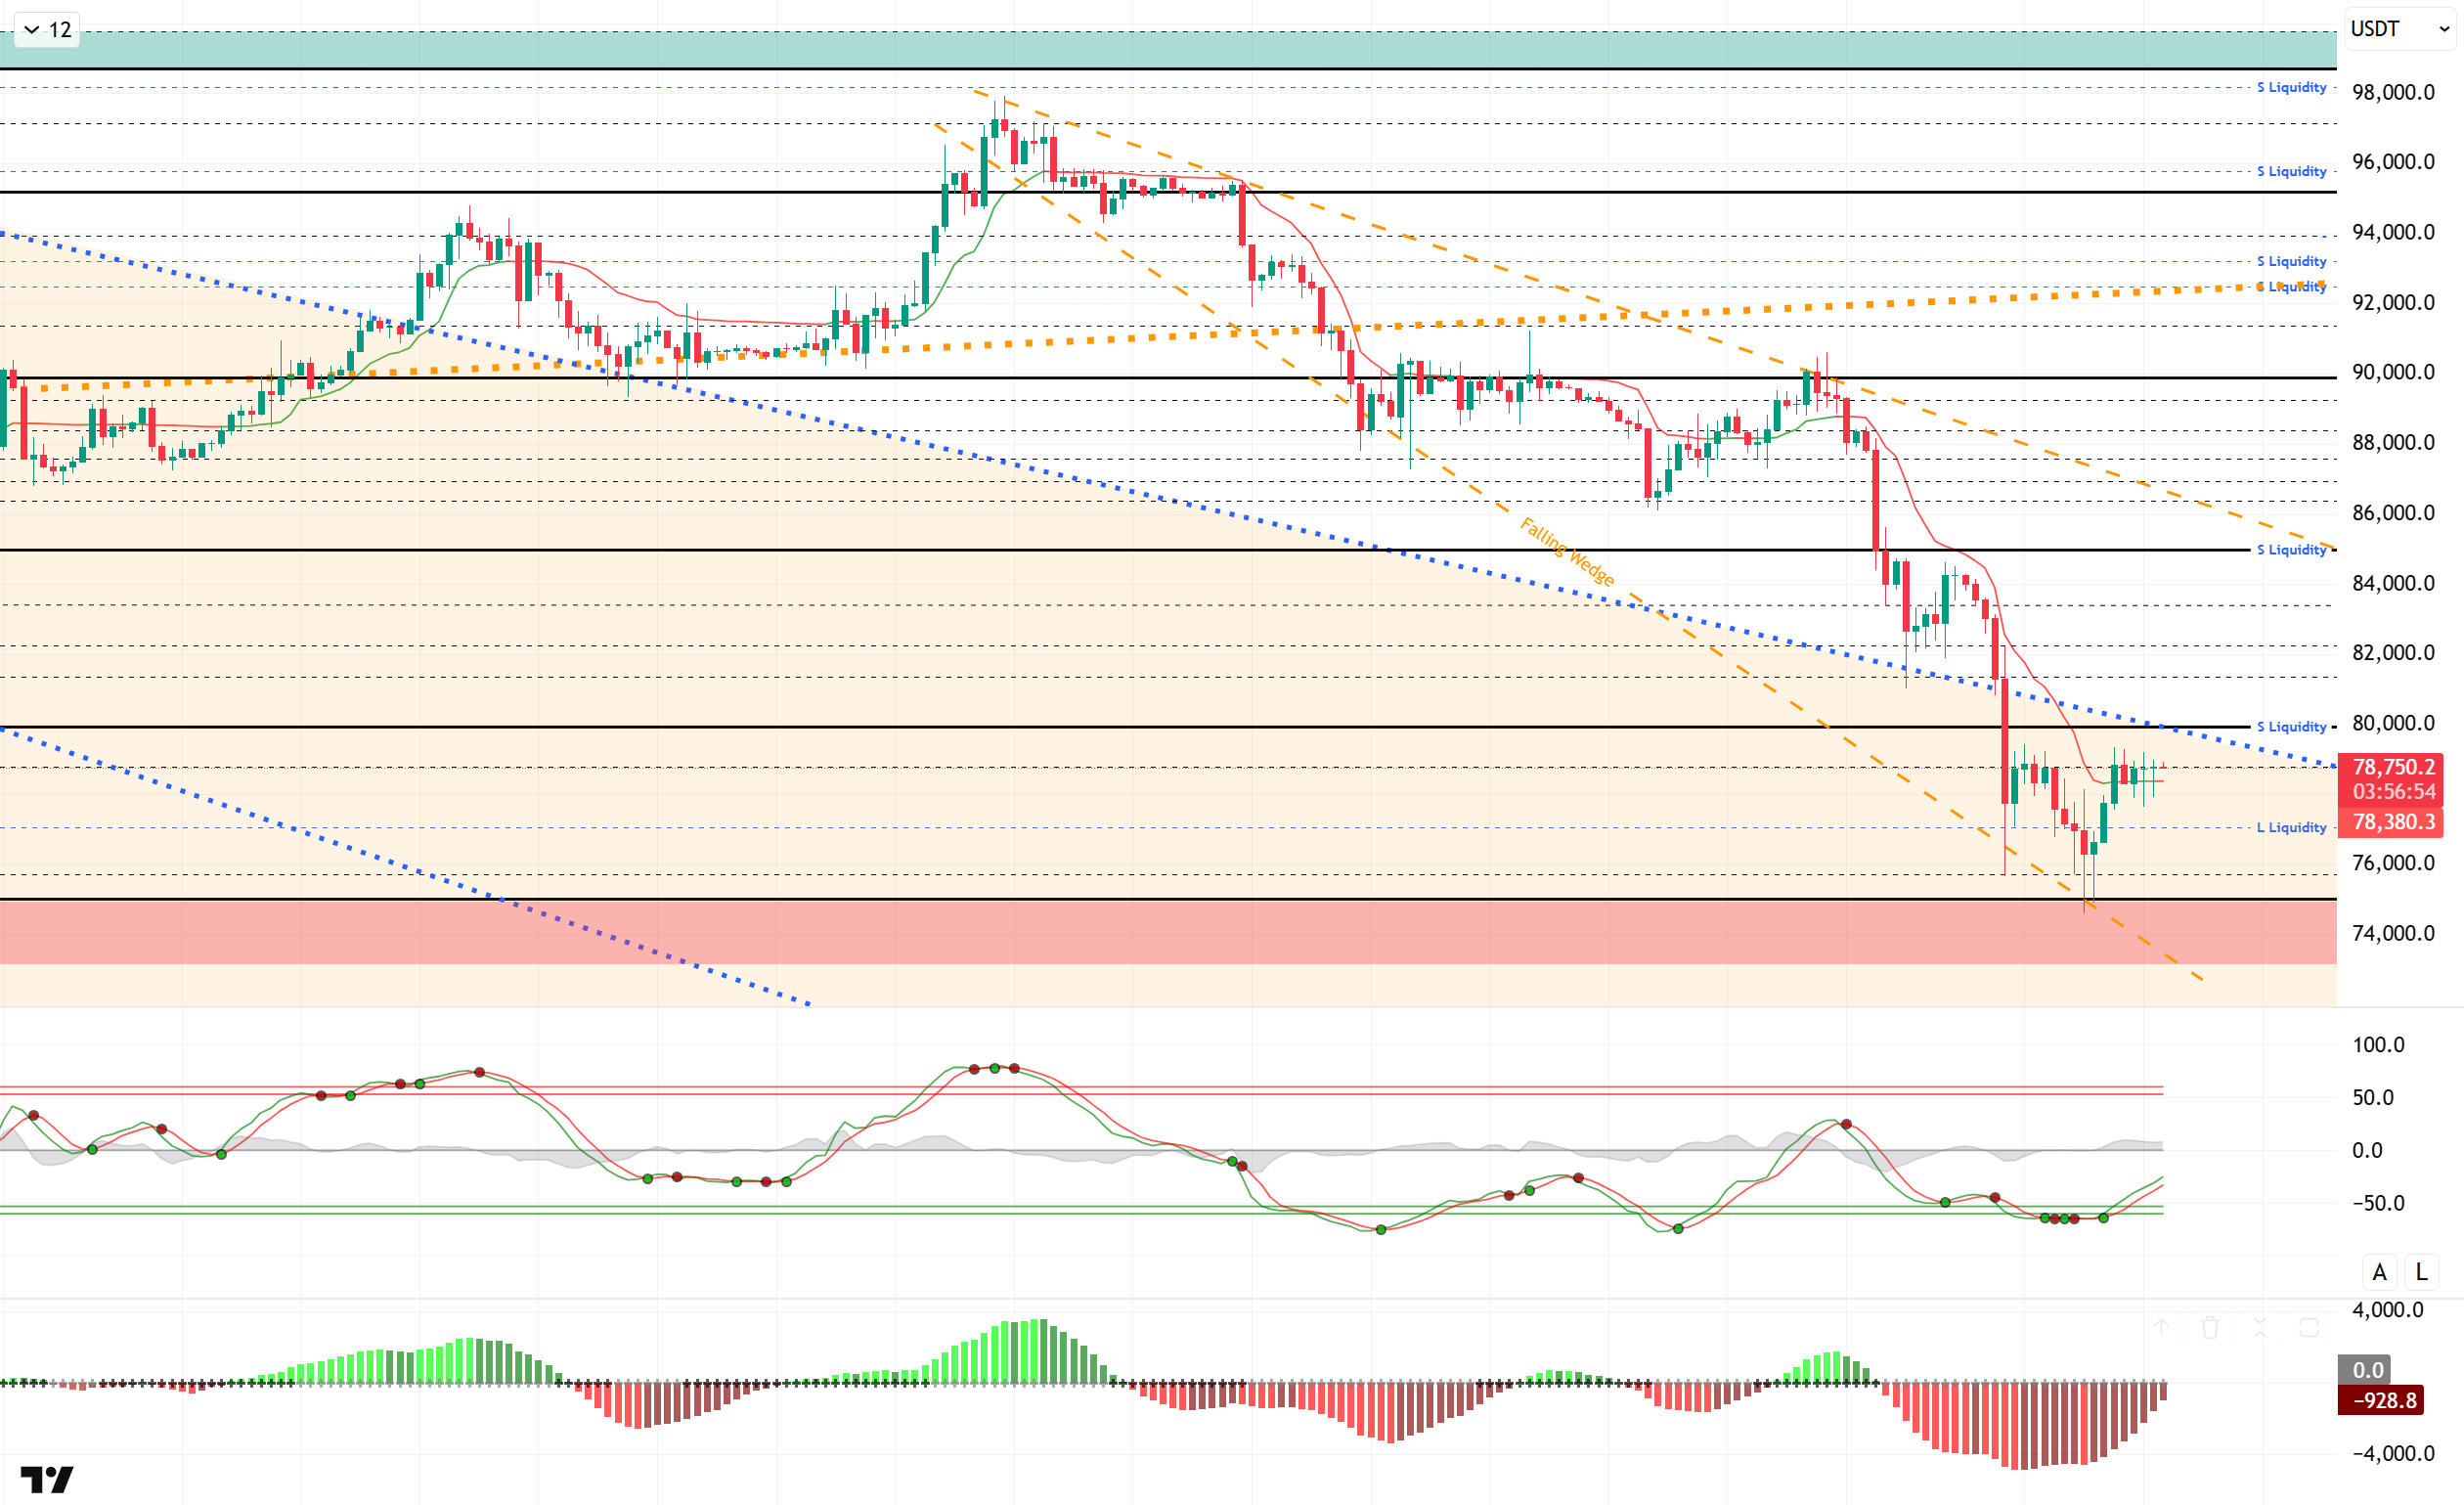
From a technical perspective, BTC’s partial recovery process continues. After a relentless decline, the price found support at the 75,000 level, reversed its direction upward, and rose above the 78,000 level. Consolidating here, BTC formed resistance at the 78,800 level. The next resistance level for the price attempting to break through this zone is the 80,000 reference level. For the continuation of the uptrend, breaking above this level and closing above it will remain decisive.
Technical indicators show that the Wave Trend (WT) oscillator has recently started giving buy signals again in the oversold zone. The histogram on the Squeeze Momentum (SM) indicator is attempting to recover with maximum momentum within the negative zone. The Kaufman Moving Average (KAMA) is currently trading below the price at the $78,378 level.
When examining liquidation data, the buying levels have re-accumulated within the 76,000 – 77,000 band in the short term. The selling level has increased its intensity in the short term at 79,000 and in the medium term at 85,000 – 86,000. In the long term, the intensity of positions continues above the 91,000 level.
In summary, the budget bill, which played a role in the US government shutdown, will be voted on in the House of Representatives today. While the announced US PMI data points to resilience, the BLS announced that the January NFP data will not be released on the scheduled date. On the other hand, Trump announced a $12 billion plan to counter supply shocks. On the geopolitical front, talks between the US and Iran will take place on Friday. On the crypto front, despite progress at the stablecoin meeting held at the White House, no agreement was reached.Looking at liquidity data, buying levels are being redefined, while selling levels remain intense. Technically, BTC started the new year with positive momentum, but after testing the 98,000 level, it entered a new wave of selling pressure with profit-taking, falling back to the 74,600 level. Following this movement, it closed all months since September in negative territory. BTC, which also started February with a decline, retreated to the critical range of 75,000 – 80,000. While these levels stand out as a decision-making zone in terms of price, a rebound will be monitored from this stage onwards, with the aim of regaining and holding above the 80,000 level. Otherwise, in a new wave of selling, the 75,000 reference level stands out as the price’s last area of support.
Supports: 75,000 – 73,500 – 71,000
Resistances: 78,800 – 80,000 – 81,000
ETH/USDT
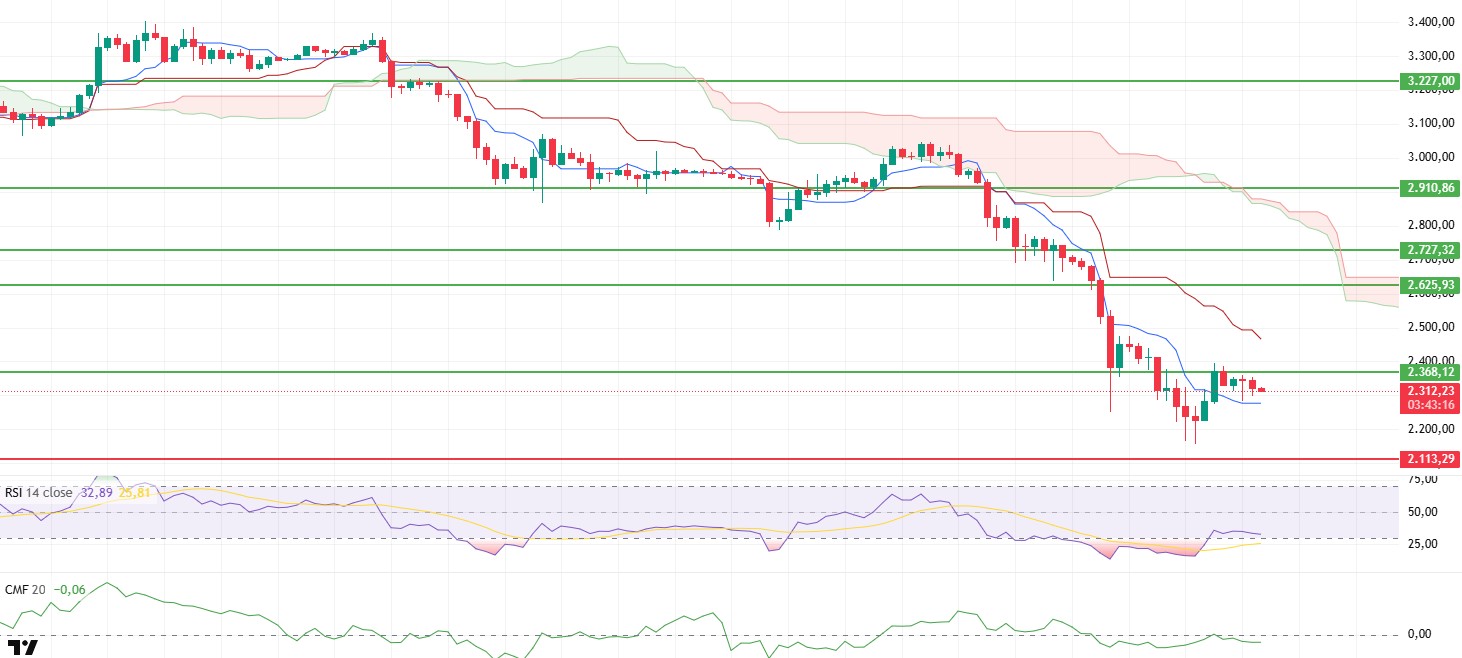
As expected, the ETH price attacked the $2,368 resistance level yesterday evening and briefly rose to $2,390. However, selling pressure in this region prevented buyers from maintaining control, and the price retreated again, falling back to around $2,310. While this movement indicates the potential for a rebound, it also reveals that confidence in the market has not yet been fully restored.
The liquidity outlook weakened again. The Chaikin Money Flow (CMF) recovered to the zero line but then turned downward again and remained in negative territory. This pattern indicates that liquidity outflows have not completely ended and selling pressure is still effective. As long as the CMF does not move into positive territory, upward attempts are likely to remain fragile.
There has been no significant improvement on the momentum front either. Although the Relative Strength Index (RSI) has moved out of the oversold zone, it has failed to gain strength and has started to move downward again. This indicates that buyers have not yet been able to create sustainable momentum and that rebound rallies could easily fade.
On the technical side, the Ichimoku indicator presents a mixed picture in the short term. Although the price managed to stay above the Tenkan level, it continues to trade below the Kijun level and the kumo cloud. This positioning allows for short-term relief but confirms that the main trend remains negative.
Critical thresholds remain unchanged in the overall outlook. A clear gain above the $2,368 level could open up room for upward movement and strengthen the recovery. Conversely, a slight pullback towards the $2,113 region during the day seems likely. Should this support fail to hold, downward pressure could intensify again.
Supports: 2,113 – 1,958 – 1,756
Resistances: 2,368 – 2,625 – 2,727
XRP/USDT
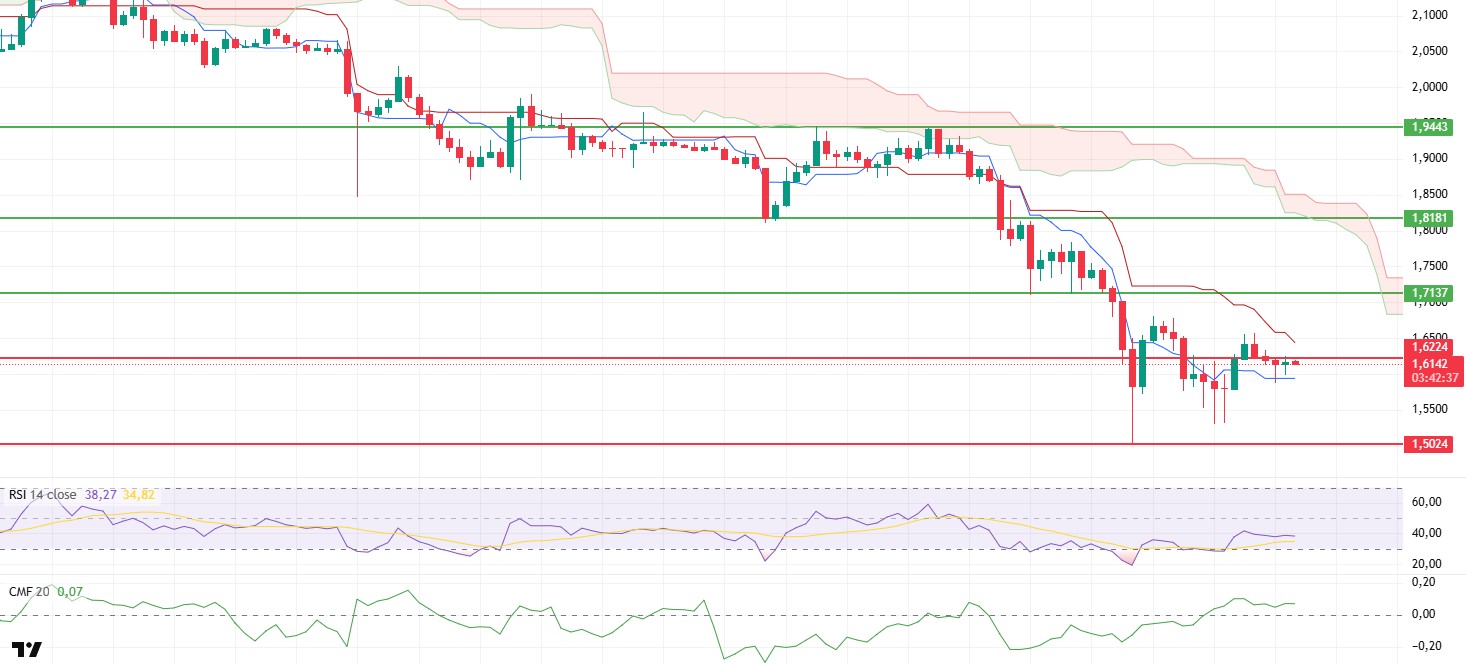
Although the XRP price dipped below the $1.62 support level yesterday evening, there was no permanent break in this region, and the price attempted to hold near this level again. The lack of accelerated selling pressure indicates that buyers have not completely exited the market in the short term, but the price is still struggling above a critical threshold, keeping uncertainty alive. The current structure indicates that the market continues to search for direction.
The liquidity picture remains similar to previous days. The Chaikin Money Flow (CMF) continues to stay in positive territory, indicating that money inflows have not completely dried up. However, these inflows do not appear aggressive enough to drive a strong upward move. Liquidity support is intact but not strong enough to create a clear trend reversal.
There is a partial stabilization on the momentum front, but momentum remains fragile. Although the Relative Strength Index (RSI) has moved away from the oversold zone, it has not produced a strong upward surge. This structure indicates that selling pressure has eased somewhat, but buyers have not yet taken full control. A clearer upward movement is needed for momentum to strengthen permanently.
Although the Ichimoku indicator shows a neutral outlook in the short term, the overall picture remains weak. While the price is trying to stay above the Tenkan level, the Kijun and kumo cloud have not yet been regained. Therefore, the technical structure points more to a reaction process and does not confirm a trend reversal.
In the overall assessment, the $1.62 level continues to be decisive. If sustainability above this level can be achieved, the price can be expected to attempt an upward move towards the $1.71 resistance. Conversely, if the $1.50 support is lost, selling pressure could intensify and the decline could turn into a deeper structure.
Supports: 1.5024– 1.4119 – 1.2540
Resistances: 1.6224 – 1.7137 – 1.8181
SOL/USDT
Arcium, a Solana-based privacy stack that brings encrypted capital markets to the on-chain economy, launched its mainnet alpha version.
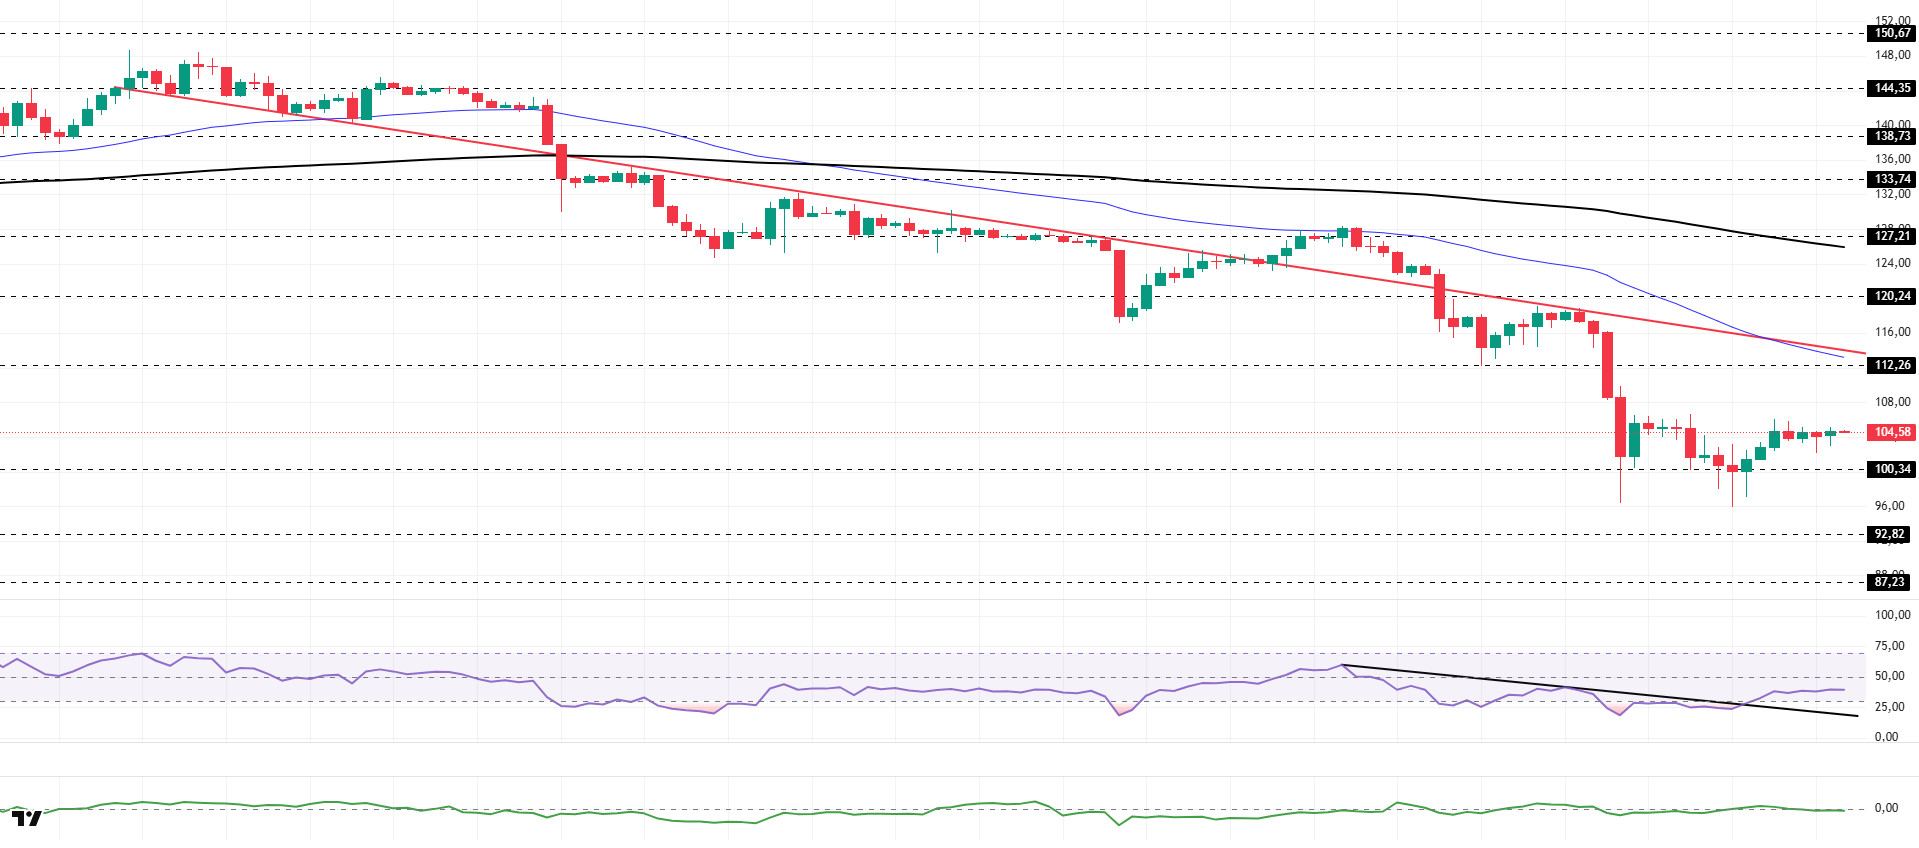
The SOL price traded sideways. The asset remained in the lower region of the downward trend that began on January 13, signaling continued selling pressure. Breaking below the strong support level of $112.26, the asset gained slight momentum from the strong support level of $100.34 and experienced an uptrend. If it closes below this level, it may test the $92.92 level. If it experiences an uptrend, it may test the downward trend as resistance.
On the 4-hour chart, the 50 EMA (Exponential Moving Average – Blue Line) continues to be below the 200 EMA (Black Line). This indicates that a downtrend may begin in the medium term. At the same time, the price being below both moving averages shows that the asset is trending downward in the short term. The Chaikin Money Flow (CMF-20) has retreated from positive territory to neutral levels. However, a decrease in money inflows could pull the CMF back into negative territory. The Relative Strength Index (RSI-14) has seen a slight rise from oversold territory. This could trigger profit-taking, causing the price to rebound from this level. At the same time, it broke above the downward trend line on January 28. This could create buying pressure. If there is an uptrend due to macroeconomic data or positive news related to the Solana ecosystem, the $120.24 level stands out as a strong resistance point. If this level is broken upwards, the uptrend is expected to continue. If there are pullbacks due to developments in the opposite direction or profit-taking, it may test the $87.23 level. If it falls back to these support levels, an increase in buying momentum could present a potential upside opportunity.
Supports: 100.34 – 92.82 – 87.23
Resistances: 112.26 – 120.24 – 127.21
DOGE/USDT
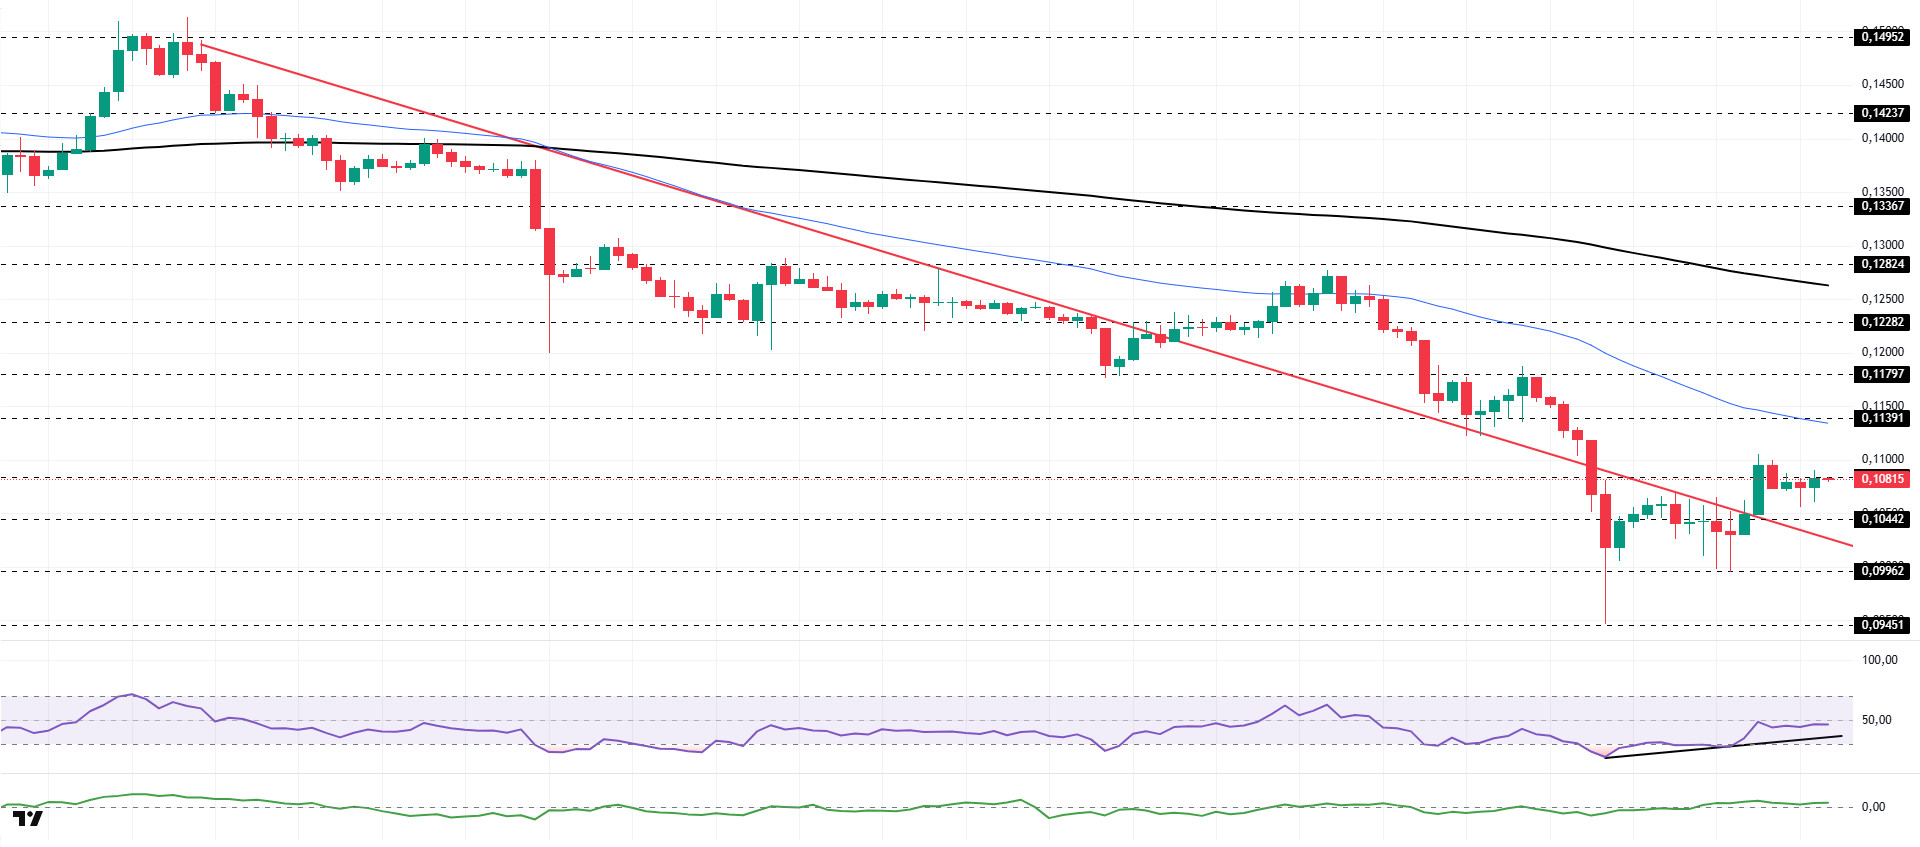
The DOGE price traded sideways. The asset remained in the upper region of the downtrend that began on January 14, signaling that buying pressure could build. Testing the strong support level of $0.09962, the asset gained momentum from there and rose. Currently located in the upper region of the downward trend line, the asset is testing the strong resistance level of $0.10837 as resistance. If it breaks above this level, it may test the 50 EMA (Blue Line) moving average as resistance. If it experiences a pullback, it may test the downward trend line as support.
On the 4-hour chart, the 50 EMA (Exponential Moving Average – Blue Line) remained below the 200 EMA (Black Line). This indicated a downtrend forming in the medium term. The price being below both moving averages suggests that the price may be trending downward in the short term. The Chaikin Money Flow (CMF-20) remained in positive territory. Additionally, a decrease in money inflows could pull the CMF into negative territory. The Relative Strength Index (RSI-14) continued to hover around the midpoint of the negative zone. It also maintained its position above the descending line that began on January 28, signaling that buying pressure could emerge. In the event of an uptrend driven by political developments, macroeconomic data, or positive news flow in the DOGE ecosystem, the $0.11797 level stands out as a strong resistance zone. Conversely, in the event of negative news flow, the $0.09071 level could be triggered. A decline to these levels could increase momentum and initiate a new wave of growth.
Supports: 0.10442 – 0.09962 – 0.09451
Resistances: 0.10837 – 0.11391 – 0.11797
TRX/USDT
Tron Inc. announced in a post this morning that it purchased 175,890 TRX at an average price of $0.28, bringing its total holdings to over 679.6 million TRX. The company stated in its announcement that it aims to further increase its Tron holdings to increase share value in the long term.
As of February 2, 2026, the total amount of TRX staked is 46,097,740,487, which is 48.67% of the circulating supply. Compared to the previous day, there has been an increase of approximately 0.02% in the amount staked. Meanwhile, the TRX market value has reached $26.8 billion. Furthermore, a total of 4,460,849 TRX was burned yesterday, permanently removing 545,137 TRX from the circulating supply. This situation leads to a decrease in inflationary pressure on Tron.
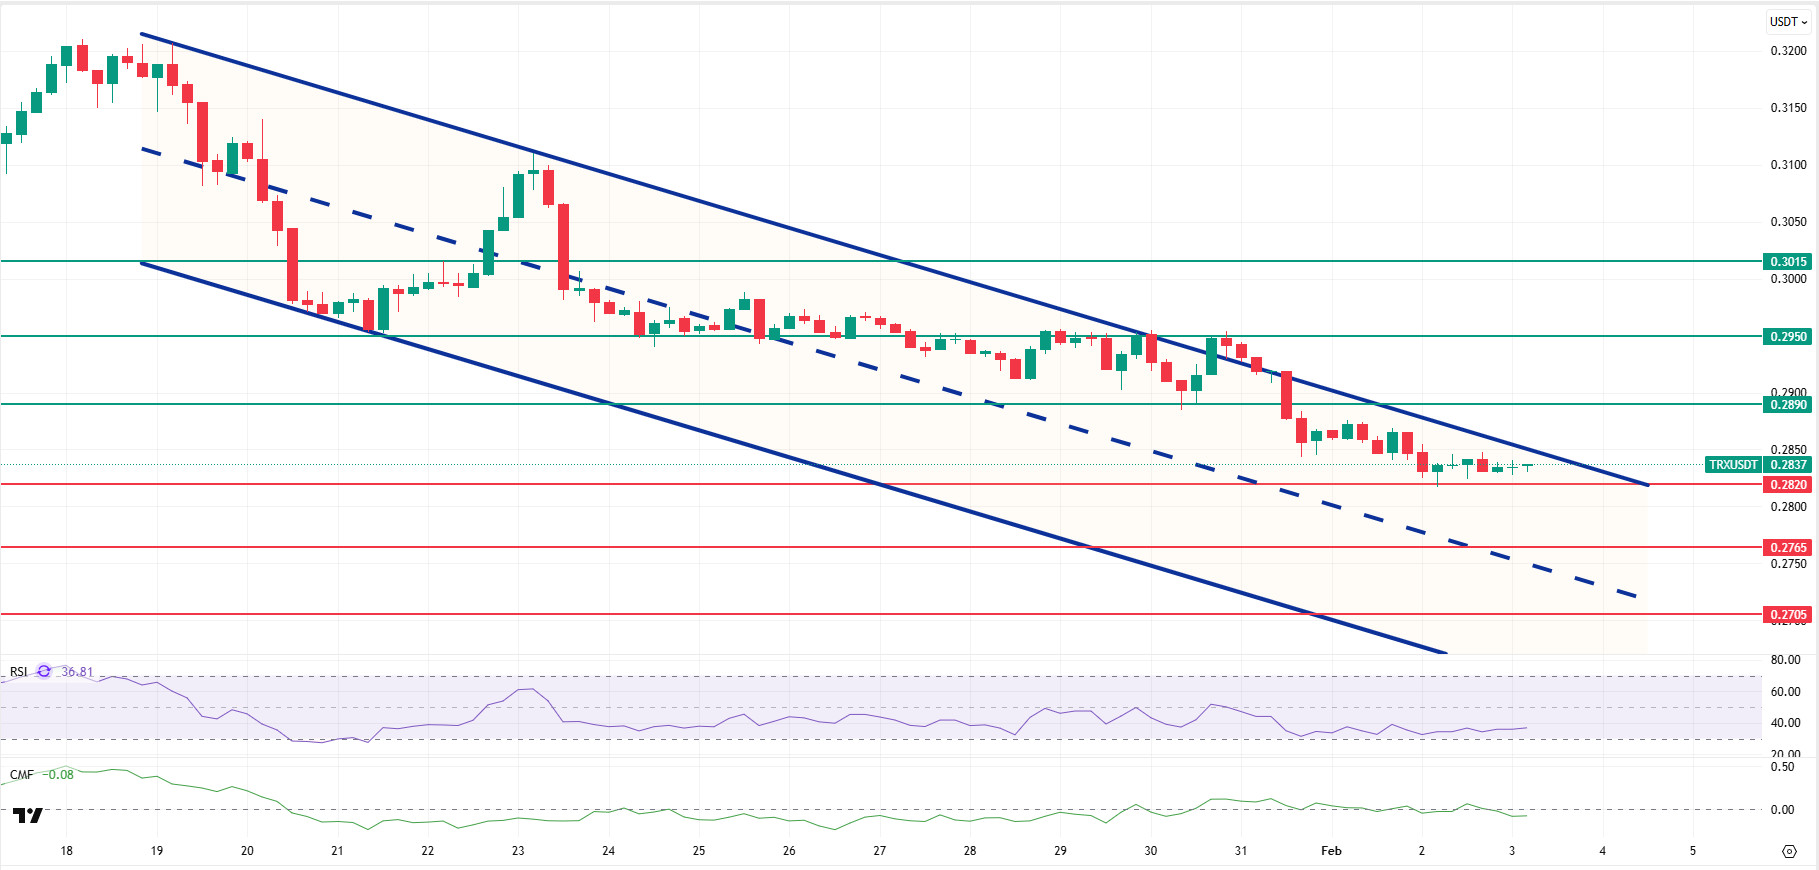
Technically speaking, TRX closed yesterday at 0.2835 after the decline, gained some value in the morning hours, and is currently trading at 0.2837. Currently in the upper band of the bearish channel, TRX is priced above the 0.2820 support on the 4-hour chart. The Relative Strength Index (RSI) value is seen to be very close to the oversold zone at 36. In addition, the Chaikin Money Flow (CMF) indicator value is below zero at -0.08, indicating that money inflows continue to decline. The current picture points to selling pressure gaining strength and an increased likelihood of downward price movement in the short term.
In light of all these indicators, TRX is expected to decline slightly in the first half of the day, moving towards the middle band of the channel based on its current region and CMF value. It may thus retest the 0.2820 support level. A candle close below the 0.2820 support could signal a continuation of the decline, potentially testing the 0.2765 support level. If it fails to close below the 0.2820 support level and the CMF indicator also moves into positive territory, it may rise slightly with a possible buying reaction and test the 0.2890 resistance level. On the 4-hour chart, 0.2705 is an important support level, and as long as it remains above this level, the possibility of an upward movement is maintained. If this support is broken, selling pressure may increase.
Supports: 0.2820 – 0.2765 – 0.2705
Resistances: 0.2890 – 0.2950 – 0.3015
Legal Notice
The investment information, comments, and recommendations contained herein do not constitute investment advice. Investment advisory services are provided individually by authorized institutions taking into account the risk and return preferences of individuals. The comments and recommendations contained herein are of a general nature. These recommendations may not be suitable for your financial situation and risk and return preferences. Therefore, making an investment decision based solely on the information contained herein may not produce results in line with your expectations.

