
BTC/USDT
US President Donald Trump ended the partial government shutdown by signing the government funding bill in the Oval Office of the White House. US-Iran tensions escalate: An Iranian drone was shot down by an F-35 in the Gulf; speedboats approached a US tanker; oil prices rose by 2.3%. Russia launched a major air strike ahead of Ukraine talks: 71 missiles and 450 drones targeted 8 regions, leaving hundreds of thousands of homes without power in Kharkiv.
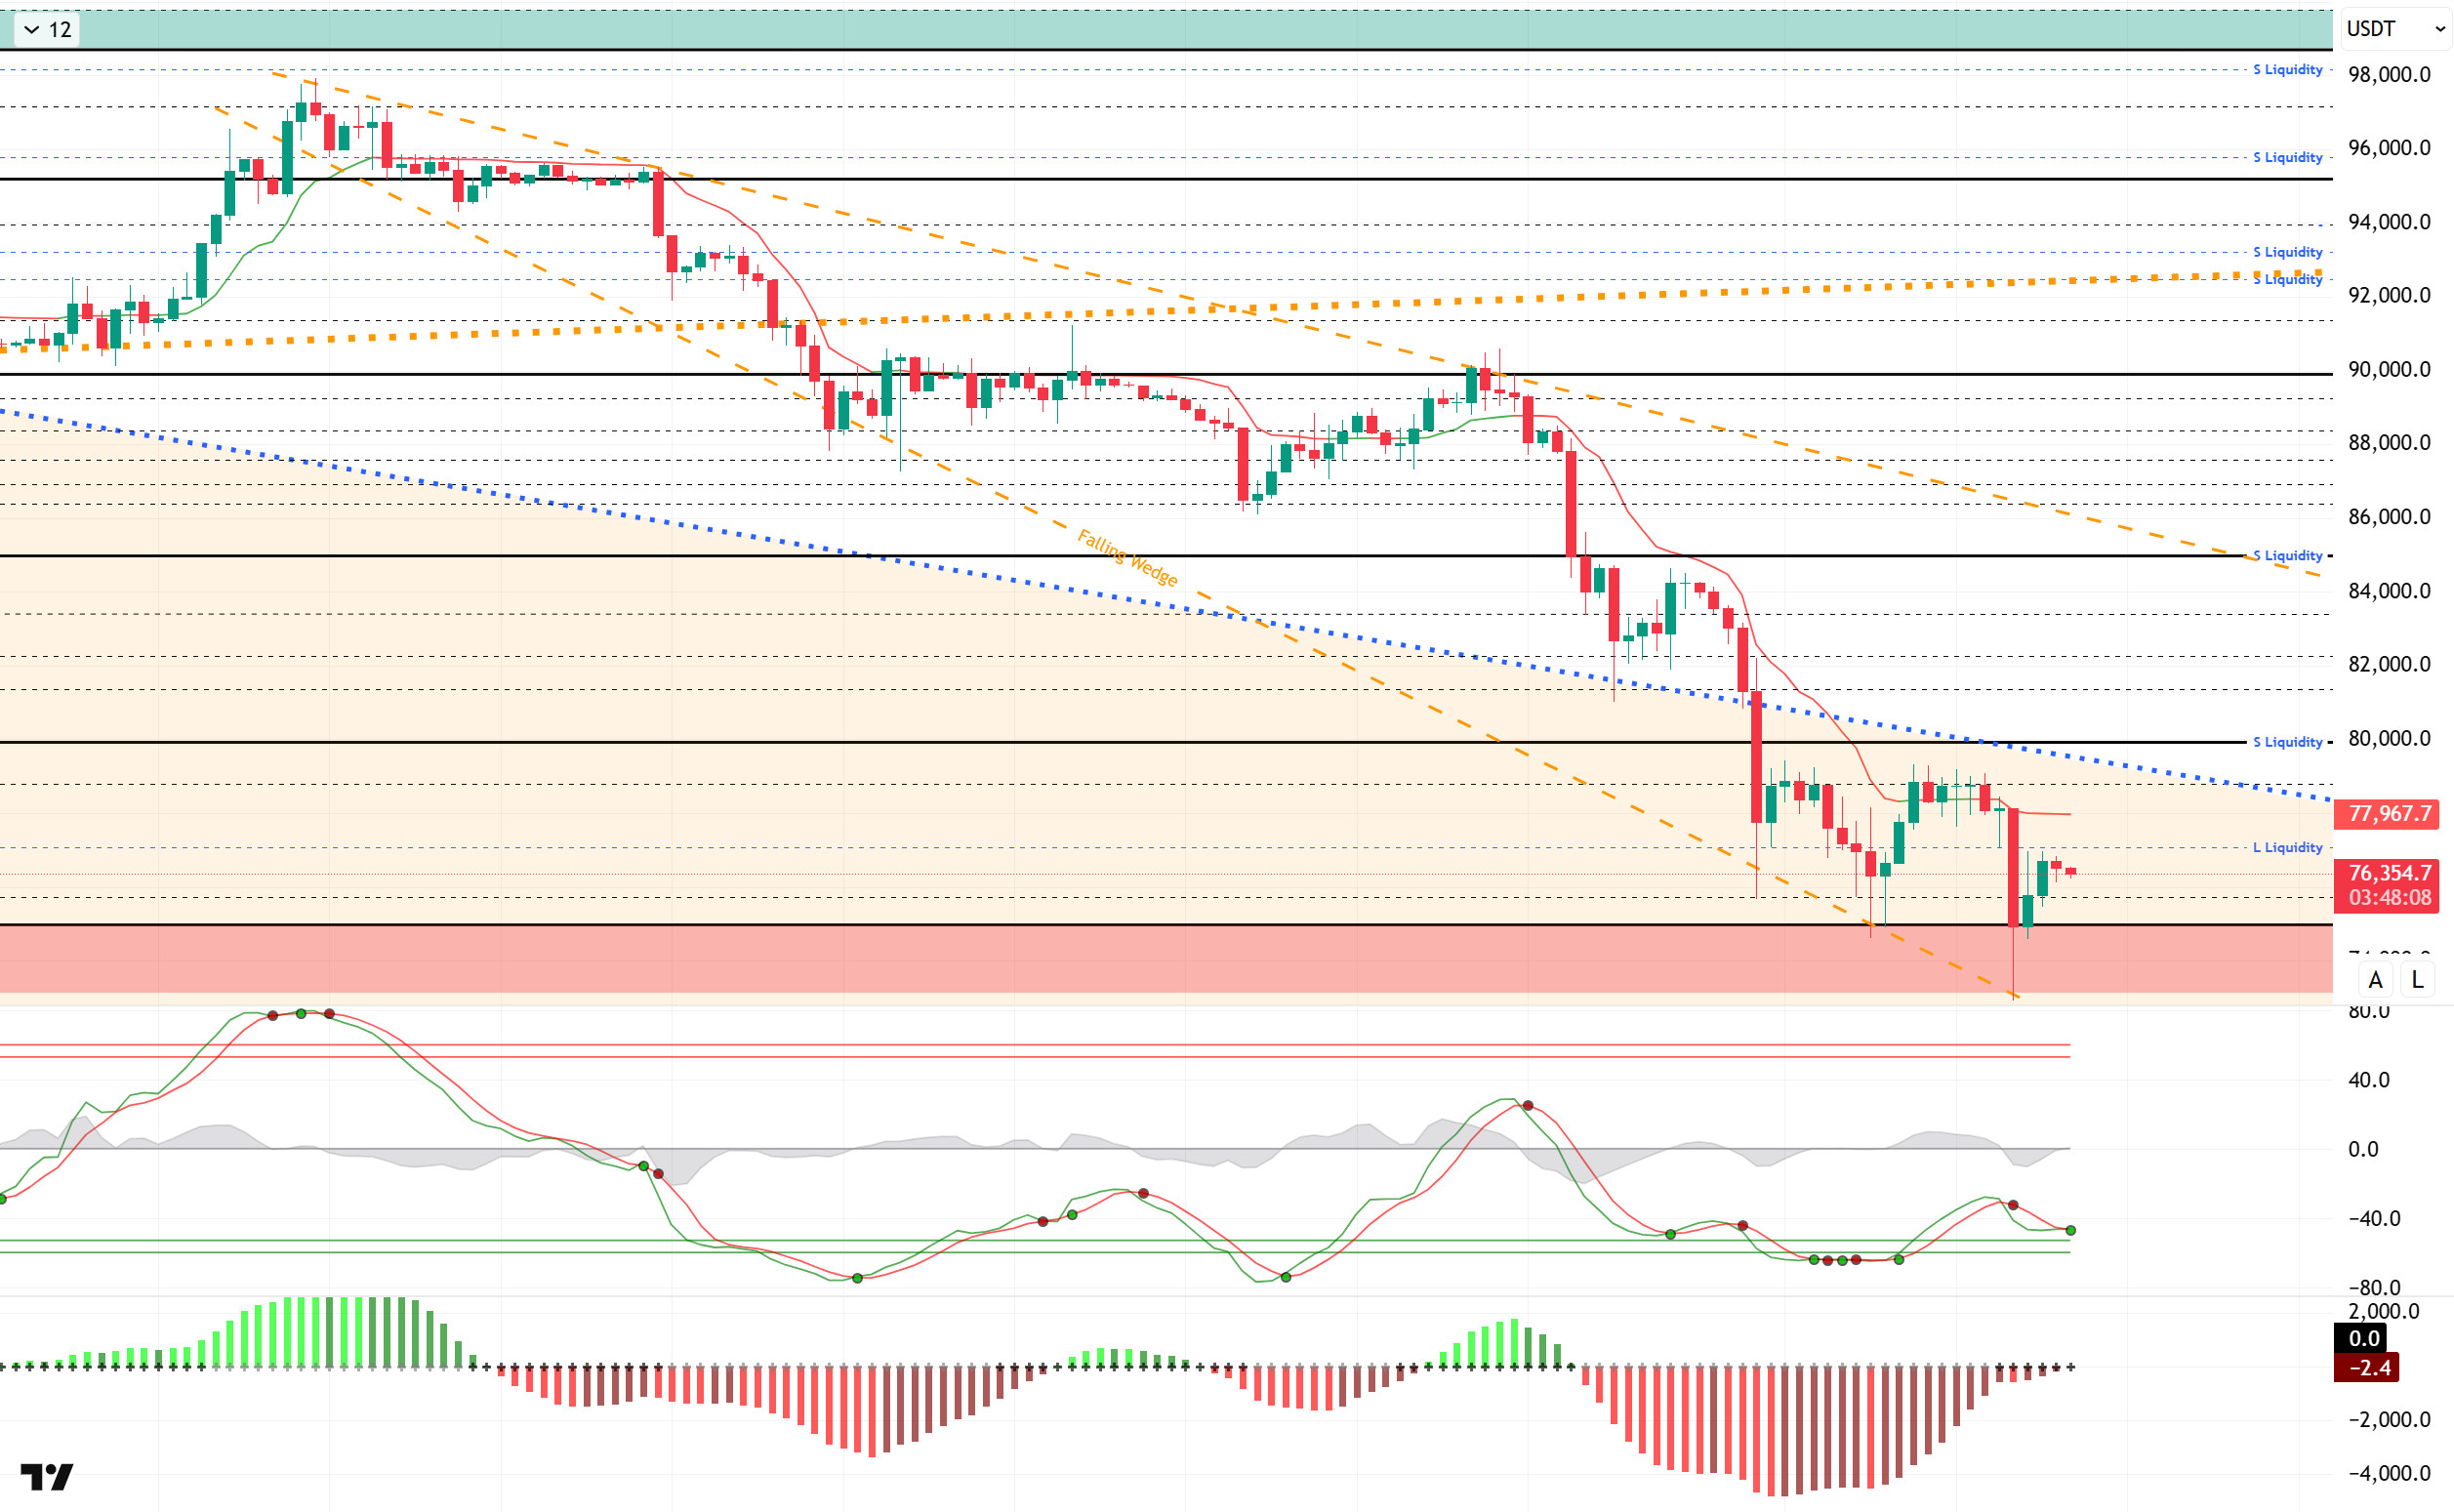
From a technical perspective, BTC failed to break above the 78,800 level in the previous analysis and once again faced strong selling pressure. The price, which touched the lower line of the descending wedge, lost the 75,000 reference level and fell below the 73,000 level. Here, BTC, which recorded price movements in a short period of time, quickly recovered and returned to the 77,000 level. The price, which struggled to move upward with the shortening body candles we mentioned in recent analyses, broke down. We will follow BTC’s attempt to break above the 78,800 level, as it is expected to recover again in the next phase.
Technical indicators confirmed the price decline by giving a sell signal above the oversold zone of the Wave Trend (WT) oscillator. It is currently giving a buy signal. The histogram on the Squeeze Momentum (SM) indicator is preparing to move into positive territory. The Kaufman Moving Average (KAMA) is currently trading just above the price level at $77.966.
When examining liquidation data, buy orders were liquidated in the short term within the 76,000–77,000 range. Investors who took advantage of the recent decline formed buy clusters at the 74,400 level. The selling level has increased its intensity in the short term within the 78,000 – 79,000 range and in the medium term within the 85,000 – 86,000 range. In the long term, the intensity of positions continues above the 91,000 level.
In summary, the partial government shutdown in US domestic affairs has ended. In foreign affairs, tensions with Iran have escalated with air strikes. Similarly, air strikes have taken place on the Russia-Ukraine front. Looking at liquidity data, while buying levels are being redefined, selling levels remain intense. Technically, BTC started the new year with positive momentum, but after testing the 98,000 level, it entered a new wave of selling pressure with profit-taking, falling back to the 73,000 level. Following this movement, it closed all months after September in the red. BTC, which started February with a decline, continues to trade within the critical range of 75,000 – 80,000.These levels stand out as a decision-making and discovery zone in terms of price. From this point onward, a rebound will be monitored, with the aim of regaining and holding above the 80,000 level. Otherwise, in a new wave of selling, the 75,000 reference level emerges as the price’s last area of support.
Support levels: 75,000 – 73,500 – 71,000
Resistances: 78,800 – 80,000 – 81,000
ETH/USDT
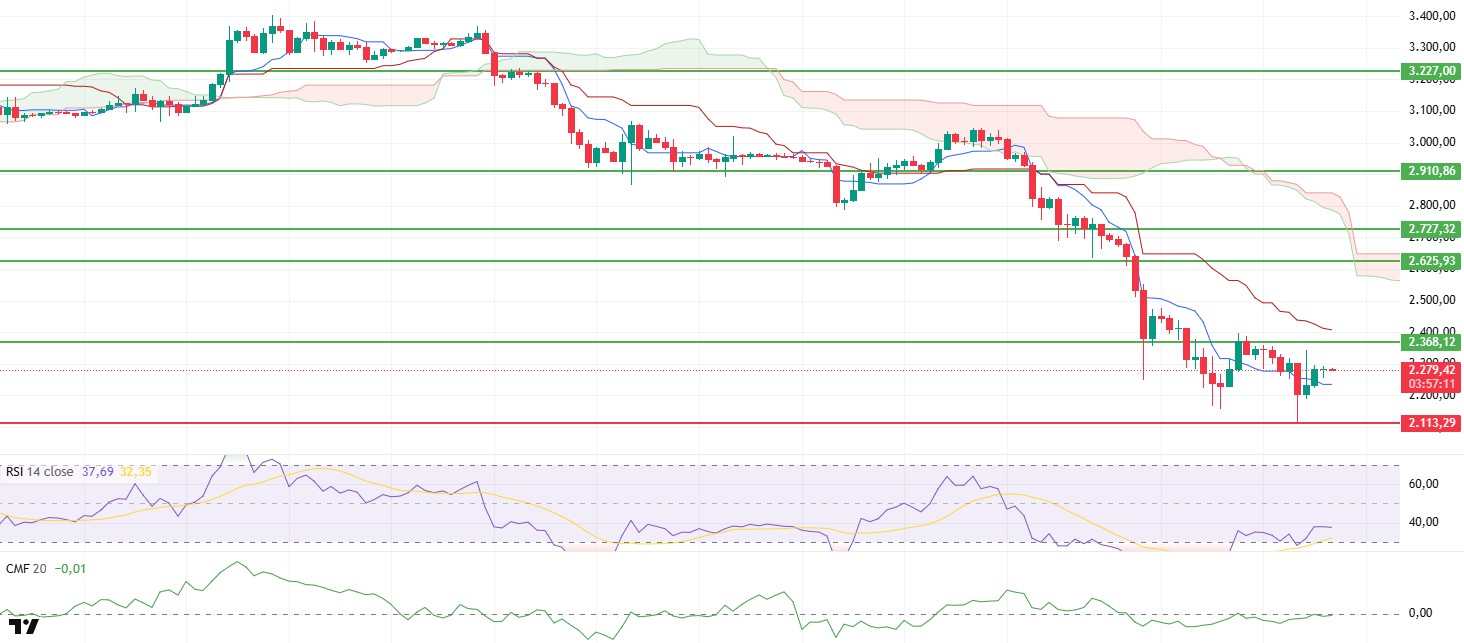
The ETH price retreated to the critically important $2,113 support level yesterday evening. The impact of buying at this level slowed the decline, and the price showed signs of recovery towards the $2,300 region. This movement reveals that buyers have stepped in at the main support area, while also showing that the market remains in a fragile equilibrium. Although an upward push is visible, it is still too early to say that the price has clearly established its direction.
There is a partial easing on the liquidity side. The Chaikin Money Flow (CMF) indicator rose to the zero line, signaling that liquidity outflows have ceased. This structure suggests that selling pressure has slowed for now and the market is beginning to catch its breath. However, the fact that the CMF has not clearly moved into positive territory indicates that the uptrend has not yet fully established itself on solid ground.
There is a limited recovery on the momentum front. The Relative Strength Index (RSI) moved upward with support from the oversold threshold, indicating that selling pressure has eased somewhat. While this improvement strengthens the possibility of a short-term rebound, momentum is not yet at a level that confirms a strong trend reversal. A clearer strengthening on the RSI side is needed to say that buyers have fully taken control.
The outlook on the Ichimoku indicator remains largely unchanged. Although the price has managed to stay above the Tenkan level, the Kijun and Kumo cloud have not yet been regained. Therefore, even if there is a short-term relief, the main trend continues to signal downward movement. If upward movements occur, these technical levels may act as resistance.
The overall focus remains unchanged. A test of the $2,368 level is expected, and a clear break above this region could strengthen upward momentum. Conversely, $2,113 s maintaining its key support position, and a drop below this level could bring the risk of renewed sharp selling back into focus. In the short term, the direction remains dependent on price reactions at these two critical levels.
Supports: 2.113 – 1.958 – 1.756
Resistances: 2,368 – 2,625 – 2,727
XRP/USDT
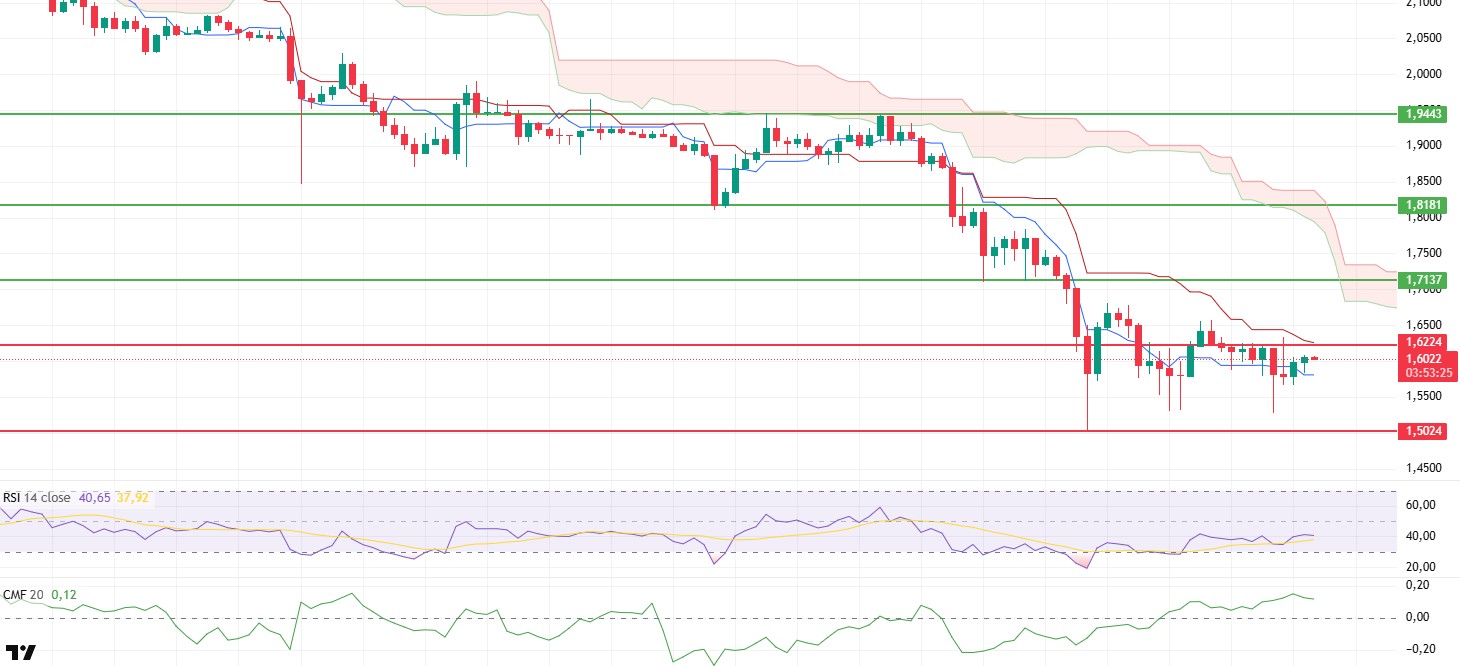
The XRP price retreated to $1.52 yesterday evening as selling pressure increased. Buying at this level prevented the decline from deepening further, and the price rebounded towards the $1.60 range. The structure that formed at the end of the day shows that sellers are exerting pressure, but buyers have not completely retreated from the lower support zone. The market has yet to establish a clear direction, and the search for equilibrium continues in the short term.
Liquidity remains more resilient compared to price movements. The Chaikin Money Flow (CMF) continues to maintain its upward trajectory in positive territory. This suggests that money continues to flow into the market and that the decline is not entirely supported by panic selling. However, the current liquidity flow does not appear aggressive enough to drive the price into a strong uptrend. The groundwork for an uptrend has not been completely lost, but a clear force capable of creating a trend reversal has not yet emerged.
There is no significant recovery on the momentum side. The Relative Strength Index (RSI) continues to remain flat in weak territory, similar to previous days. Although selling pressure appears to have balanced out somewhat, it cannot be said that buyers have taken control yet. For a healthier upward movement, a clearer strengthening on the RSI side is needed.
The picture hasn’t changed much from the Ichimoku indicator perspective. While the price continues to move around Tenkan in the short term, Kijun and the kumo cloud haven’t been regained yet. Therefore, the technical structure still points more to a reaction and balancing process. Breaking these levels is necessary to say that the main trend has turned positive.
The critical thresholds remain unchanged in the overall outlook. If sustainability above $1.62 can be achieved, the price may attempt to test the $1.71 resistance level again. Conversely, a break below the $1.50 level could intensify selling pressure and lead to a deeper decline.
Supports: 1.5024– 1.4119 – 1.2540
Resistances: 1.6224 – 1.7137 – 1.8181
SOL/USDT
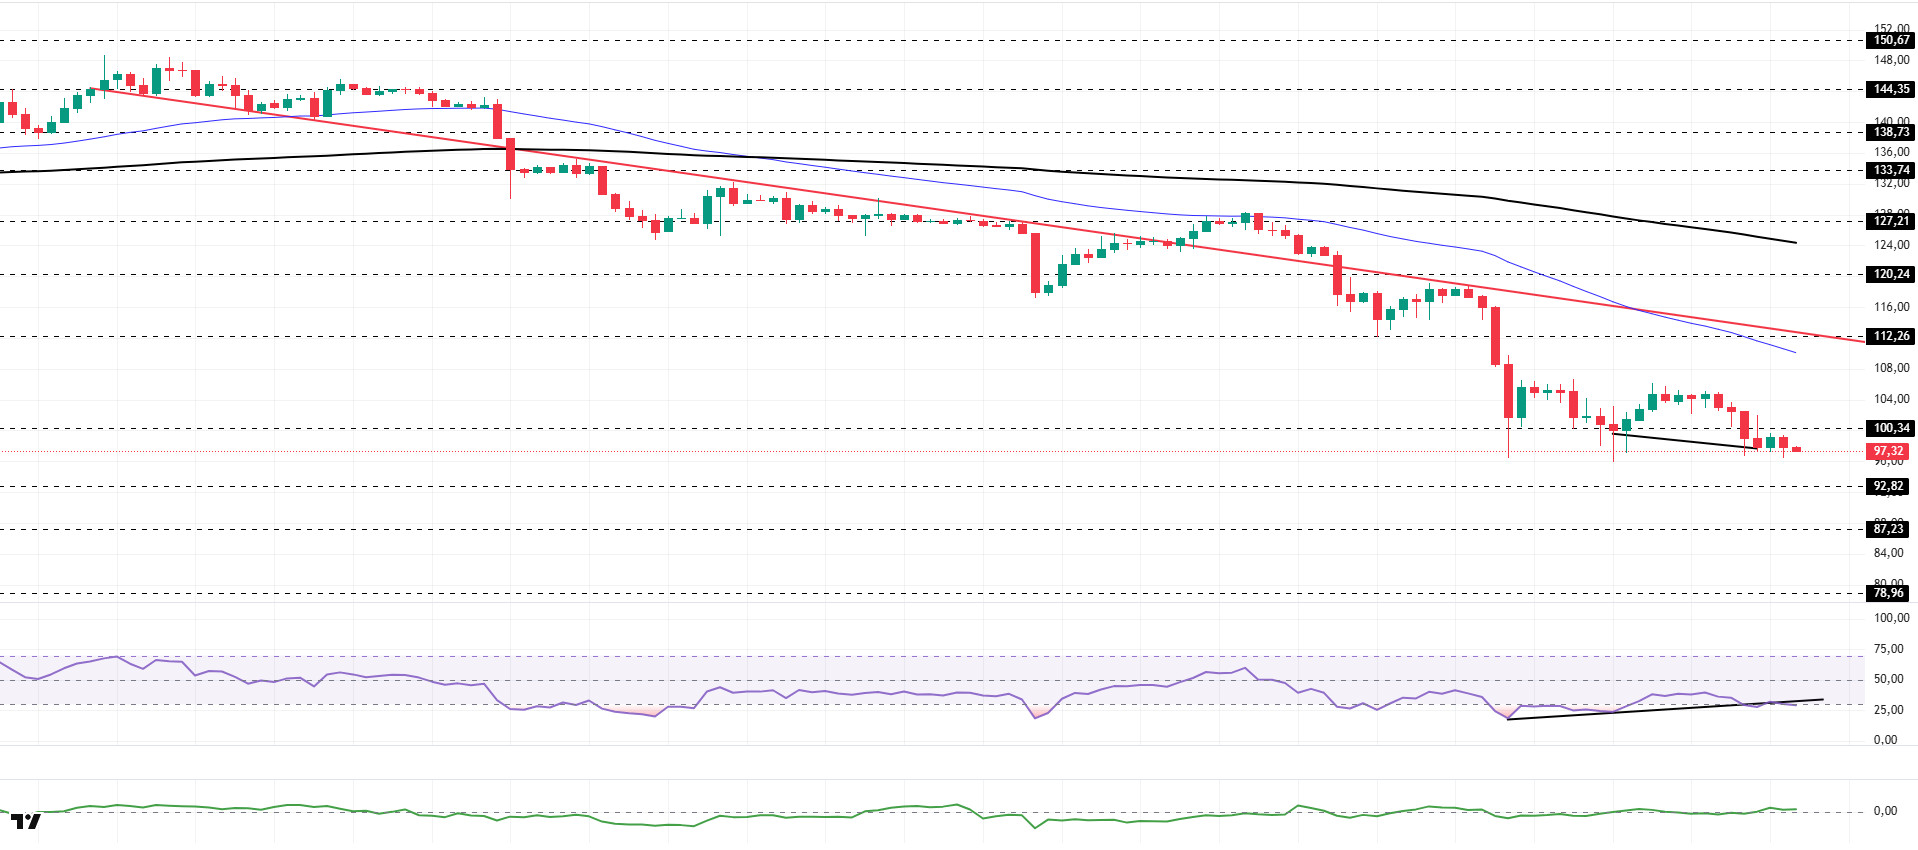
The SOL price experienced a pullback. The asset remained in the lower region of the downward trend that began on January 13, signaling continued selling pressure. As of now, the price has moved below the strong support level of $100.34 and may test the $92.82 level as support if the pullback continues. If the price closes above $100.34, the $112.26 level should be monitored.
On the 4-hour chart, the 50 EMA (Exponential Moving Average – Blue Line) continues to remain below the 200 EMA (Black Line). This situation indicates that a downtrend may begin in the medium term. At the same time, the price being below both moving averages shows that the asset is trending downward in the short term. The Chaikin Money Flow (CMF-20) has risen from neutral to positive territory. However, increased inflows of money may keep the CMF here. The Relative Strength Index (RSI-14) has fallen from the middle of negative territory to oversold territory. This could bring profit-taking. At the same time, it has moved to the lower region of the rising line on January 31. This could create selling pressure. On the other hand, positive divergence should be monitored. If there is an uptrend due to macroeconomic data or positive news related to the Solana ecosystem, the $120.24 level stands out as a strong resistance point. If this level is broken upwards, the uptrend is expected to continue. If pullbacks occur due to developments in the opposite direction or profit-taking, it may test the $87.23 level. If it retreats to these support levels, an increase in buying momentum may present a potential upside opportunity.
Supports: 92.82 – 87.23 – 78.96
Resistances: 100.34 – 112.26 – 120.24
DOGE/USDT
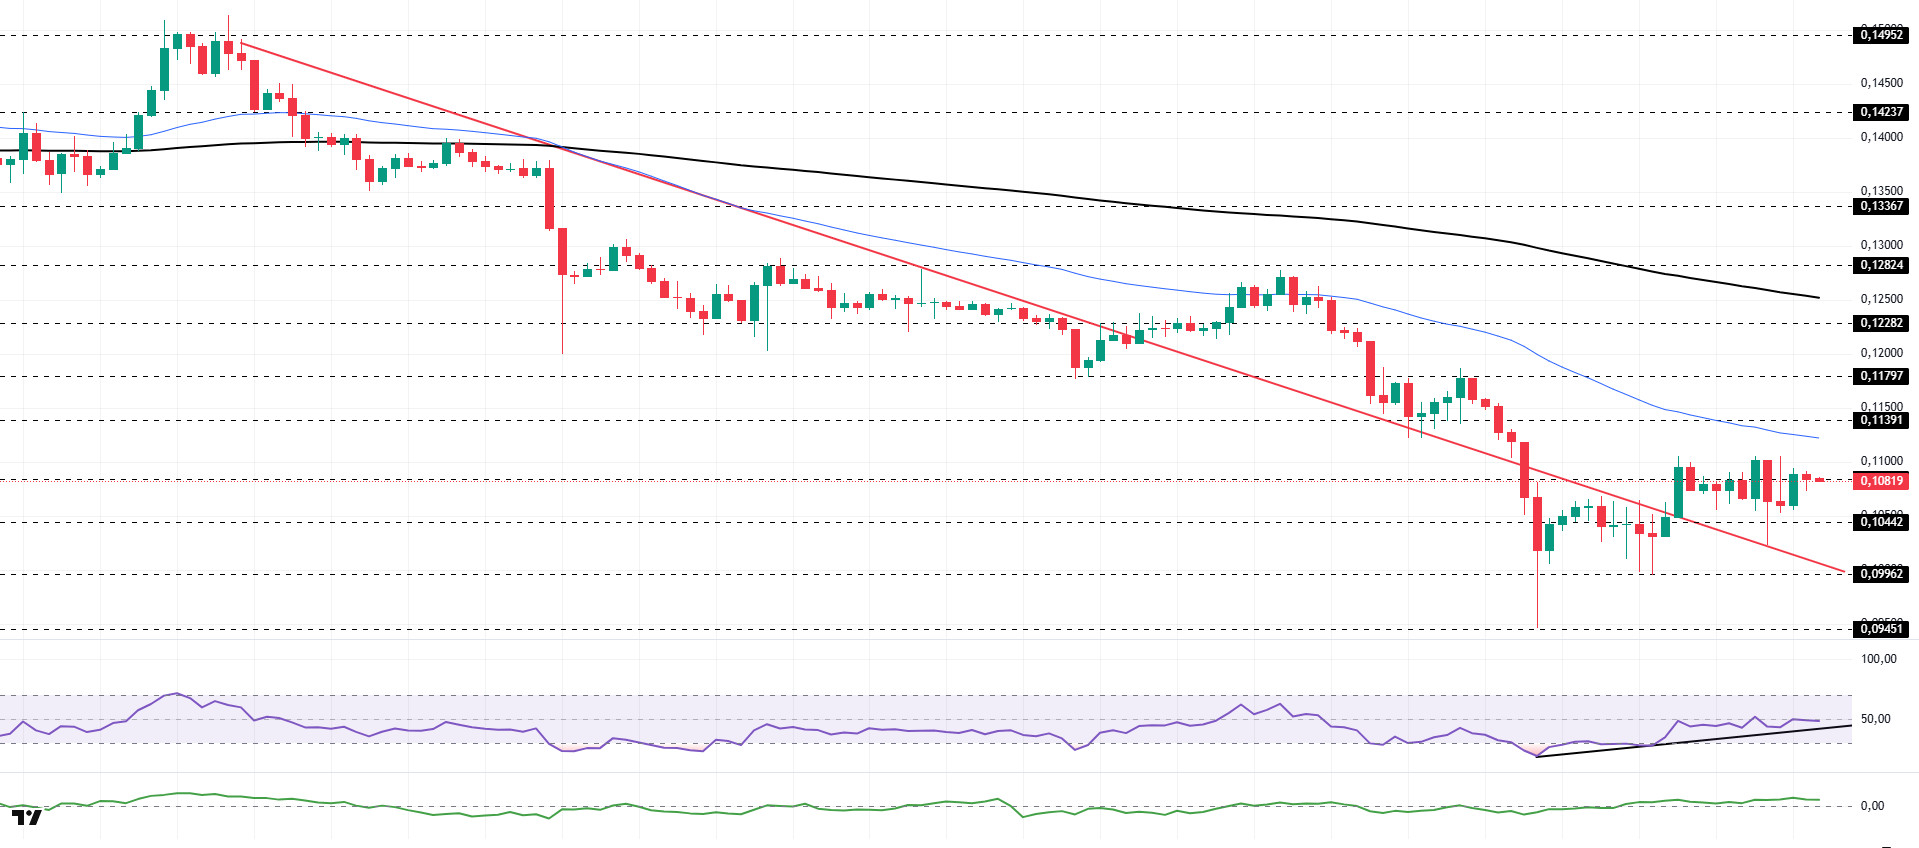
The DOGE price traded sideways. The asset remained in the upper region of the downtrend that began on January 14, signaling that buying pressure could build. Finding support from the downtrend, which is a strong support level, the asset accelerated and showed an upward trend. Currently holding above the strong support level of $0.10837, the price may test the 50 EMA (Blue Line) moving average as resistance if the uptrend continues. In case of a pullback, it may test the descending trend line as support.
On the 4-hour chart, the 50 EMA (Exponential Moving Average – Blue Line) remained below the 200 EMA (Black Line). This indicated a downtrend forming in the medium term. The price being below both moving averages suggests that the price may be trending downward in the short term. The Chaikin Money Flow (CMF-20) remained in positive territory. Additionally, an increase in money inflows could keep the CMF in positive territory. The Relative Strength Index (RSI-14) rose from negative territory to neutral levels. At the same time, it maintained its position in the upper region of the upward trend that began on January 31, indicating that buying pressure could build. In the event of an uptrend driven by political developments, macroeconomic data, or positive news flow in the DOGE ecosystem, the $0.11797 level stands out as a strong resistance zone. Conversely, in the event of negative news flow, the $0.09071 level could be triggered. A decline to these levels could increase momentum and initiate a new wave of growth.
Supports: 0.10837 – 0.10442 – 0.09962
Resistances: 0.11391 – 0.11797 – 0.12282
TRX/USDT
Tron Inc. announced in a post this morning that it purchased 176,063 TRX at an average price of $0.28, bringing its total holdings to over 679.8 million TRX. The company stated in its announcement that it aims to further increase its Tron holdings to boost share value in the long term.
As of February 3, 2026, the total amount of TRX staked is 46,190,526,307, representing 48.77% of the circulating supply. Compared to the previous day, there has been an increase of approximately 0.1% in the amount staked. Meanwhile, the market value of TRX has reached $27.1 billion. Furthermore, a total of 3,940,413 TRX was burned yesterday, permanently removing 24,701 TRX from the circulating supply. This is leading to a decrease in inflationary pressure on Tron.
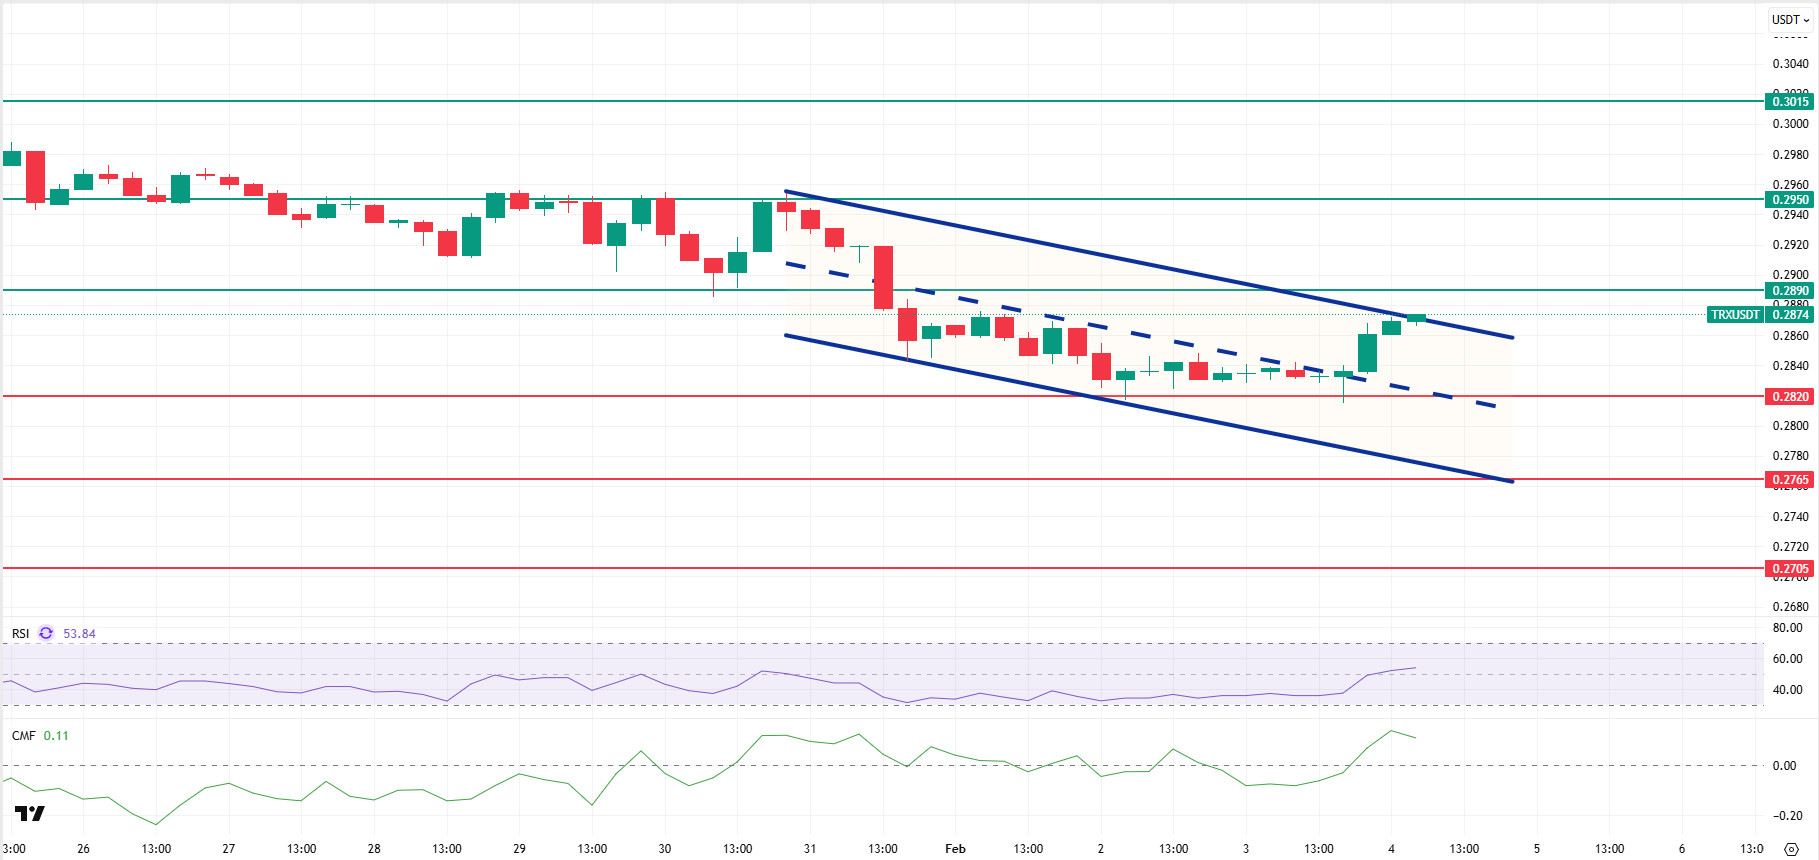
Technically speaking, TRX closed yesterday at 0.2861 after the rise, gained some more value in the morning hours, and is currently trading at 0.2874. Currently in the upper band of the bearish channel, TRX is priced below the 0.2890 resistance on the 4-hour chart. The Relative Strength Index (RSI) value is seen at 53 in the neutral zone. In addition, the Chaikin Money Flow (CMF) indicator value is 0.11 above the zero zone, indicating that money inflows have started to increase. The current picture points to buying gaining strength and the possibility of the price moving upward in the short term.
In light of all these indicators, TRX may attempt to break the upper band of the channel by rising slightly in the first half of the day, given its current zone and CMF value. It could then test the 0.2890 resistance level. A candle close above the 0.2890 resistance level could signal a continuation of the uptrend, potentially testing the 0.2950 resistance level. If it fails to close above the 0.2890 resistance level and the CMF indicator also moves into negative territory, it may fall slightly due to the resulting selling pressure and test the 0.2820 support level. On the 4-hour chart, 0.2705 is an important support level, and as long as it remains above this level, the possibility of an upward movement is maintained. If this support level is broken, selling pressure is expected to increase.
Supports: 0.2820 – 0.2765 – 0.2705
Resistances: 0.2890 – 0.2950 – 0.3015
Legal Notice
The investment information, comments, and recommendations contained herein do not constitute investment advice. Investment advisory services are provided individually by authorized institutions taking into account the risk and return preferences of individuals. The comments and recommendations contained herein are of a general nature. These recommendations may not be suitable for your financial situation and risk and return preferences. Therefore, making an investment decision based solely on the information contained herein may not produce results in line with your expectations.

