
BTC/USDT
While Fed officials maintained their stance that there should be no rush to cut interest rates, a cautious tone emerged, highlighting the trajectory of inflation and risks in the labor market. In the US, Trump’s bold statements regarding the Dow Jones brought the risk of rhetoric ahead of the election back into focus, while in Japan, the ruling coalition’s strong election victory signaled that current economic and monetary policies would continue. In the Middle East, the lack of concrete progress in US-Iran talks and the hardening of sanctions rhetoric kept geopolitical risk premiums high, while tensions and attacks continued on the ground in the Russia-Ukraine war despite the goal of a resolution by the summer.
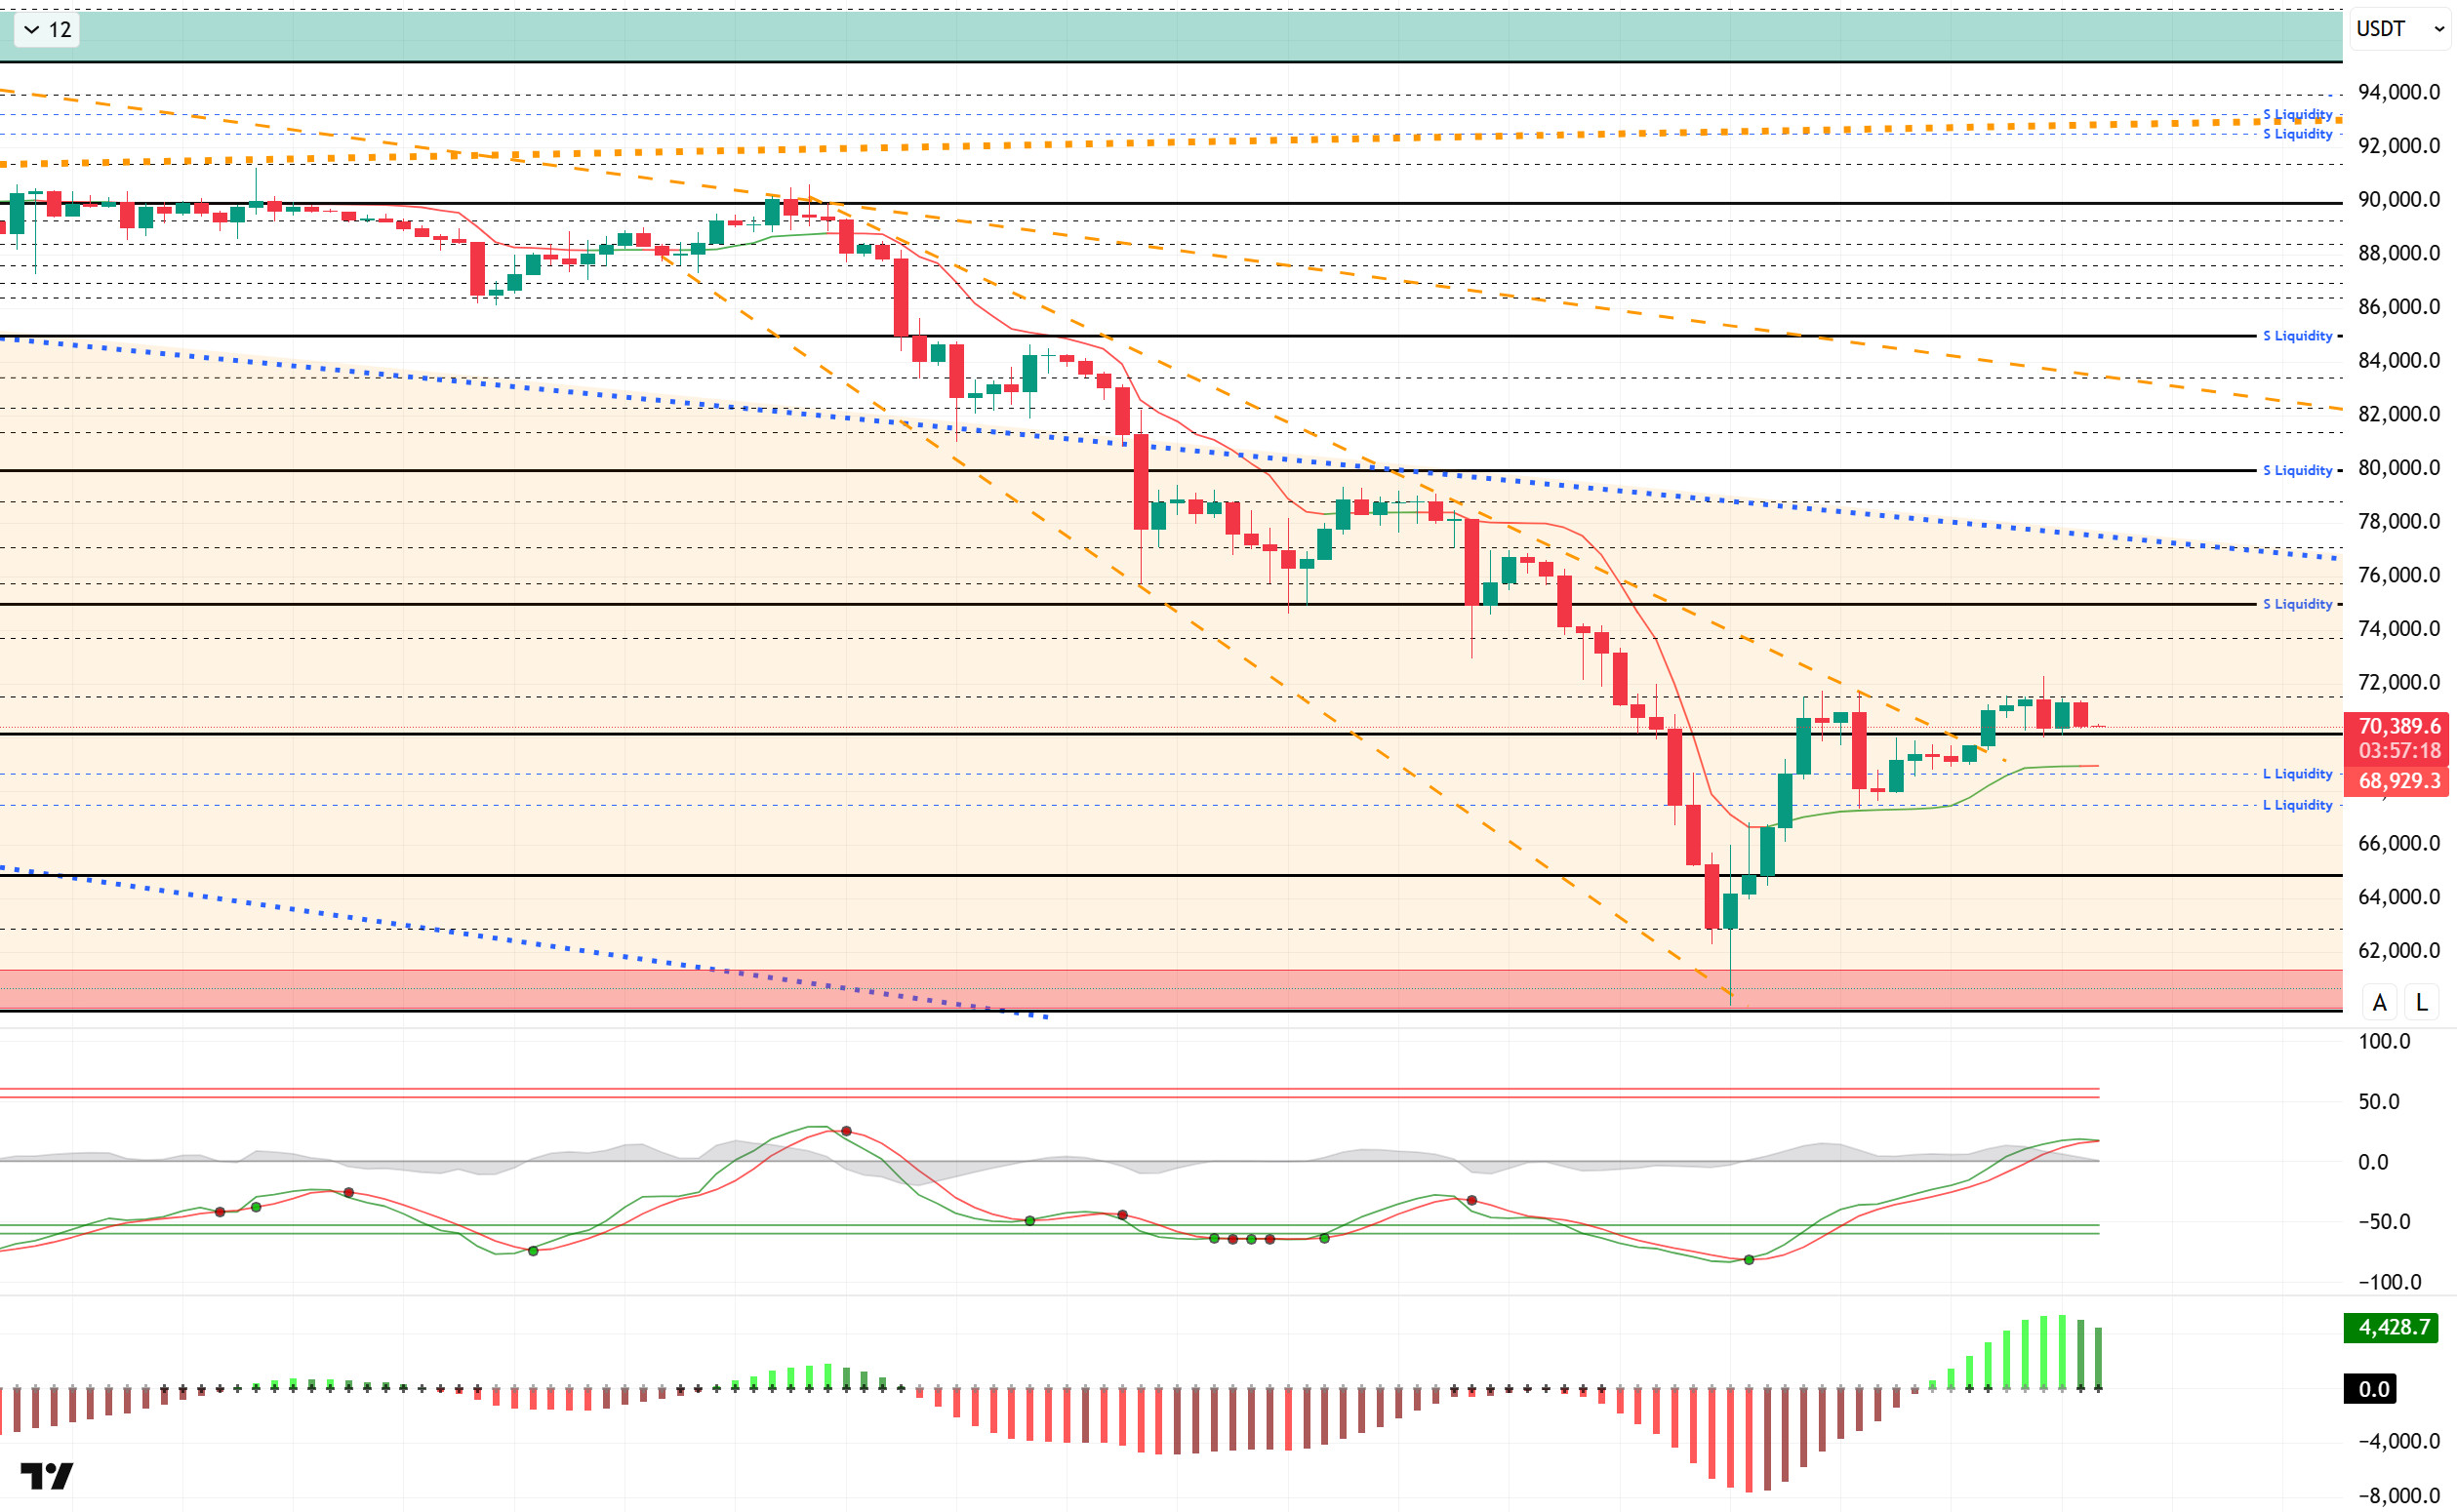
From a technical perspective, BTC managed to recover somewhat after hitting a low of $60,000 for the first time in years. With this recovery, the price, which exceeded $70,000, appears to be attempting to hold steady at this level. Although BTC occasionally surpassed the 71,000 level, it has yet to gain momentum here. While the price breaking the falling wedge pattern could lead to a “V”-shaped recovery, a loss of the critical 70,000 level and closing below it could result in a “W” pattern. This scenario would be followed by a double bottom formation.
Technical indicators show the Wave Trend (WT) oscillator giving a weak buy signal in the middle band of the channel, while the histogram on the Squeeze Momentum (SM) indicator is weakening after moving into positive territory. The Kaufman moving average (KAMA) is currently trading below the price at $68,915.
When examining liquidation data, buy orders are being liquidated in the medium and long term, while accumulation has resumed above the bottom level of 60,000. In the short term, the liquidity zone is between 68,000 and 69,000, while the selling level was partially liquidated in the short term in the 72,000-73,000 band. In the medium term, the 73,000-79,000 range stands out as an area of aggressive concentration.
In summary, while Fed officials remain unanimous on interest rate policy, Trump continues his pre-election rhetoric. On the geopolitical front, while no progress was made in the Iran talks, Trump described the talks as very good. Tensions continue on the Russia-Ukraine front, while Japan’s election victory resonated. After the buy orders were cleared in the liquidity data, the direction shifted to sell orders. Technically, BTC started the new year with positive momentum, but after testing the 98,000 level, it entered a sharp sell-off, falling to the 60,000 level. Following this movement, it closed all months after September in the red. BTC, which also started February with a decline, briefly lost the critical range of 70,000-80,000 levels and returned to its pre-Trump pricing. Having managed to recover from this point, the price is now attempting to hold above the 70,000 level. If this level is maintained, the price is expected to make a move towards the 75,000 level, while a downward break could see a double bottom formation.
Supports: 70,000 – 68,800 – 67,400
Resistances: 71,500 – 73,500 – 75,000
ETH/USDT
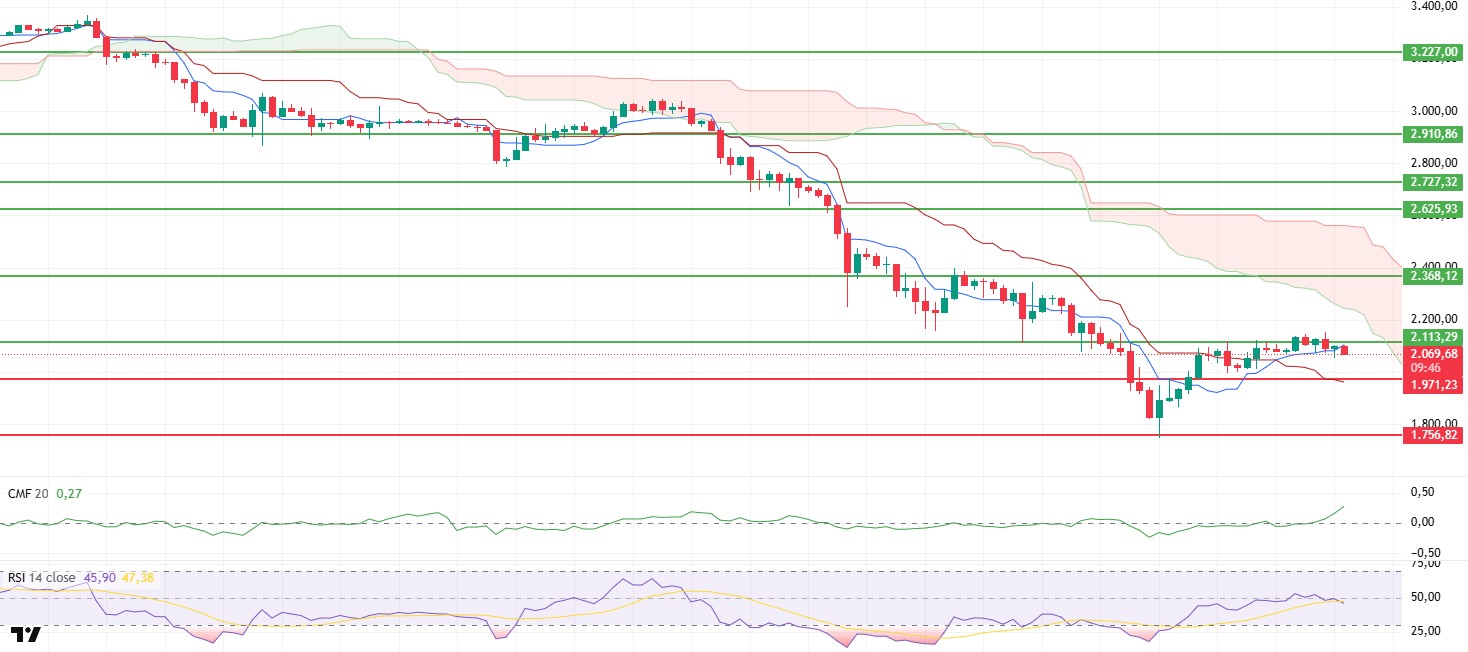
The ETH price remained under buyer control throughout the weekend, rising to the $2,150 level. This movement showed a clear recovery in the market following the sharp sell-off the previous week. However, after the weekly close, the price retreated again as the $2,113 level could not be maintained, easing back to around $2,070. The current outlook shows that the potential for a rebound continues, but critical resistances have not yet been permanently broken.
The liquidity picture has improved significantly. The Chaikin Money Flow indicator has moved into positive territory and continues its upward trend. This structure indicates increased capital inflows into the market and strengthened buying appetite in the spot market. Continued liquidity inflows could help solidify the ground for further upward attempts.
The momentum front is balanced. The Relative Strength Index is trading sideways at the 50 level. This indicates that selling pressure has largely subsided, but buyers have not yet been able to generate strong momentum. Without a clear upward acceleration in momentum, upward movements may be challenging at times.
On the technical side, the Ichimoku indicator presents a more constructive picture in the short term. The price rising above the Tenkan and Kijun levels and the Tenkan cutting the Kijun upward supports the short-term outlook positively. However, the price still remaining below the kumo cloud indicates that the main trend has not yet completely turned upward. Therefore, the current movement should be interpreted more as a strong rebound.
In the overall outlook, the first critical threshold for the day is again the $2.113 level. If this region is clearly exceeded, upward movement can be expected to continue. On the downside, the $1.971 level should be monitored as the main support point. Maintaining this level remains decisive for the validity of the short-term recovery scenario.
Supports: 1,971 – 1,756 – 1,539
Resistances: 2,113 – 2,368 – 2,625
XRP/USDT
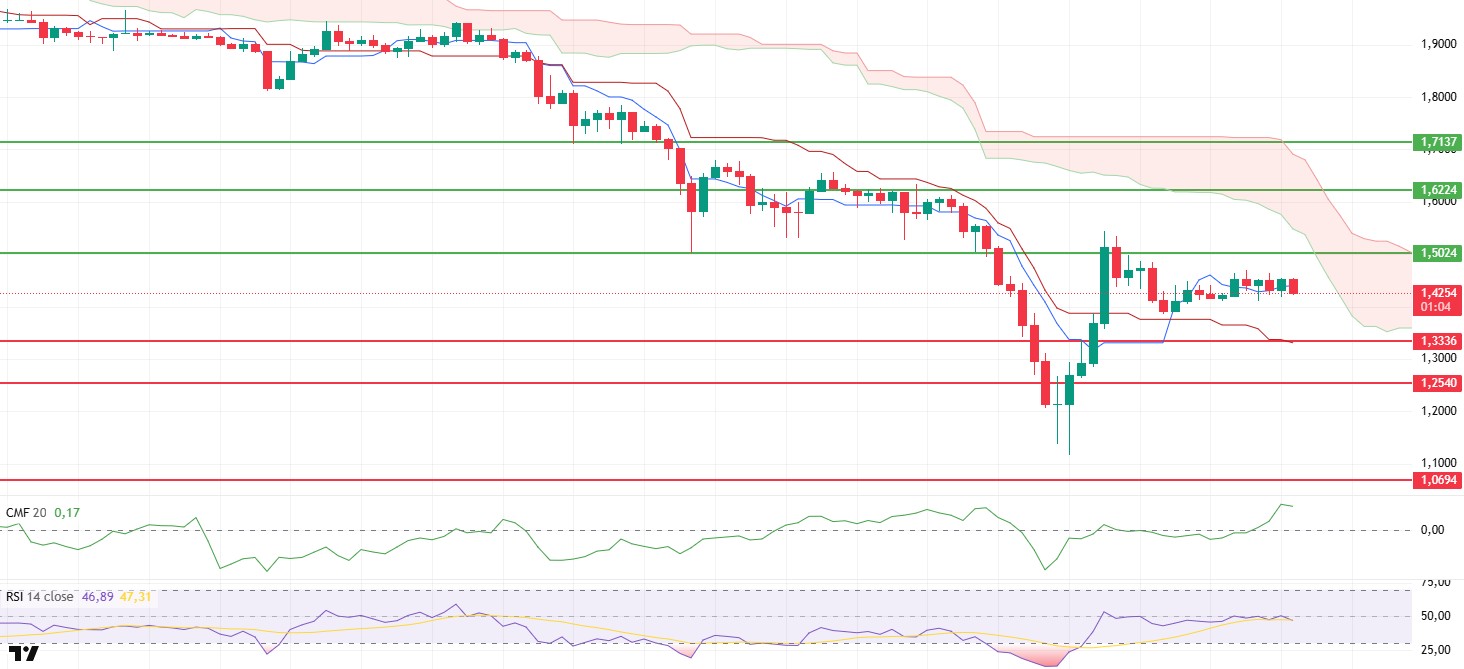
After successfully breaking through the $1.50 resistance level following Friday’s strong recovery, the XRP price experienced a limited pullback due to selling pressure from this region and settled into a horizontal equilibrium around $1.42 during the day. This trend indicates that buyers have not completely withdrawn from the market, but that pricing above $1.50 has not yet become sustainable. As the market continues to search for direction in the short term, the price appears to be stuck within a critical range.
The Chaikin Money Flow indicator is moving strongly upward in positive territory. This structure reveals that the money entering the market is accelerating and that buying appetite remains high on the spot side. The current liquidity outlook suggests that the upward attempts are not entirely a technical reaction and are based on more solid ground.
The Relative Strength Index continues to remain below the 50 level. This indicates that selling pressure has not completely disappeared and that momentum has not yet gained clear strength. For the upward movement to accelerate, it remains important to see a sustained move above 50 on the RSI.
On the technical side, the Ichimoku indicator is providing supportive signals in the short term. The price re-crossing the Tenkan and Kijun levels and the Tenkan cutting the Kijun upwards keeps the short-term outlook positive. However, the price still remaining below the kumo cloud indicates that the main trend has not yet completely turned upward. Therefore, the current movement should be interpreted more as a strong recovery process.
In the overall picture, the focus for the day is once again the $1.50 resistance. A clear break of this area could trigger a sharp upward movement and bring further gains to the agenda. On the downside, the $1.33 level ( ) is the main support, and maintaining this area remains critical for the health of the short-term structure.
Supports: 1.3336– 1.2540 – 1.0694
Resistances: 1.5024 – 1.6224 – 1.7137
SOL/USDT
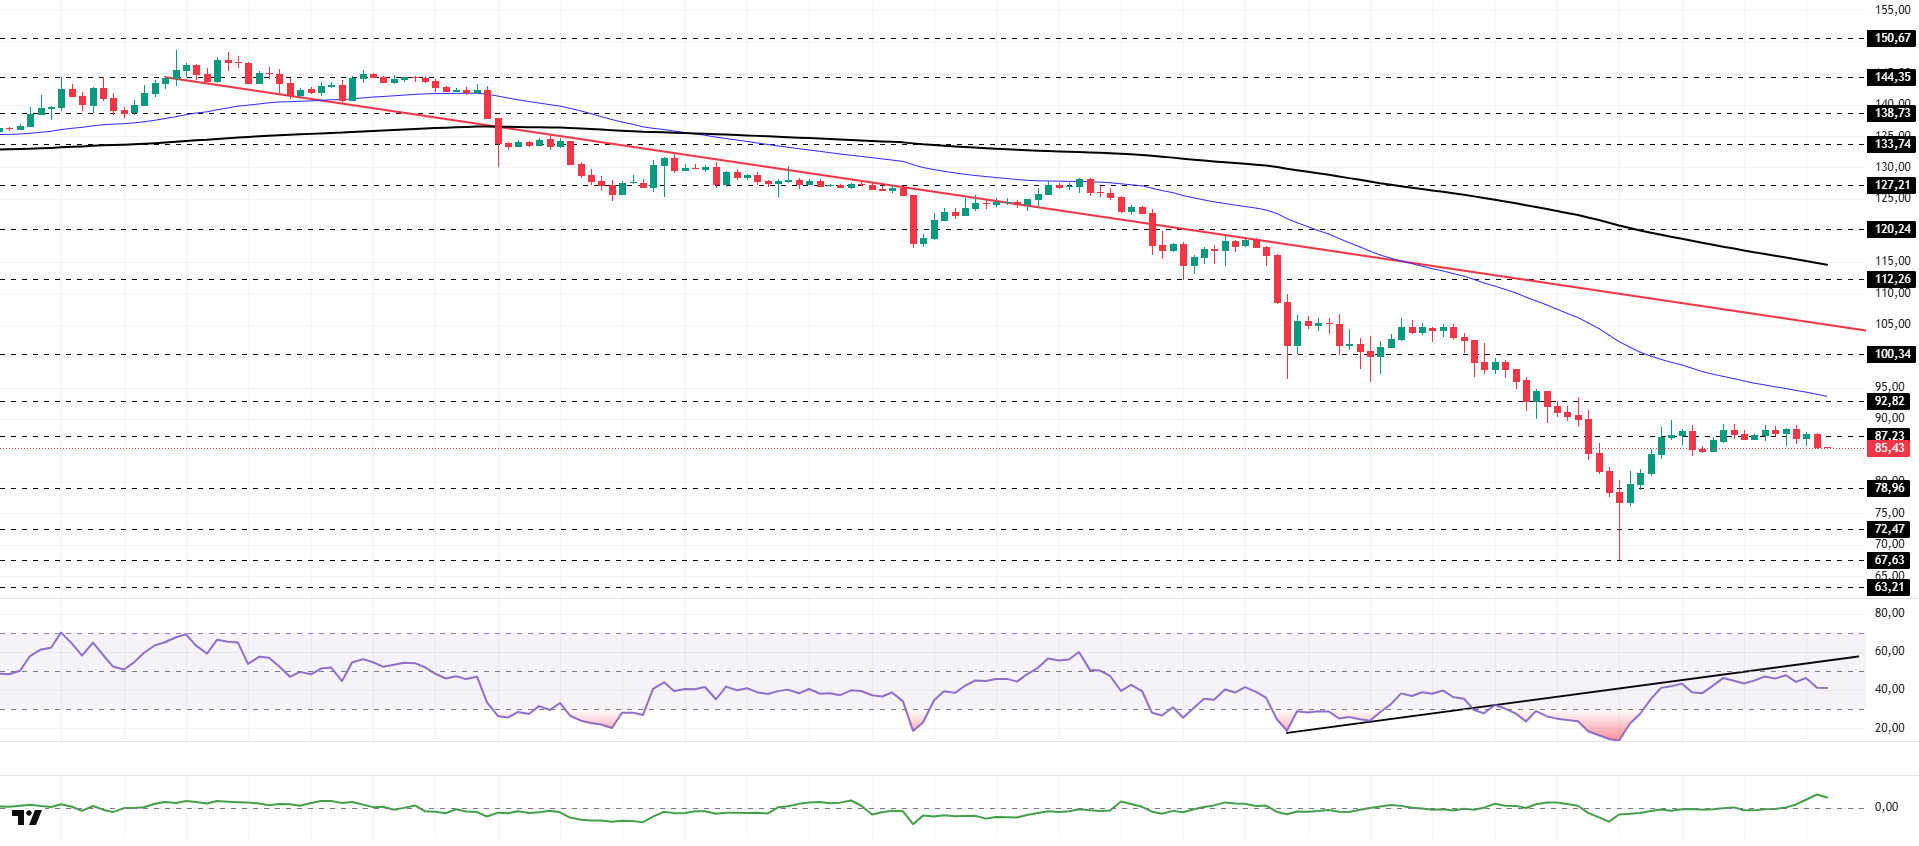
The SOL price continues its sideways movement. The asset remained below the downward trend line that began on January 13, indicating continued selling pressure. Finding support at the strong support level of $67.63, the price gained momentum and rose from there. The price, stuck between the strong resistance level of the 50 EMA (Blue Line) moving average and the $87.23 level, may act as a resistance level if the uptrend continues. If the pullback occurs again, the $78.96 level should be monitored.
On the 4-hour chart, the 50 EMA (Exponential Moving Average – Blue Line) remains below the 200 EMA (Black Line). This indicates that the medium-term downtrend continues. At the same time, the price being below both moving averages shows that the asset is trending downward in the short term. The Chaikin Money Flow (CMF-20) has moved into positive territory. However, a decrease in money inflows could push the CMF into negative territory. The Relative Strength Index (RSI-14) rose from oversold territory to the neutral level of negative territory. At the same time, it remained below the rising line on January 31. This signaled that selling pressure continued. If there is an uptrend due to macroeconomic data or positive news related to the Solana ecosystem, the $100.34 level stands out as a strong resistance point. If this level is broken upwards, the uptrend is expected to continue. If there are pullbacks due to developments in the opposite direction or profit-taking, it could test the $72.47 level. A decline to these support levels could increase buying momentum, presenting a potential upside opportunity.
Supports: 78.96 – 72.47 – 67.63
Resistances: 87.23 – 92.82 – 100.34
DOGE/USDT
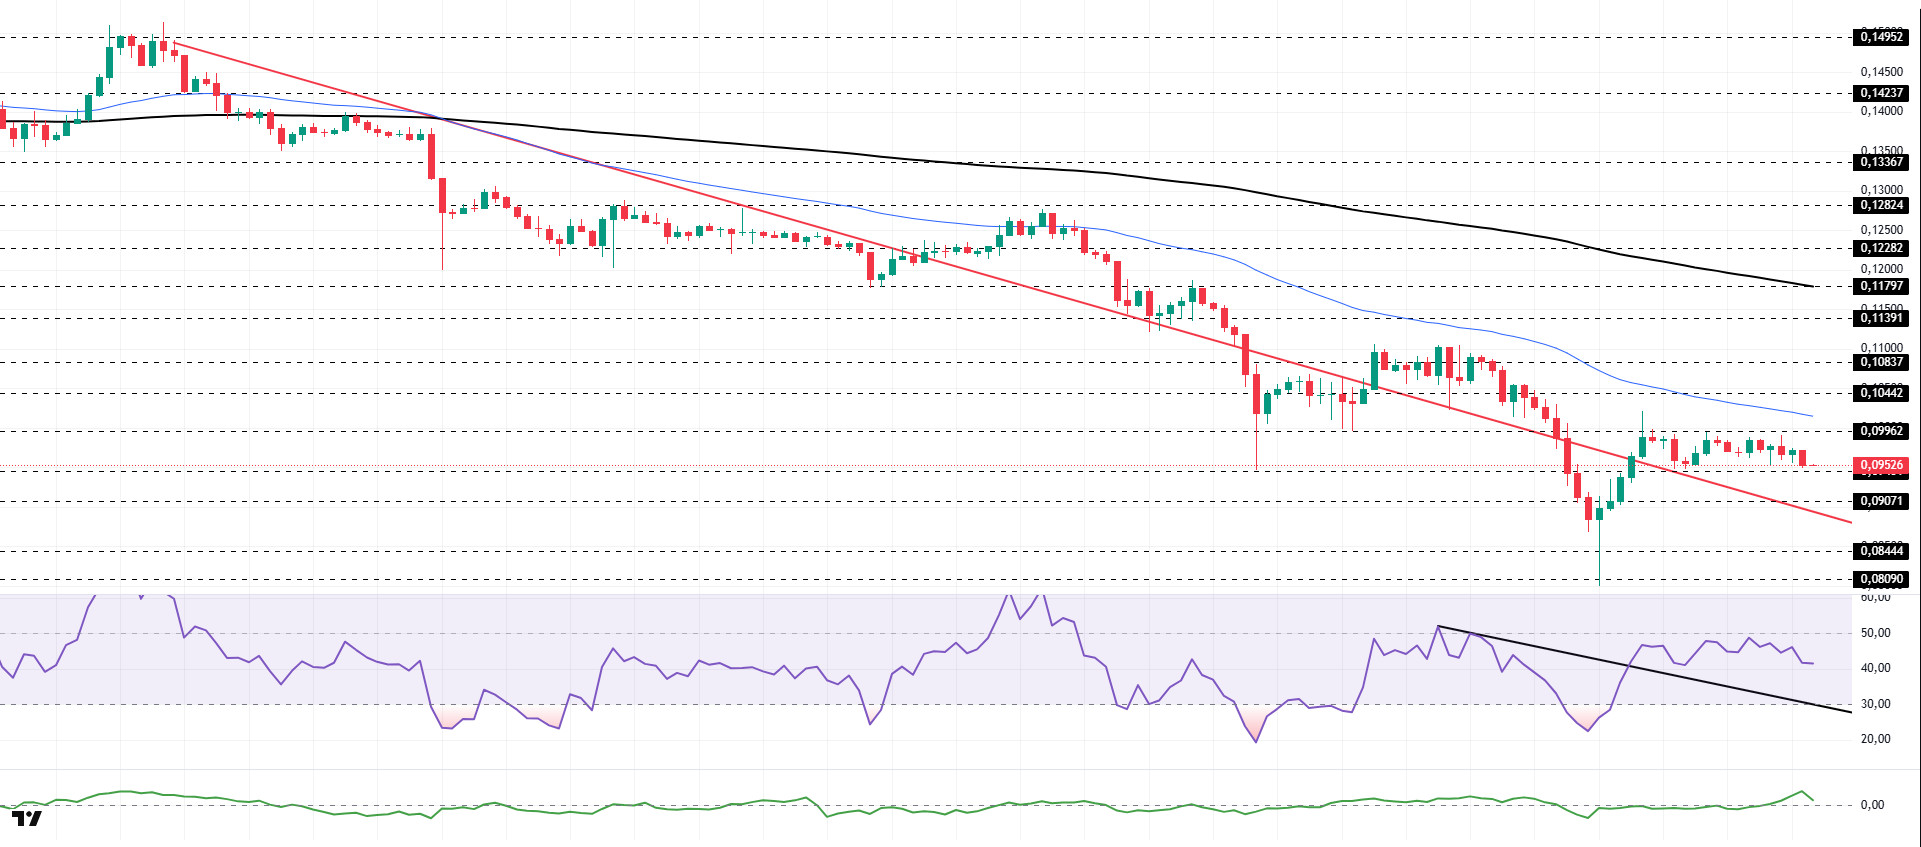
The DOGE price experienced an uptrend. The asset moved into the upper region of the downtrend that began on January 14, signaling buying pressure. Gaining momentum from the strong support level of $0.08090, the asset is currently trading in a narrow range between the downtrend and the 50 EMA (Blue Line) moving average. The $0.11391 level could act as resistance if candles close above the 50 EMA moving average. If the pullback continues, the downward trend should be monitored.
On the 4-hour chart, the 50 EMA (Exponential Moving Average – Blue Line) remained below the 200 EMA (Black Line). This indicated a downtrend forming in the medium term. The price being below both moving averages suggests that the price may continue to decline in the short term. The Chaikin Money Flow (CMF-20) moved into positive territory. Additionally, the balance of money inflows and outflows may keep the CMF in positive territory. The Relative Strength Index (RSI-14) rose from the oversold zone to near the neutral level of the negative zone. At the same time, it continued to remain in the upper region of the downward trend that began on February 3, indicating a decrease in selling pressure. In the event of potential increases driven by political developments, macroeconomic data, or positive news flow within the DOGE ecosystem, the $0.11797 level stands out as a strong resistance zone. Conversely, in the event of negative news flow, the $0.08090 level could be triggered. A decline to these levels could increase momentum and initiate a new wave of growth.
Supports: 0.09451 – 0.09071 – 0.08444
Resistances: 0.09962 – 0.10442 – 0.10837
SUI/USDT
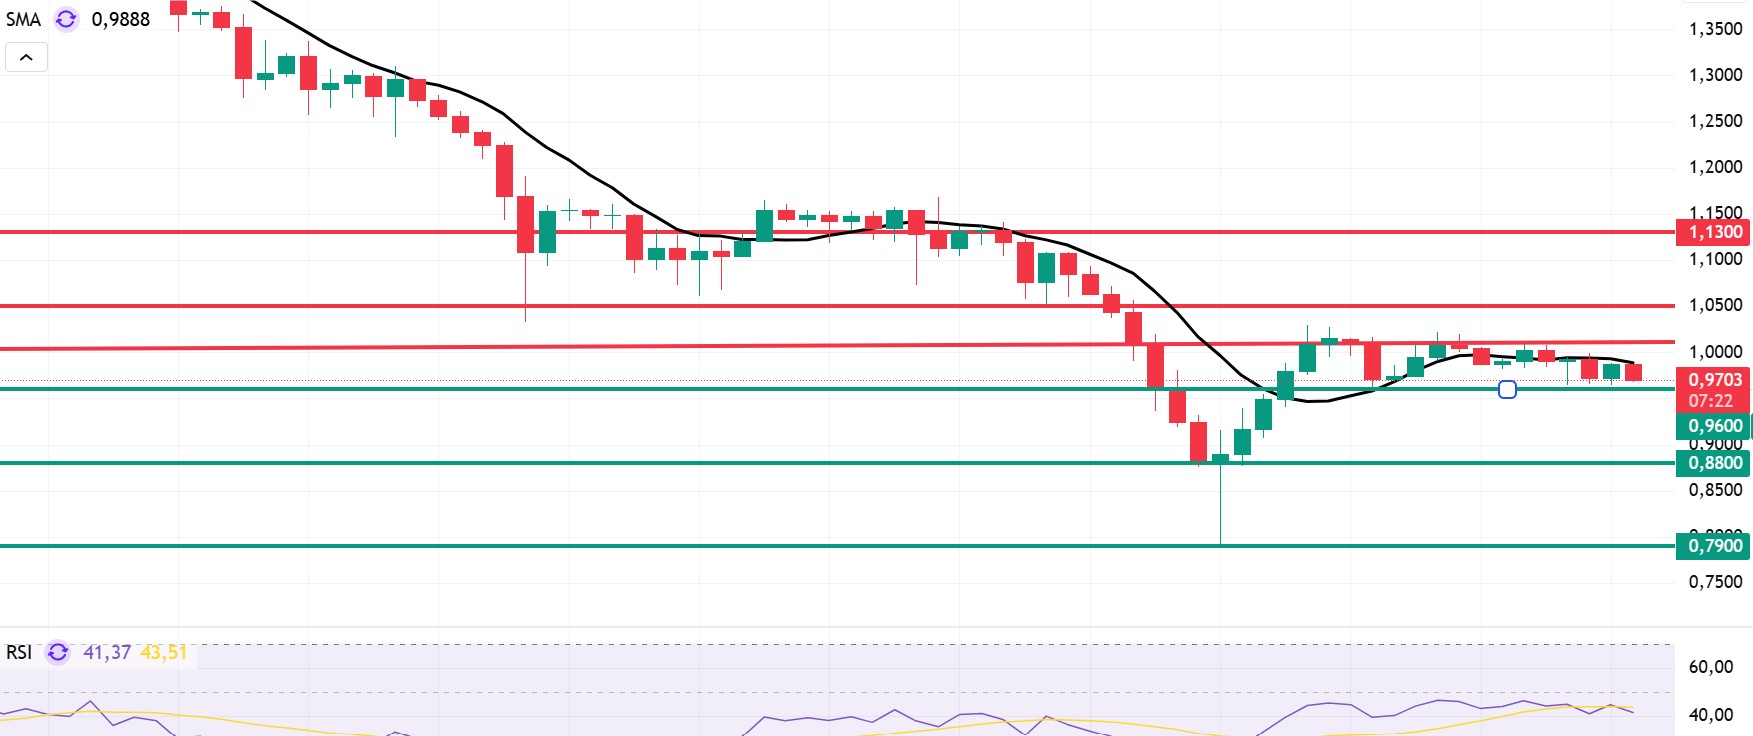
Looking at Sui’s technical outlook, we see that the price has fallen over the past 4 hours and is now moving sideways at around $0.96, influenced by fundamental developments. The Relative Strength Index (RSI) is currently in the range of 41.37 – 43.51. This range indicates that the market is trading close to the sell zone; however, if the RSI weakens and falls to the 35.00 – 40.00 range, it could signal a potential buying point. If the price moves upward, the resistance levels of $1.00, $1.05, and $1.13 can be monitored. However, if the price falls to new lows, it could indicate that selling pressure is intensifying. In this case, the $0.96 and $0.80 levels stand out as strong support zones. Based on the trend line, a pullback to $0.80 appears technically possible. According to Simple Moving Averages (SMA) data, Sui’s average price is currently at $0.98. If the price remains below this level, it could signal that the current upward trend may not continue technically. The downward trend of the SMA also supports this scenario.
Supports: 0.79 – 0.80 – 0.96
Resistances: 1.00 – 1.05 – 1.13
Legal Notice
The investment information, comments, and recommendations contained herein do not constitute investment advice. Investment advisory services are provided individually by authorized institutions taking into account the risk and return preferences of individuals. The comments and recommendations contained herein are of a general nature. These recommendations may not be suitable for your financial situation and risk and return preferences. Therefore, making an investment decision based solely on the information contained herein may not produce results in line with your expectations.
