
Fear & Greed Index
Source: Alternative.me
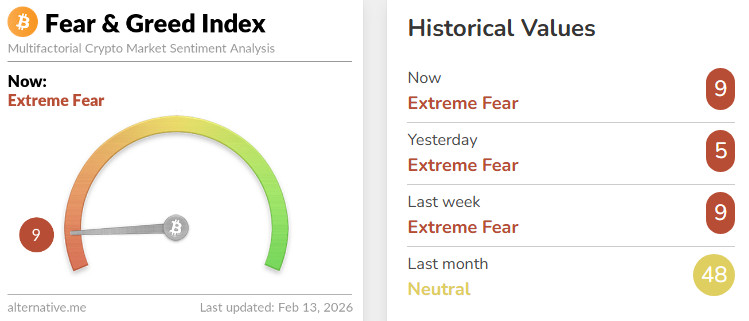
- Change in Fear and Greed Value: 0
- Last Week’s Level: 9
- This Week’s Level: 9
The Fear and Greed Index remained at 9 this week, as it was last week, indicating that sentiment is stuck in the extreme fear zone. However, it is difficult to interpret this picture as stagnant, because during the week the index dropped to 5 and then returned to 9, signaling a more balanced recovery. The main trigger for this stagnation was the theme that interest rates priced in on the macro front would not ease rapidly. Stronger-than-expected employment figures in the US pushed the market’s path of interest rate cuts further into the future, limiting the appetite for sustained buying in risky assets. Weekly jobless claims data reinforced this sentiment. Although claims fell to 227,000, below the previous 231,000, they remained above the 222,000 expectation, failing to produce the clear cooling signal the market wanted to see. Considering that the previous week’s figure was revised to 232,000, the decline was limited to 5,000. This combination kept alive the perception that the employment front remains resilient enough not to rush the Fed, bringing dollar and bond yield sensitivity back to the forefront. On the housing front, while the sharp decline in existing home sales in January produced a cooling signal in the growth channel, it did not create a lasting easing in risk appetite, as the market’s main focus remained on the lack of easing in financial conditions. In addition, Coinbase’s surprise quarterly loss lowered expectations for crypto trading activity, making the lack of catalysts to support risk appetite across the sector more apparent. Ultimately, even though the index closed the week at 9 again, pricing reflected sensitivity struggling to stay afloat rather than recovering due to the impact of the sharp decline during the week.
Crypto Fund Flows
Source: Coinshares
Overview:
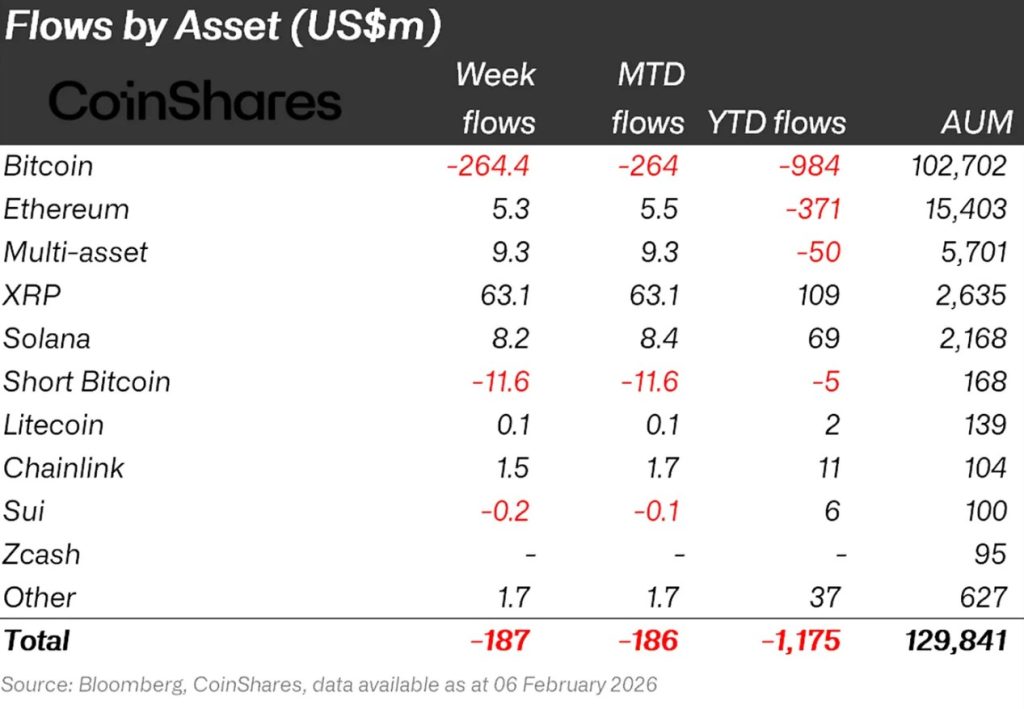
Crypto markets experienced a week marked by significant declines, the US’s planned operation against Iran, and details emerging from the Epstein case. As a result, Bitcoin lost over 15% of its value during the week.
- Ethereum (ETH): Along with spot ETH inflows, Ethereum saw $5.3 million in inflows this week.
- Solana (SOL): Solana saw $8.2 million in inflows.
- Chainlink (LINK): Chainlink saw inflows of $1.5 million.
- Other: Sectoral and project-based declines in altcoins brought about $1.7 million in inflows in the overall market.
- Multi-asset: Inflows were observed in the multi-asset group.
Fund Outflows:
- Bitcoin (BTC): Bitcoin is experiencing significant outflows from investors this week. Bitcoin-focused funds saw outflows of $264.4 million.
- Short Bitcoin: Short Bitcoin saw an outflow of 11.6 million dollars.
- SUI: SUI saw an outflow of $0.2 million.
Total MarketCap
Source: TradingView
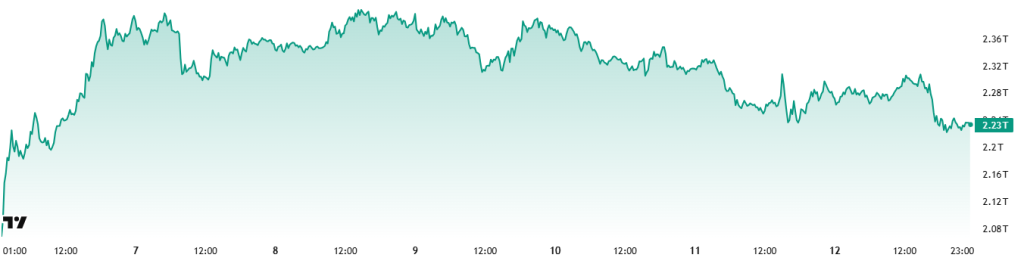
- Last Week’s Market Value:37 Trillion Dollars
- This Week’s Market Value:23 Trillion Dollars
This week, the cryptocurrency market experienced a decline of approximately 135 billion USD, falling by 5.69%, and the total market cap is currently hovering around 2.23 trillion USD. The weekly high was recorded at 2.4 trillion USD, while the low was 2.21 trillion USD. Accordingly, the market moved within a band of ~190 billion USD, indicating an 8.6% volatility during the period. In this context, it can be said that the crypto market returned to its weekly average candle length.
Total 2
The Total 2 index, which started the week with a market value of USD 962.55 billion, declined by 4.38% during the week, losing approximately USD 42.13 billion, and is currently at USD 920.42 billion. The weekly high was recorded at USD 977.29 billion, while the low was USD 910 billion. The index fluctuated within a band of 67 billion USD, corresponding to volatility of approximately 7.37% for the period.
With this outlook, Total 2 continues to trade approximately 850 billion USD below its all-time high. It is estimated that an upward movement of approximately 92% is required for it to reach its previous peak from current levels.
Total 3
Starting the week with a total market value of USD 710.45 billion, the Total 3 index declined by approximately USD 21.7 billion during the week, falling by 3.06% to currently stand at USD 689 billion. Volatility between the weekly high and low was measured at 5.56%.
The fact that the indices’ proportional ranking based on volatility is “Total > Total 2 > Total 3” shows that the sharpest decline in volatility occurred on the Bitcoin side, followed by Ethereum and the average of other altcoins. Additionally, it is noteworthy that the market share “taken” from Bitcoin and Ethereum during the current period stems from altcoins being relatively less affected by the overall decline.
Altcoin Season Index
Source: Coinmarketcap
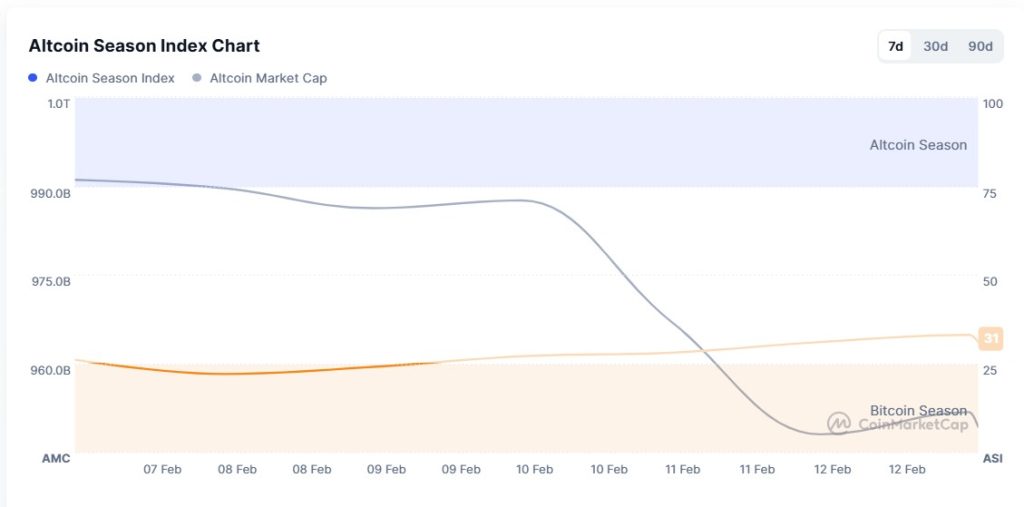
- Last Week’s Index Value: 24/100
- This Week’s Index Value: 31/100
Between February 6 and 13, 2026, there was an increase in the correlation between altcoin market dominance (Altcoin Market Cap) and the Altcoin Season Index. The graph shows that this week, on February 10 , the index fell back to 27, causing the Altcoin Market Cap to drop below 1.00T. When the index rose this week, the top 5 coins leading the rise were PIPPIN, River, KITE, CC, and SKY. In summary, the Altcoin Season Index rose this week compared to last week, indicating a relative increase in the total market value of altcoins compared to Bitcoin.
Bitcoin Dominance
Source: Tradingview
Weekly Change
- Last Week’s Level:72%
- This Week’s Level:89%
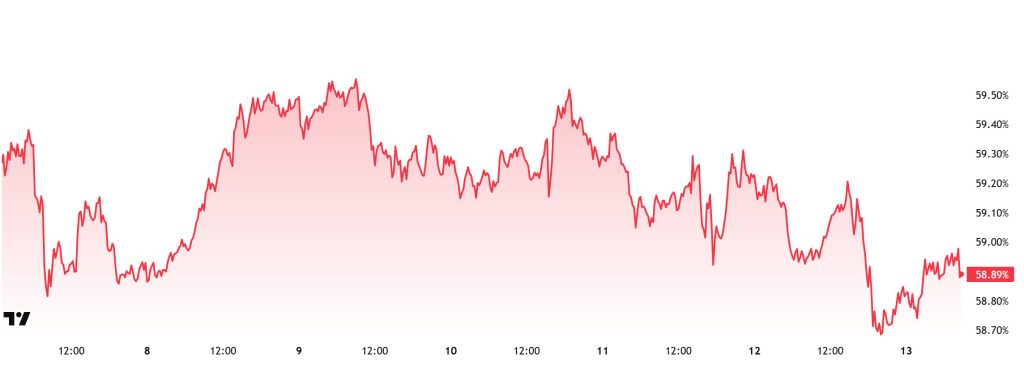
Bitcoin dominance, which started the week at 59.34%, retreated to 58.77% levels during the week but subsequently rose slightly and is currently at 58.89%.
This week, Strategy purchased 1,142 Bitcoin, The Smarter Web purchased 15 Bitcoin, and DDC Enterprise purchased 100 Bitcoin. Additionally, data on Bitcoin spot ETFs shows a net outflow of $375.1 million to date.
Weekly data reveals that Strategy continues to purchase Bitcoin, while DDC Enterprise has also begun accumulating Bitcoin on a regular basis. In contrast, other treasury companies appear to be adopting a wait-and-see approach at current price levels and are not making new purchases. This picture shows that buying has not completely stopped on the institutional side, but continues through a limited number of companies. On the other hand, continued net outflows among ETF investors indicate that selling pressure is effective in the short term. While Bitcoin has maintained its decisive role in market dynamics in recent times, altcoins have occasionally shown resilience but have been affected by price movements periodically. It is noteworthy that Ethereum, in particular, has been more sensitive to these fluctuations. Nevertheless, the current market structure does not yet indicate a strong break in Bitcoin dominance. In this process, it is likely that dominance will continue to fluctuate between 58% and 61% in the coming week.
Ethereum Dominance
Source: Tradingview
Weekly Change:
- Last Week’s Level: 10.65%
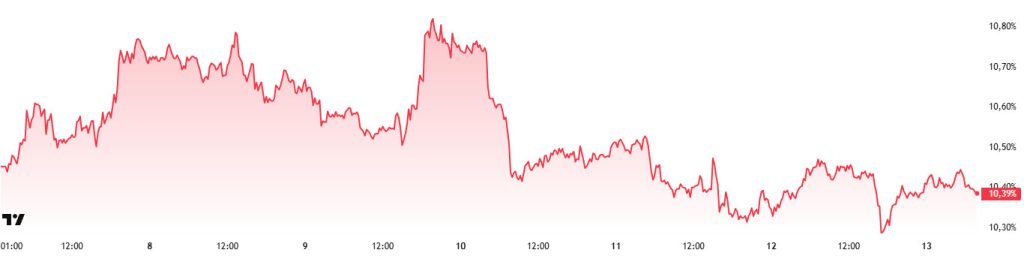
- This Week’s Level: 1 0.39%
Ethereum dominance, which rose to 15% levels in mid-August, lost momentum in the following period and entered a downward trend. This negative outlook progressed to 13% levels with a positive correction until the last week of November. However, it faced strong resistance at this level and reversed direction downward again.
In this context, Ethereum dominance ended last week at 10.65% and is currently trading at around 10.39%. During the same period, Bitcoin dominance followed a similar negative trend to Ethereum dominance.
The key developments affecting Ethereum dominance are as follows:
Optimism Governance announced today that 6,400 ETH will be transferred between wallets. The transaction will be carried out as part of the Optimism Collective treasury’s liquid staking process. Forty percent of the total 21,500 ETH treasury will be allocated to liquid staking protocols. The remaining assets will be staked on the Ethereum mainnet.
Bitmine Ethereum Accumulation: Bitmine purchased an additional 41,788 Ethereum last week. The company’s total Ethereum holdings rose to 4,285,125 ETH. With this purchase, Bitmine maintained its status as one of the largest institutional Ethereum treasuries. The detailed cost of the purchases was not disclosed.
Ethereum Foundation Co-Executive Director Hsiao-Wei Wang explained the roles of L1 and L2 in scalability discussions. He stated that L2s need to develop specialized application chains that offer high scalability. He said that L1 will continue to be the most secure payment and final confirmation layer. He also added that user experience and AI agents hold an important place in the roadmap.
Bitcoin Spot ETF
Source: Darkex Research Department
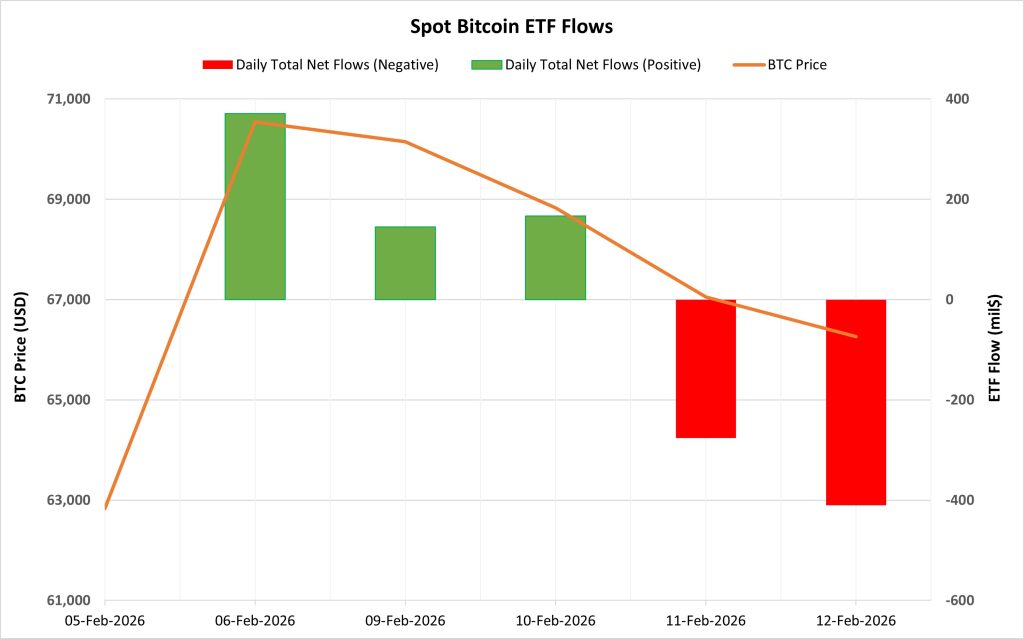
Netflow Status: Between February 6-12, 2026, there was a total net outflow of $4.17 million in Spot Bitcoin ETFs. The positive flow series seen in the first three trading days of this period kept the total positive for a long time. However, the strong net outflows seen in the last two trading days caused the process to end negatively. The largest net outflow by fund occurred on the Fidelity FBTC side, while the strongest net inflow overall was on Grayscale BTC.
Bitcoin Price: Bitcoin opened at $62,830 on February 6 and closed at $66,264 on February 12. During this period, the BTC price rose by 5.47%. The 12.28% increase seen on February 6 was consistent with ETF inflows. However, the simultaneous progress of price declines and ETF outflows in the last two days of the week indicated a weakening of the upward momentum.
Cumulative Net Inflows: By the end of the 522nd trading day, the cumulative total net inflows into Spot Bitcoin ETFs had declined to $54.296 billion.
| Time | News | Expectation | Previous |
|---|---|---|---|
| All Day | LayerZero (ZRO) 25.71MM Token Unlock | – | – |
| All Day | KAITO (KAITO) 32.6MM Token Unlock | – | – |
| 13:30 | US Advance GDP q/q | 2.8% | 4.4% |
| 13:00 | US PCE Price Index m/m | 0.3% | 0.2% |
| 13:00 | US Core PCE Price Index m/m | 0.3% | 0.2% |
| 13:00 | US PCE Price Index y/y | 2.8% | 2.8% |
| 13:00 | US Core PCE Price Index y/y | 2.9% | 2.8% |
| 14:45 | US Flash Manufacturing PMI | – | 52.4 |
| 14:45 | US Flash Services PMI | – | 52.7 |
| 14:45 | FOMC Member Bostic Speaks | – | – |
| 18:15 | FOMC Member Logan Speaks | – | – |
This period began with a strong rebound. However, institutional selling pressure increased again over the last two trading days. Although inflows supported the price during the first three trading days, sharp outflows over the last two trading days turned the overall total negative. The accelerated outflows over the last two trading days indicate that risk reduction tendencies have resurfaced on the institutional side. If stable inflows resume on the ETF side in the coming days , the BTC price could recover. However, if the strong outflow trend of the last two days continues, downward pressure and volatility may persist.
Ethereum spot ETF
Source: Darkex Research Department
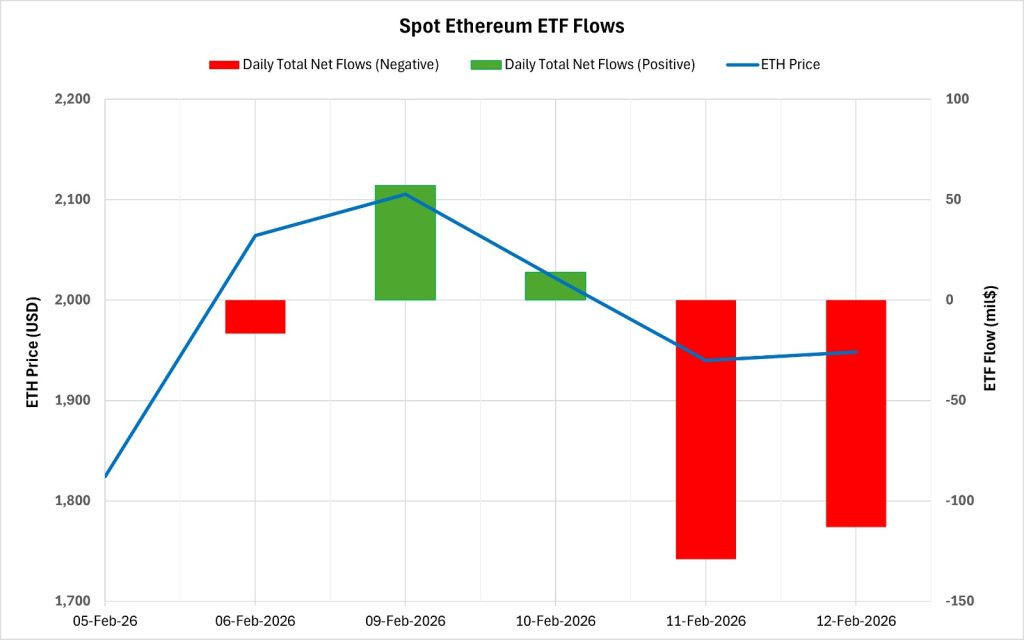
Between February 6-12, 2026, Spot Ethereum ETFs saw a total net outflow of $188.1 million. ETF flows were predominantly negative during this period. Strong outflows over the last two trading days turned the overall picture negative. The highest outflow by fund occurred on the BlackRock ETHA side. By the end of the 392nd trading day, the cumulative total net inflow for Spot Ethereum ETFs had declined to 11.66 billion dollars.
| Date | Coin | Open | Close | Change | ETF Flow (mil$) |
|---|---|---|---|---|---|
| 06-Feb-2026 | ETH | 1,824 | 2,064 | 13.17% | -16.7 |
| 09-Feb-2026 | ETH | 2,088 | 2,106 | 0.82% | 57 |
| February 10, 2026 | ETH | 2,106 | 2,022 | -3.98% | 13.8 |
| February 11, 2026 | ETH | 2,022 | 1,940 | -4.06% | -129.1 |
| February 12, 2026 | ETH | 1,940 | 1,948 | 0.44% | -113.1 |
| Total for February 6–12, 2026 | 6.80% | -188.1 |
Ethereum opened at $1,824 on February 6 and closed at $1,948 on February 12. During this period, the ETH price rose by 6.80%. The 13.17% increase on February 6, in particular, occurred despite net outflows on the ETF side, indicating that the price movement was primarily driven by the spot market. The recent weakening in both price and ETF flows, particularly in the last few trading days, revealed that the upward momentum is struggling to gain traction. In the coming days, if outflows from ETFs slow down and stable inflows resume, the ETH price could see a recovery ( ). Otherwise, if the negative flow trend continues, downward pressure and increased volatility may persist.
Bitcoin Options Distribution
Source: Laevitas
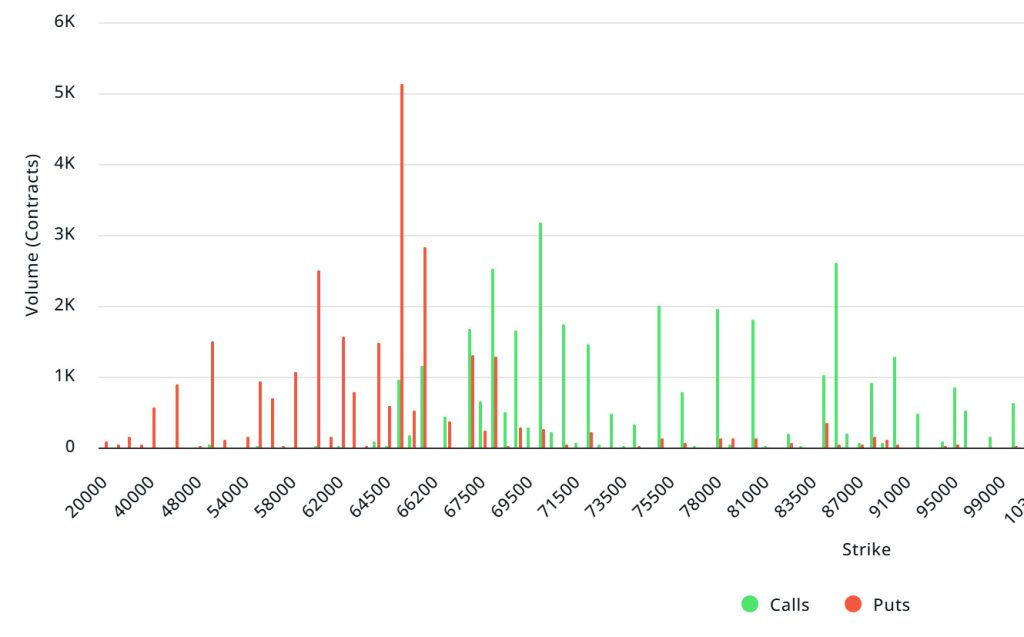
BTC: Notional: $2.53B | Put/Call: 0.76 | Max Pain: $75K
Deribit Data: Deribit data shows that BTC option contracts with a notional value of approximately $2.53 billion expire today. At the same time, looking at the risk transformation over the next week based on the last 24 hours’ data, put options are dominating over call options in terms of risk hedging. However, call options have started to increase. When examining expected volatility (IV), it is currently trading below realized volatility (RV). Meanwhile, the negative spread metric indicates a decline in market risk appetite, suggesting that put options are currently expensive.
Laevitas Data: Examining the chart, we see that put options are concentrated in a wide band between $45,000 and $68,000. Call options, on the other hand, are spread across a broad base between the $67,000 and $85,000 levels. At the same time, the $70,000 level appears to be resistance, while the $65,000 level appears to be support. On the other hand, there are 5.16k put options at the $65,000 level, peaking here and showing a decline in put volume after this level. Meanwhile, 3.35K call option contracts peak at the $70,000 level. Looking at the options market, we see that put contracts dominate on a daily and weekly basis.
Option Maturity:
Put/Call Ratio and Maximum Pain Point: Looking at the options in the latest 7-day data from Laevitas, the number of call options decreased by approximately 13% compared to last week, reaching 147.02K. In contrast, the number of put options decreased by 29% compared to last week, reaching 153.05K. The put/call ratio for options is set at 0.76. This indicates that there is more demand for call options than put options among investors. Bitcoin’s maximum pain point is seen at $75,000. BTC is currently priced at $66,500, and if it fails to break above the pain point of $75,000, further declines can be anticipated.
Ethereum Options Distribution
Source: Laevitas
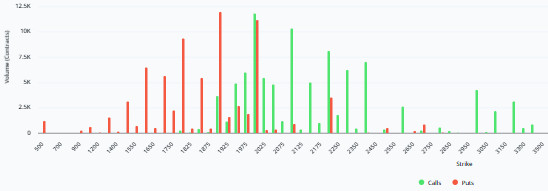
ETH: $0.40 B notional | Put/Call: 0.89 | Max Pain: $2,150
Laevitas Data: Looking at the data in the chart, we see that put options are concentrated in a fairly wide band, particularly between the $1,850 and $2,000 price levels. The highest put volume is at the $1,790 level with approximately 12K contracts. On the other hand, call options show a notable concentration between $1,900 and $2,050. The highest call volume is at the $2,000 level and appears to be close to the number of put contracts at approximately 12K.
Deribit Data: First, looking at the 24-hour total volume, which increased by over 17% to reach approximately $80 million due to it being the last day of the week in the short term, and with open interest rising to $429 million and recording a daily growth of $29 million, we see that net money inflows into the market are still continuing. On the volume side, the real momentum is in call options, with call volume exceeding $51 million, showing a 52% increase, while put volume is at $28.7 million and has declined on a daily basis. In other words, the flow is concentrated in upward-trending trades. Despite this, it is important to note that the 25 delta risk reversal remains clearly in negative territory at -16.59. Puts are still relatively more expensive. Therefore, downside risks are still on the table. In short, although speculative appetite for upward movements has strengthened in the short term, continued downward movements in option pricing appear much more likely.
Option Maturity:
Ethereum options with a nominal value of $0.40 billion expired on February 13. The Max Pain level was calculated at $2,150, while the put/call ratio stood at 0.89.
Legal Notice
The investment information, comments, and recommendations contained in this document do not constitute investment advisory services. Investment advisory services are provided by authorized institutions on a personal basis, taking into account the risk and return preferences of individuals. The comments and recommendations contained in this document are of a general nature. These recommendations may not be suitable for your financial situation and risk and return preferences. Therefore, making an investment decision based solely on the information contained in this document may not result in outcomes that align with your expectations.
