
Weekly Technical Analysis Report
BTC/USDT
Following the release of macroeconomic data in the US last week, Fed officials reiterated their cautious stance, emphasizing that there should be no rush to cut interest rates. While military preparations between the US and Iran came to the fore, talks in Oman failed to yield results. Internal Russian correspondence reportedly suggested establishing a broad economic partnership with the US. On the Japanese front, the ruling coalition led by Sanae Takaichi declared victory, while it was suggested that the Russia-Ukraine war would end this summer. On the crypto front, no final agreement was reached at the stablecoin meeting held at the White House.
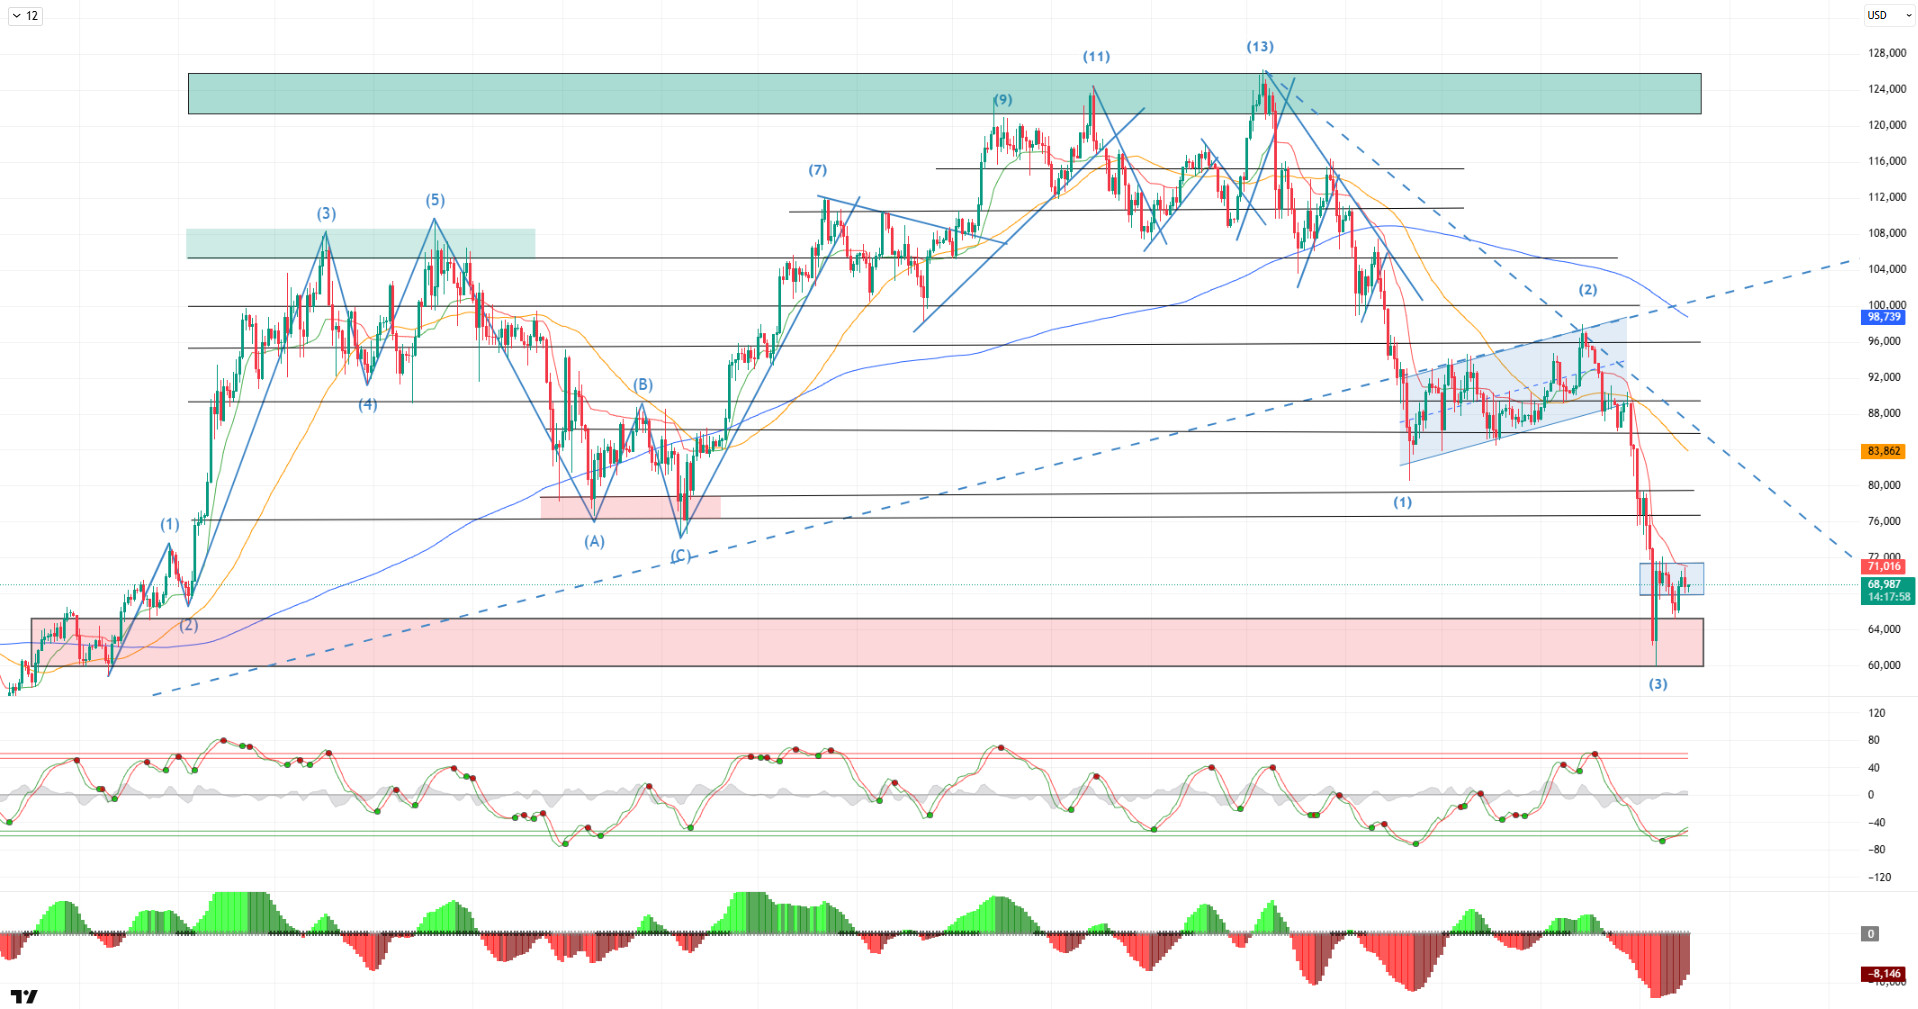
Looking at the daily technical outlook after all these developments, BTC paused its downward trend, which began after reaching its ATH level, after bottoming out at the 60,000 level. BTC, which is experiencing a rebound, continues its horizontal movement within the 65,000-70,000 band. The price, which peaked at point 2 from the bottom levels it created at points 1 and 3, is expected to reach point 4. After a possible minor peak, the price’s decision-making zone could be the downward line at point 13. A possible rejection from this level could bring a new bottom, while a break above it could end the downtrend.
Looking at technical indicators, the Wave Trend (WT) oscillator maintains its buy signal in the oversold zone, while the Squeeze Momentum (SM) histogram attempts to gain momentum within the negative zone. Although the Supertrend structure turned bullish after a brief long break, it has now turned bearish again.
When examining weekly liquidation data, short and medium-term fragmented buying levels have re-established intensity at 65,000 – 68,000. The selling level continues to be concentrated in the short term at 71,000 – 79,000 and in the medium term at 85,000 – 86,000.
In summary, this week’s busy data calendar will see the FOMC minutes, GDP, and PCE leading indicators monitored in the US. Meanwhile, talks between the US and Iran will continue, and the Supreme Court is expected to rule on Trump’s tariffs. On the Asian front, as the Chinese holiday begins, no clear outcome has yet been reached on the crypto front. Technically, BTC, which started the new year with positive momentum, tested the 98,000 level before entering a sharp sell-off, falling back to the 60,000 level. Following this move, it closed all months after September in negative territory. BTC, which also started February with a decline, lost the critical range of 70,000-80,000 and returned to its pre-Trump pricing. Although the price managed to recover from this point, its attempt to hold above the 70,000 level has so far been unsuccessful. If this level is regained, the price is expected to make a move towards the 75,000 level, while a downward break could see a double bottom formation.
Supports: 60,000 – 65,000 – 62,800
Resistances: 70,000 – 75,000 – 80,000
ETH/USDT
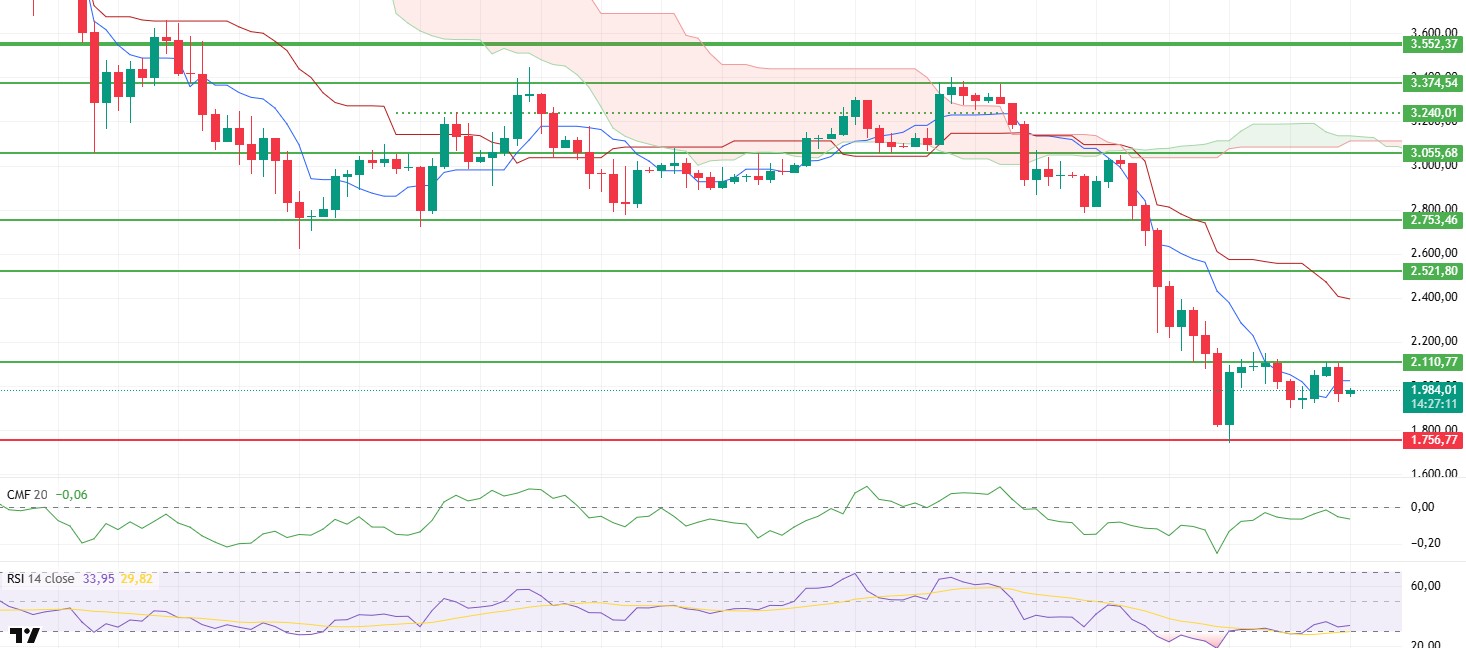
Following last week’s sharp sell-off, the ETH price rebounded from the $1,900 region and headed towards the resistance area around $2,100. However, this region could not be breached, and with the incoming sell-off, the price fell back below the $2,000 level. The current structure shows that buyers are occasionally stepping in at the bottom regions, but the upward movement has not yet gained sustainable momentum. The market maintains its fragile outlook in the short term.
On the fundamentals side, a significant security-focused step came to the fore. The Trillion Dollar Security initiative, launched by the Ethereum Foundation in collaboration with Security Alliance (SEAL) to monitor and neutralize attacks targeting users, aims to strengthen the ecosystem’s long-term resilience. While such developments may not directly impact short-term prices, they can contribute to a medium-term climate of confidence by bolstering perceptions of network security.
During the week of February 6-12, there was a net outflow of $188.1 million from Spot Ethereum ETFs. The concentration of outflows, particularly on the BlackRock ETHA side, indicates that selling pressure is spreading across a broad base. The decline in cumulative net inflows to $11.66 billion confirms that institutional appetite has not yet recovered.
While the Cumulative Volume Delta (CVD) shows that spot sales are accelerating, the Chaikin Money Flow (CMF) has turned downward again after approaching the zero line, confirming that liquidity outflows are continuing. This outlook indicates that upward attempts may lack volume support.
Although the Relative Strength Index (RSI) has emerged from the oversold zone, it has failed to generate strong momentum and is trading sideways in the border zone. While this structure indicates that selling pressure has eased, it also reveals that buyers do not yet have the strength to take control.
The Ichimoku indicator continues to confirm the overall weakness. While the price remains below the Tenkan and Kijun levels, the kumo cloud has not yet been regained. This positioning indicates that the main trend is downward and that upward attempts may remain reactive for now.
In the overall assessment, considering technical weakness and liquidity outlook together, downward risks are seen to continue during the week. If the $1,900 intermediate support level is lost, the pullback could deepen to the $1,756 level. Conversely, if the $2,113 level is broken with volume, the outlook could improve significantly, and this move could be interpreted as the first strong signal of a trend reversal.
Supports: 1,756 – 1,551 – 1,384
Resistances: 2,110 – 2,521 – 2,753
XRP/USDT
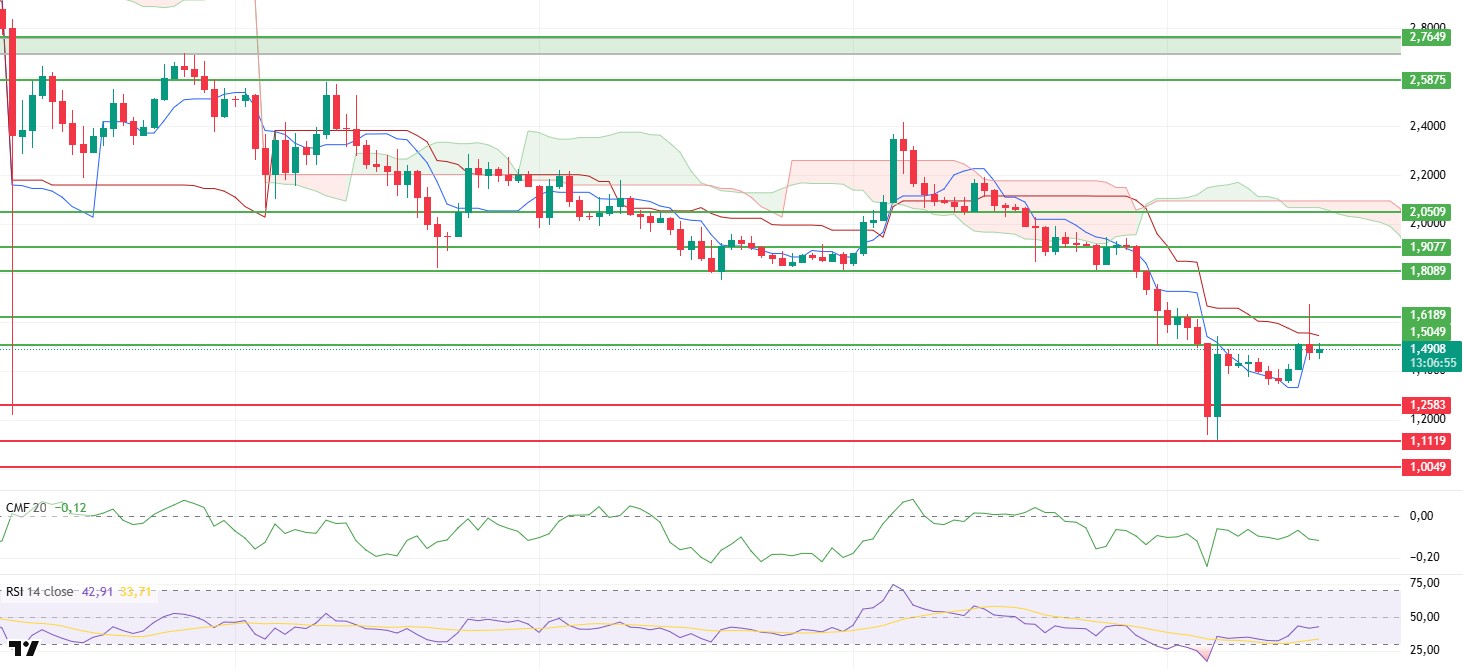
Following last week’s sharp sell-off, the XRP price fluctuated throughout the week. The price first retreated to the $1.34 region, maintaining its weak outlook. Buying at this level led to a strong rebound towards the end of the week, pushing the price up to $1.67. However, this rise was not sustainable, and with the sharp sell-off that followed, XRP fell back below the $1.50 level. The current structure shows that the upward movements are not yet convincing and that the market remains fragile.
On the fundamental side, Ripple’s new integrations with Securosys and Figment are noteworthy. The addition of hardware security modules to the institutional custody platform aims to reduce the infrastructure burden for banks and custodians. This development could be seen as positive for long-term institutional adoption. However, it has not yet had a decisive impact on short-term price behavior.
Liquidity dynamics suggest that the recent movement is not healthy. The Chaikin Money Flow (CMF) remains in negative territory, while the CVD spot data also remains weak, indicating that the recent rise was primarily driven by futures-side position movements. This structure points to the movement having the character of a liquidity hunt ( ) and suggests that rallies could be fragile as long as spot support remains weak.
The momentum picture is cautious. Although the Relative Strength Index (RSI) has emerged from the oversold zone, it has failed to generate strong momentum and remains in the weak zone. This outlook confirms that buyers have not yet established lasting control in the market.
The Ichimoku indicator maintains its overall weakness. While the price remains below the Tenkan and Kijun levels, the kumo cloud has not yet been regained. This technical structure indicates that the main trend is downward and that upward movements may remain reactive for now.
Critical thresholds remain unchanged in the overall outlook. An upward movement could regain strength if the $1.50 level is broken with volume and sustained above. Conversely, selling pressure is expected to continue as long as this region remains unbroken. On the downside, the $1.25 level is the main support, and the risk of a renewed deepening of the decline remains on the table if this level is lost.
Supports: 1.2583 – 1.1119 – 1.0049
Resistances: 1.5049 – 1.6189 – 1.8089
SOL/USDT
In the Solana ecosystem;
- Citigroup tokenized a $2.6 trillion trade finance agreement on Solana.
- Solana treasury company Solmate canceled the RockawayX merger, prioritizing capital efficiency.
- Solana treasury company Solmate canceled the RockawayX merger due to weak SOL prices and decided to focus on strategic partnerships and expansion in the UAE.
- Tramplin is launching a new Solana staking model.
- Solana treasury company Solana Co. announced a partnership with Anchorage Digital and Kamino to launch a new platform where institutional investors can borrow against staked SOL tokens.
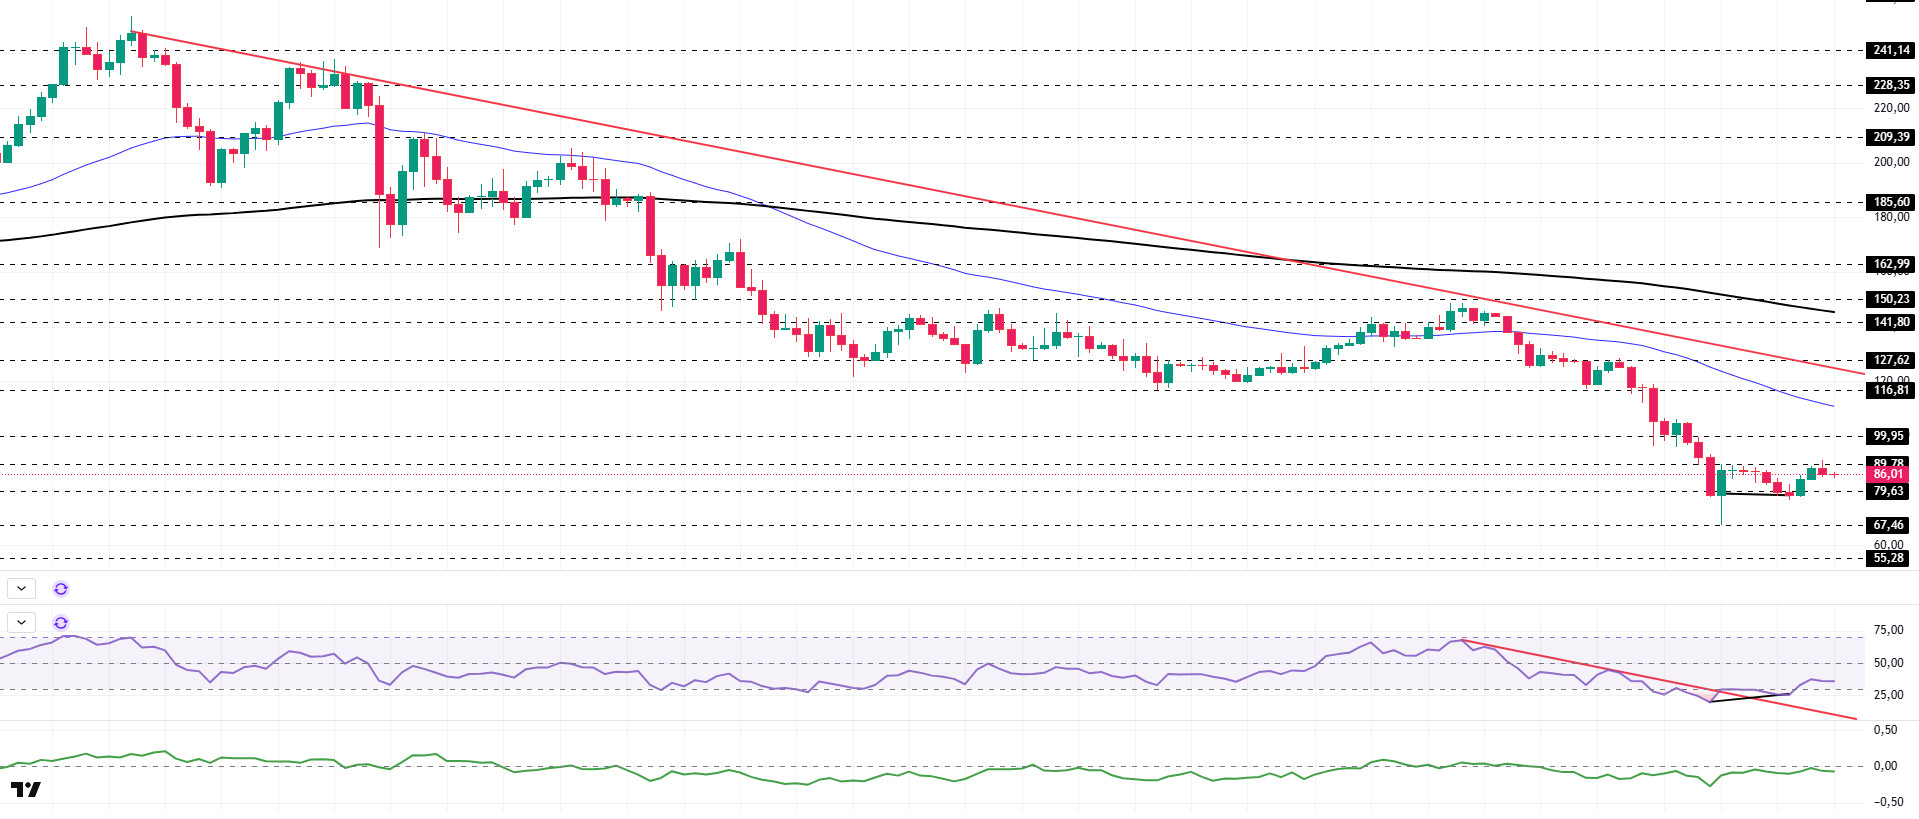
The SOL price traded sideways on the daily chart this week. The asset remained in the lower region of the downtrend that began on September 18. Testing the strong support level of $79.63, the price gained momentum from there and rose to $89.78. Currently, the asset is experiencing a pullback from this resistance level and continues its sideways movement. If it closes above the strong resistance level of $99.95, it could test the 50 EMA (Blue Line) moving average as resistance. In case of a pullback, the $67.46 level should be monitored as a support level.
The asset is trading below the 50 EMA (Exponential Moving Average – Blue Line) and 200 EMA (Black Line) moving averages, indicating that the asset is trending downward. Furthermore, the 50 EMA remained below the 200 EMA. This showed us that a “dead cross” formation is continuing from a technical perspective. It also indicates that the potential for decline continues in the medium term. The RSI (14) rose from the oversold zone to the middle of the negative zone. At the same time, it remained in the upper region of the downward trend that has continued since January 14, indicating that buying pressure may increase. On the other hand, positive divergence should be monitored. Chaikin Money Flow (CMF-20) remained in the negative zone. At the same time, an increase in cash outflows may keep the CMF-20 indicator in the negative zone. If macroeconomic data remains positive and developments in the ecosystem continue to be favorable, the first major resistance level of $116.81 could be retested. Conversely, in the event of potential negative news flow or deterioration in macro data, the $67.46 level could be monitored as a potential buying opportunity.
Supports: 79.63 – 67.46 – 55.28
Resistances: 89.78 – 99.95 – 116.81
DOGE/USDT
Elon Musk confirmed the inevitable rise of this asset by responding positively to a viral Dogecoin tweet.
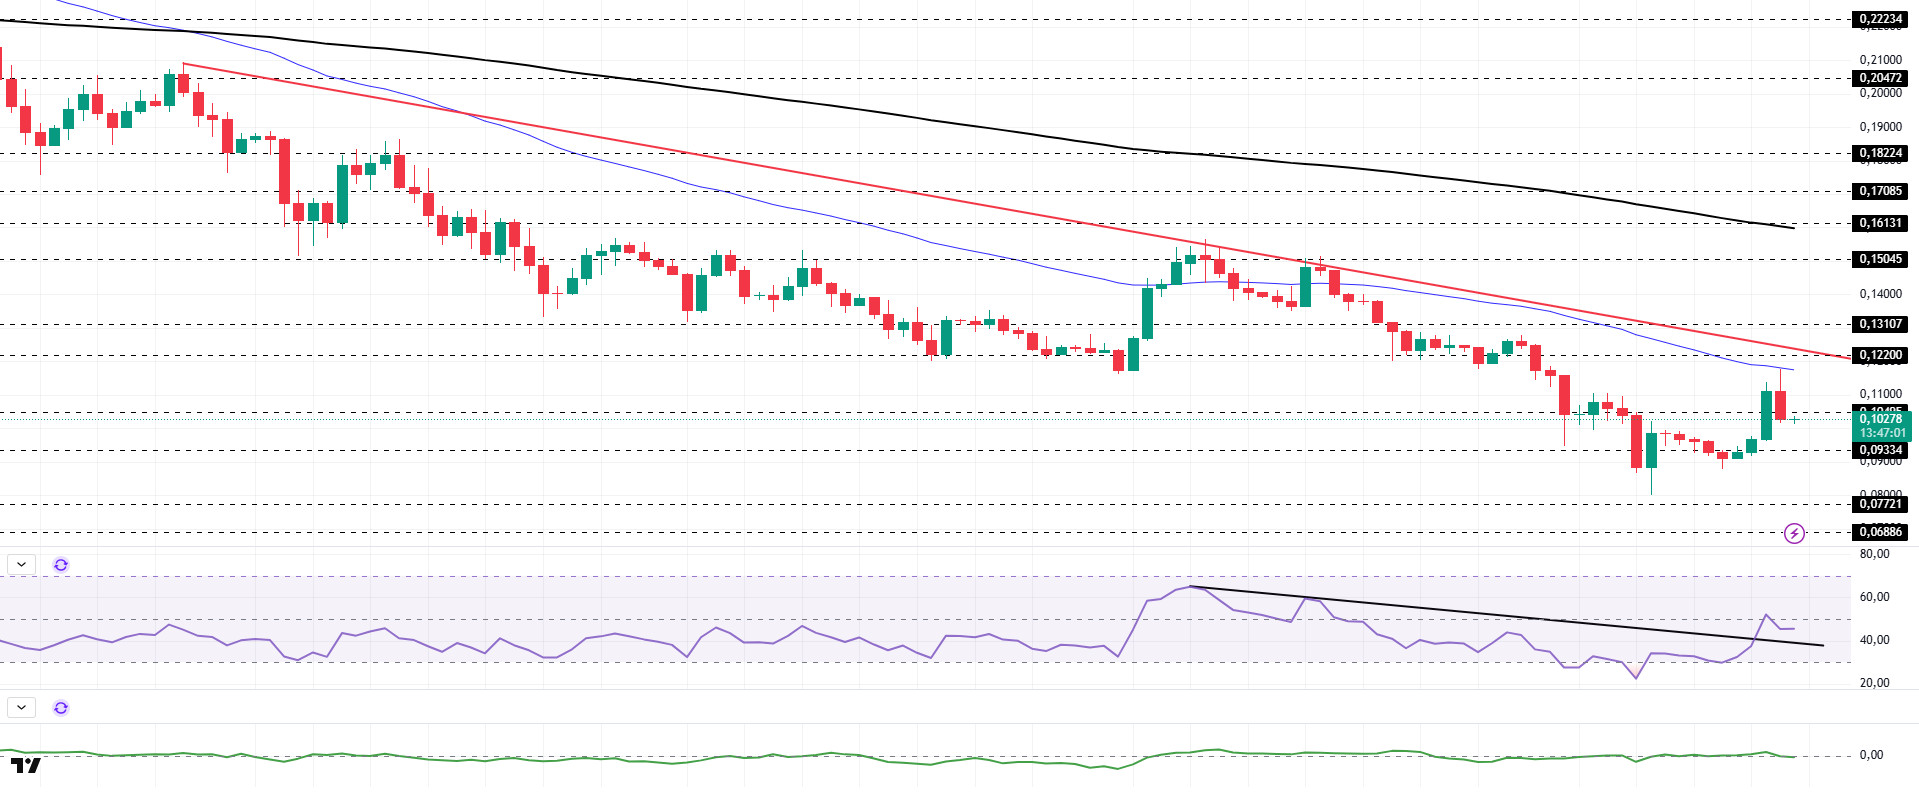
DOGE has risen approximately 10% on the daily chart since last week. The price remained in the lower region of the downward trend that began on October 27. Testing the strong support level of $0.09334, the asset rose to the 50 EMA (Blue Line) moving average. After pulling back from the 50 EMA moving average, the asset is currently testing the strong resistance level of $0.10495. If it breaks above this level, it could test the downward trend line as resistance. If the pullback continues, the $0.09334 level should be monitored as a support level.
The asset continues to trade below the 50 EMA (Blue Line) and 200 EMA (Exponential Moving Average – Black Line) moving averages. This indicates that the asset is trending downward in the short term. On the other hand, the 50 EMA being below the 200 EMA shows us that the “dead cross” formation is continuing. This also indicates that the asset currently has the potential to lose value. The Chaikin Money Flow (CMF–20) indicator is at a neutral level. Money outflows continue to increase. This could push the CMF-20 into negative territory. Looking at the Relative Strength Index (RSI-14) indicator, it has risen from the oversold zone to near the neutral level of the negative zone. At the same time, it has crossed above the upper region of the downward trend that has been ongoing since January 5. This signals that buying pressure could be building. In the event of macroeconomic risks or negative news from the ecosystem, the $0.06886 level can be monitored as a strong support. On the other hand, if the upward movement gains strength, the $0.13107 level comes to the fore as the first strong resistance level.
Supports: 0.09334 – 0.07721 – 0.06886
Resistances: 0.10495 – 0.12200 – 0.13107
TRX/USDT
Tron Inc., the Tron treasury company, announced that it purchased 1,255,570 TRX at an average price of $0.28 last week, bringing its total assets to over 681.7 million TRX. The company stated that it aims to further increase its Tron assets to boost its share value in the long term.
Last week, the TRON network generated a total of $44.8 million in revenue, continuing to be the highest-earning ecosystem among all blockchain networks. This revenue performance demonstrates that TRON has a stronger economic structure compared to other networks.
A total of 22.7 million TRX were burned on the TRON network during the week of February 9-15. Despite this, the circulating supply increased by 4.7 million. While the increase in supply in the short term has the potential to put pressure on the TRX price, the regularly maintained burning mechanism stands out as a balancing factor in the medium-term outlook. Additionally, the total number of addresses increased by 1.3 million to reach 365.6 million during the same week.
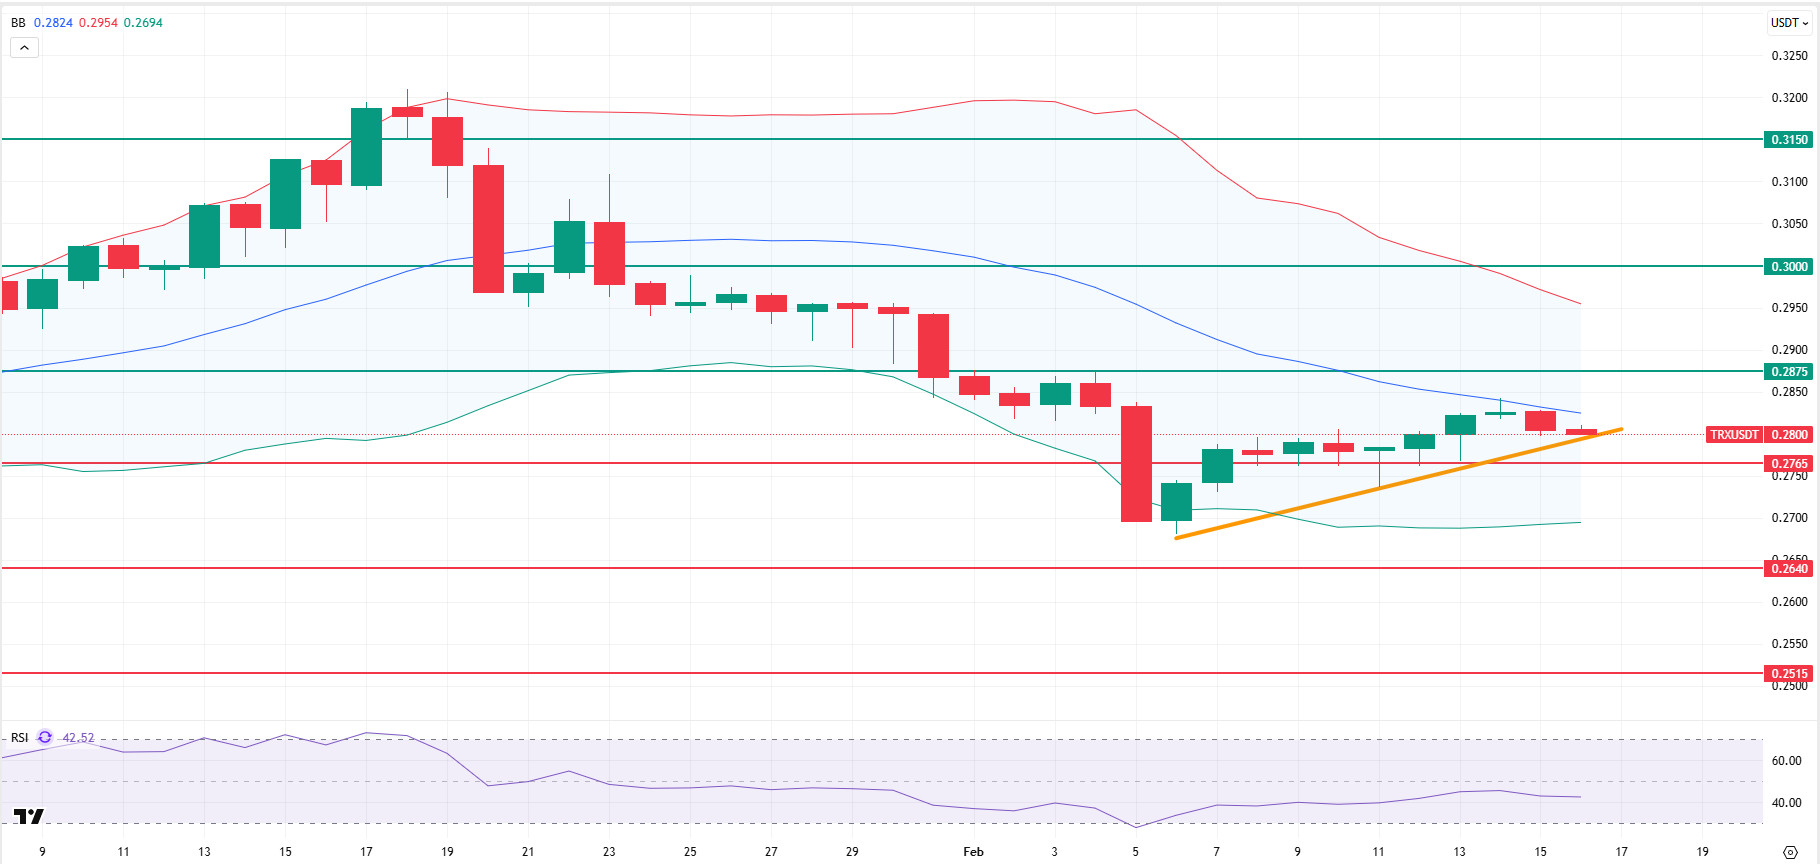
Technically speaking, TRX started last week at 0.2777 and gained approximately 1% in value throughout the week, closing at 0.2804. Thus, TRON ended the week with an increase, bringing its market value to $26.6 billion. Currently trading at 0.2800, TRX is located in the middle Bollinger band on the daily chart. The Relative Strength Index (RSI) value is observed to be in the neutral zone at the 42 level. It is also right on top of the minor trend support formed by the momentum gained after the decline on February 6. Considering its position within the Bollinger band and the RSI indicator, the TRX price is expected to rise slightly with the reaction it will receive at the trend support. This indicates that it may want to move towards the upper Bollinger band. In such a case, it may test the 0.2875 resistance. If it closes above the 0.2875 resistance level on a daily basis, it may test the 0.3000 resistance level. If it fails to close above the 0.2875 resistance level on a daily basis and the negative market sentiment intensifies, it may decline due to potential sell-offs from the region in question. In such a case, it may test the 0.2765 and 0.2640 support levels in sequence. The 0.2515 level is being monitored as a critical support point on the daily chart. Holding above this level may preserve the possibility of an uptrend, while a downward break could lead to increased selling pressure and accelerate the downward movement.
Supports: 0.2765 – 0.2640 – 0.2515
Resistances: 0.2875 – 0.3000 – 0.3150
AVAX/USDT
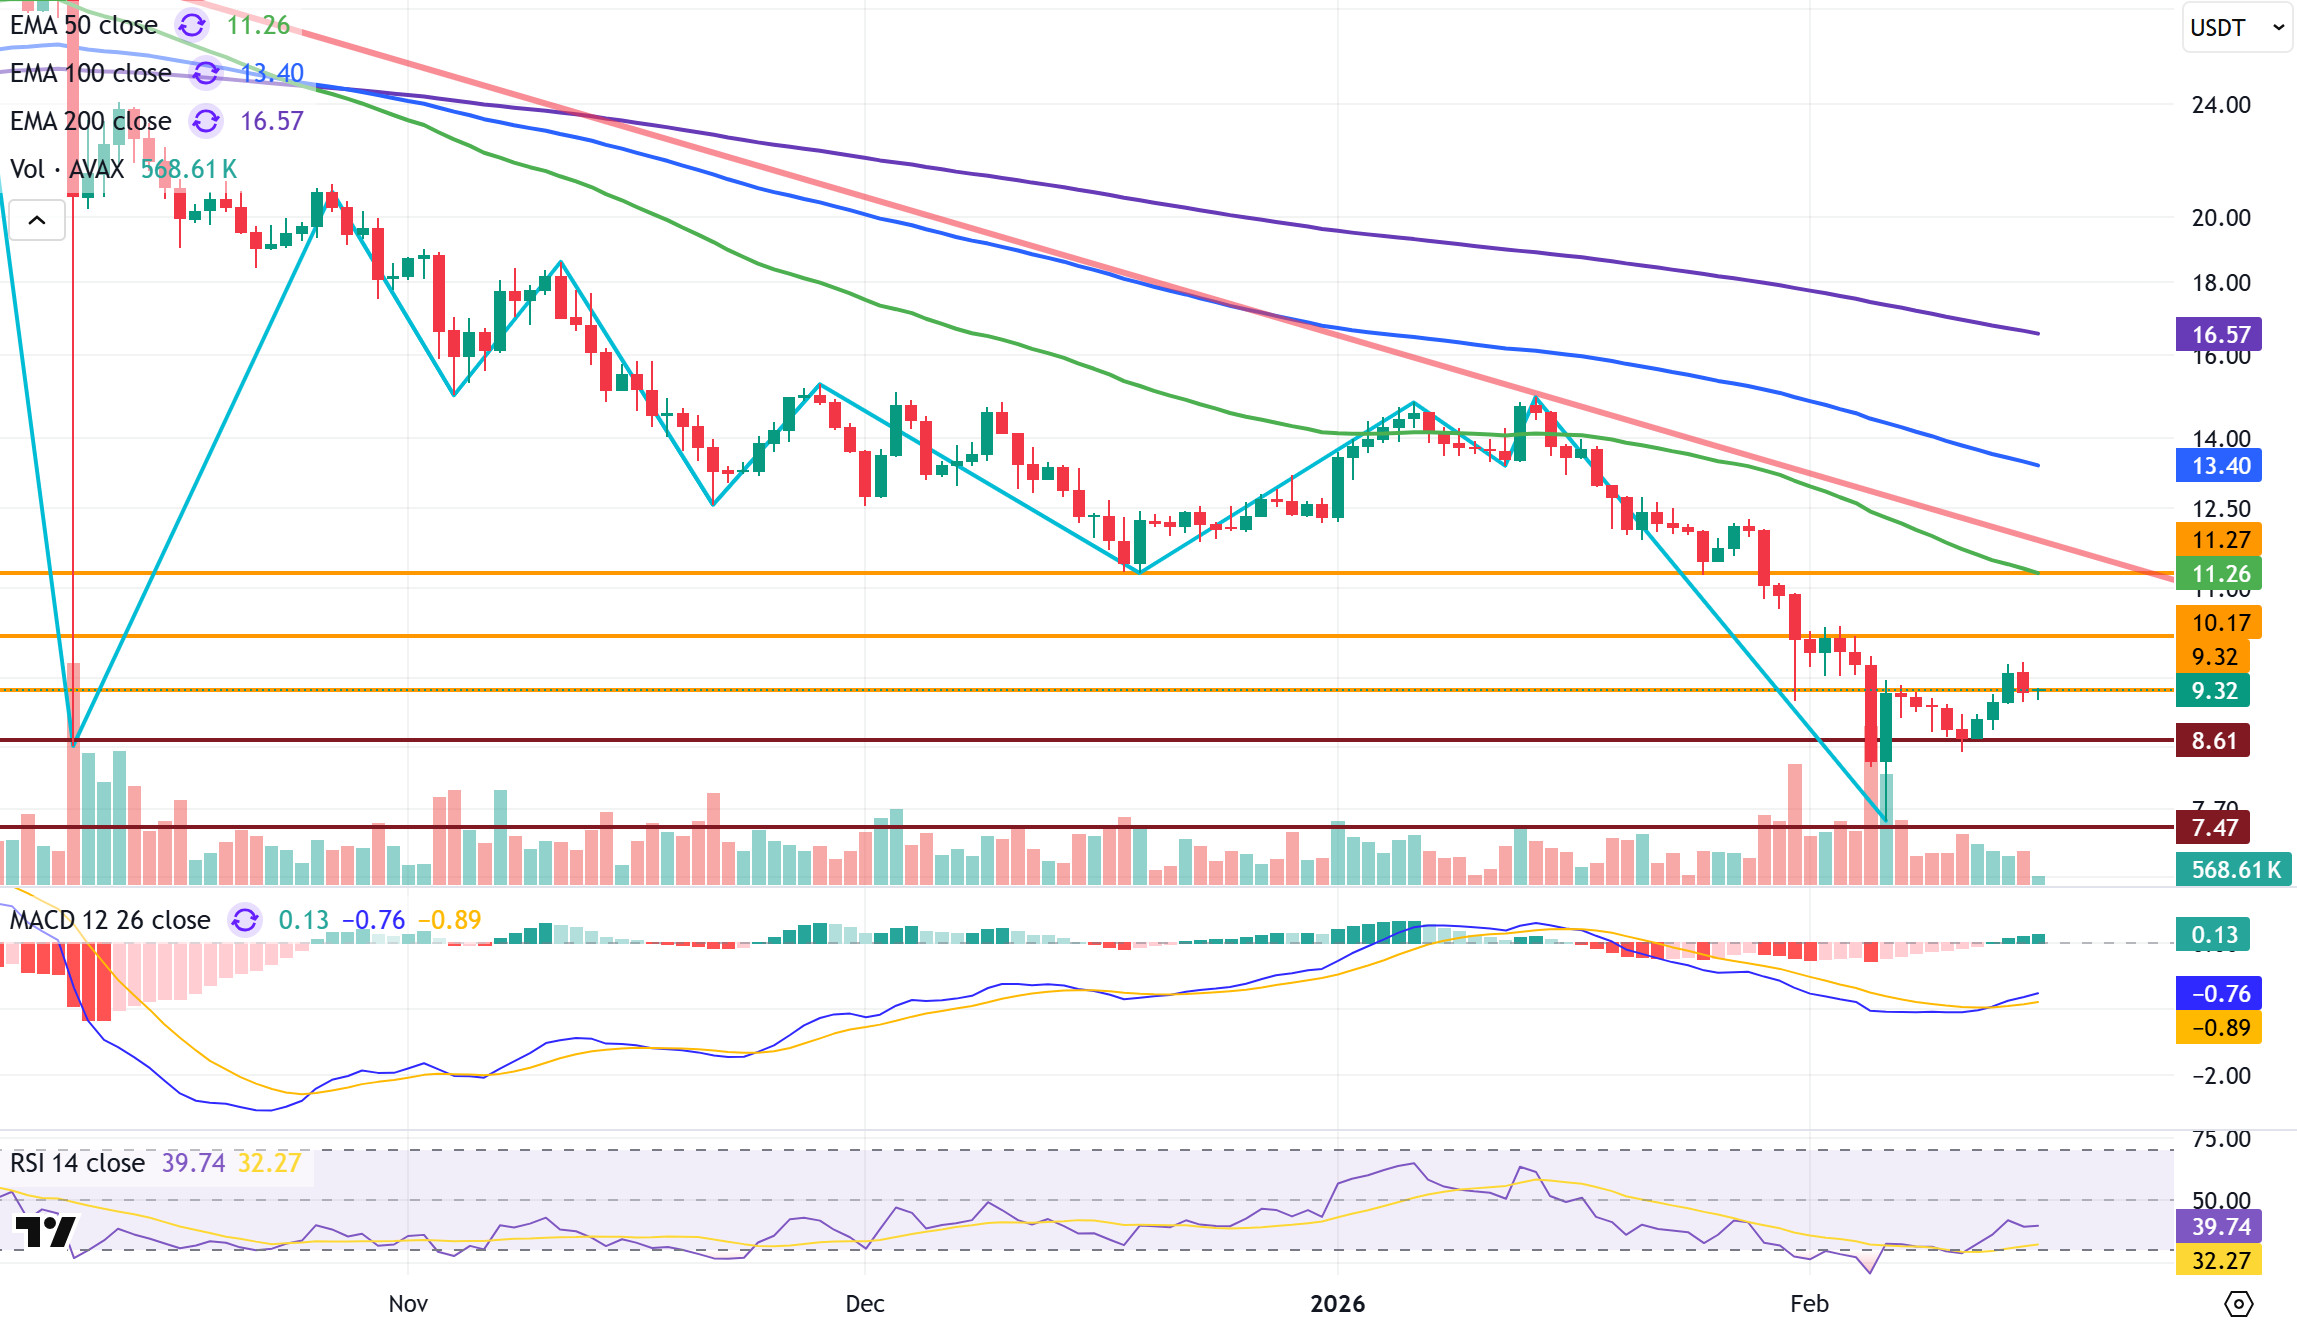
AVAX started last week at $9.08. After falling to $8.43 last week, AVAX rose to $9.75. During AVAX’s decline, the $8.61 support level was tested, and it responded upward with buying from this area. Although the $9.32 resistance level was tested during the rise, it failed to hold above this level. The weekly close was around $9.29, representing a 2.3% increase in value. Both technical and fundamental factors influenced AVAX’s decline and rise last week. Approximately 1.67 million AVAX entered circulation last week. The unlocking created limited pressure on the supply side in the short term. Incoming purchases balanced the decline. On the ETF side, although there was an inflow of approximately $0.9 million, this figure was not sufficient to create strong momentum. Positive developments in the ecosystem supported the price, but low overall market volume and cautious risk appetite limited the upside. Thus, AVAX ended last week in a horizontal range, seeking equilibrium after a sharp decline. It started the new week with a similar horizontal outlook.
On the daily chart, the MACD indicator crossed above the signal line, indicating an upward direction. However, it is still trading in negative territory, suggesting that the upward momentum remains limited and that selling pressure in resistance zones has not completely disappeared. This outlook is technically weak but points to a neutral picture that includes attempts at recovery. AVAX continuing to trade well below critical Exponential Moving Average (EMA) levels confirms that the downtrend is still valid. The distance from the EMAs indicates that a strong resistance band has formed for upward movements. In addition, the RSI (14) indicator is at 39.74. The RSI remaining below the 50 level indicates weak buying pressure, while its distance from the 30 level shows that it has not produced a strong rebound signal from the oversold zone. This situation indicates that a cautious and low-volume equilibrium is prevailing in the market.
Technical indicators generally present a neutral outlook for AVAX. The partial calming of the geopolitical agenda has reduced selling pressure. However, strong risk appetite has not yet materialized. Therefore, upward attempts remain limited. In a bearish scenario for AVAX, the $8.61 level is the first critical support. If it stays below this level, the $7.47 and $6.47 levels could come into play . In the upside scenario, $9.32 stands out as the first important resistance level. If daily closes occur above this level, the $10.17 and $11.27 resistance levels could be tested as the rise continues. The current structure strongly suggests the possibility of fluctuations within a horizontal band in the short term.
(EMA50: Green Line, EMA100: Blue Line, EMA200: Purple Line)
Supports: 8.61 – 7.47 – 6.47
Resistances: 9.32 – 10.17 – 11.27
SHIB/USDT
This week, the Shiba Inu ecosystem shifted its focus to finding a balance between the continuity of burning and infrastructure and user security. At the beginning of the week, the 24-hour burn rate dropping to zero on Shibburn once again highlighted how dependent the automatic burning on Shibarium is on network activity. In the same phase, the transfer of 20,841,045,129 SHIB from hot wallets to cold storage reinforced the perception that a portion of short-term liquidity had been withdrawn from the exchange. Shibariumscan’s warnings regarding server migration and block indexing rates brought data quality risks to the forefront in terms of healthy monitoring of ecosystem metrics, while culture-focused moves such as the collaboration between Astra Nova and Protocol Purgatory fueled the ecosystem’s expansion narrative. On the technology front, the team clarified Shibarium’s roadmap by highlighting the Fully Homomorphic Encryption (FHE)-based privacy upgrade with Zama for Q2 2026.
Market behavior was more active in the second half of the week. On the derivatives side, the increase in Open Interest (OI) signaled renewed strength in short-term trader participation, while a net outflow of approximately 140 billion SHIB from exchanges was interpreted as a weakening of selling pressure and a revival of accumulation trends. The burn side, however, remained unstable. While the burn rate recovered to 2.63 million SHIB in the middle of the week, up 2,097.7%, some windows saw individual transactions drop to symbolic levels like 483 SHIB and then immediately jump to the 838,872 SHIB range. This volatile picture suggested that the price reaction was driven more by flow and sentiment than by burning. Under the security heading, the flagging of 5,000 malicious addresses for address poisoning and social engineering operations targeting Safe Wallet users showed that the main risk lay in the operational layer, which misdirected users to the wrong address, rather than in a protocol vulnerability. Towards the end of the week, Shytoshi Kusama’s UX and UI-focused alpha test signal and the anticipation of the February 17 Eclipse briefing refocused attention back on the product side.
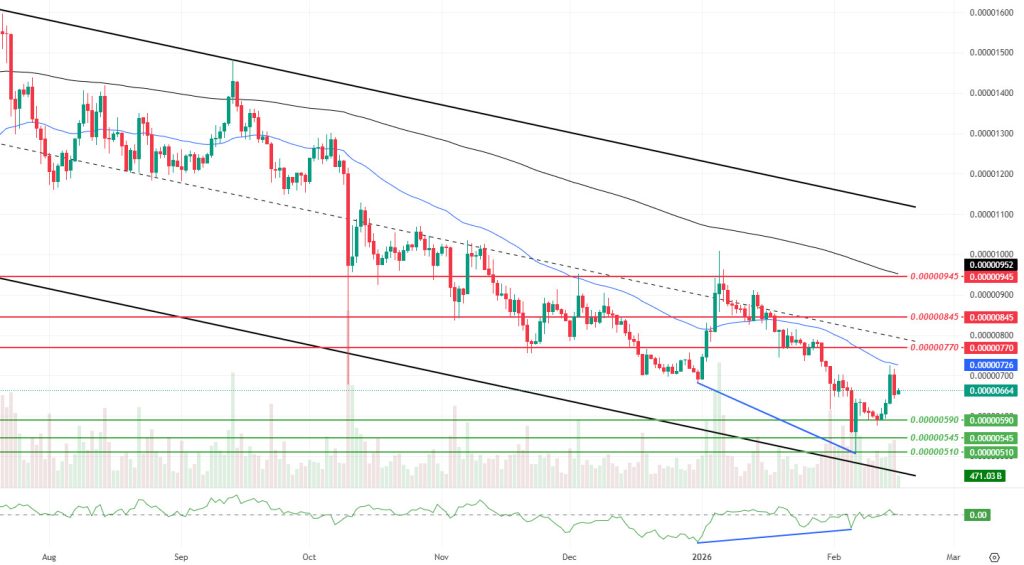
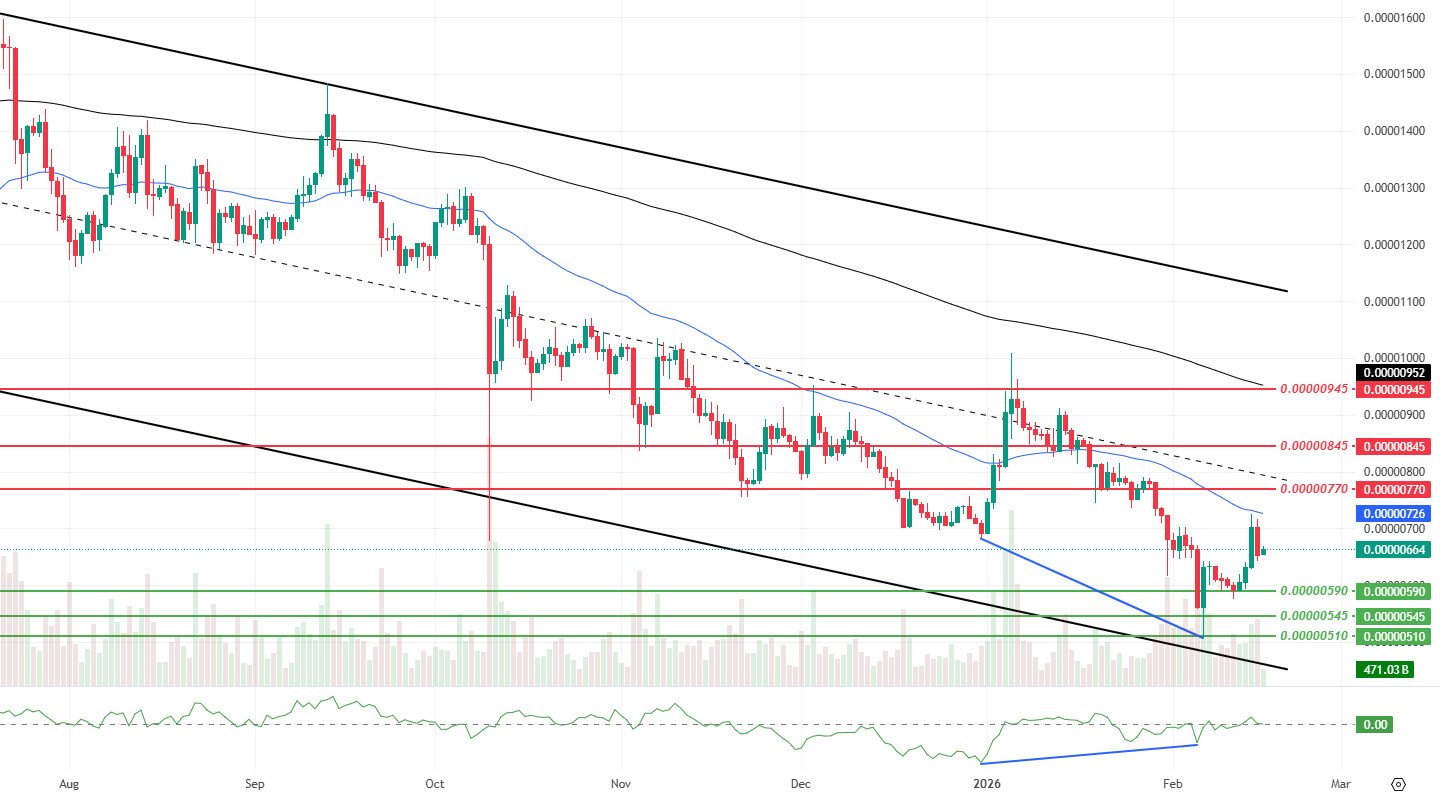
This week’s technical outlook maintains a falling channel structure, but the reaction from the bottom region appears to be progressing in a more controlled manner. The decrease in volatility amid increases in momentum and volume suggests that the rise is being carried by a more balanced squeeze rather than sharp and irregular candle gaps. The Chaikin Money Flow (CMF) indicator hovering in neutral territory indicates that net capital flow has not produced a complete breakout in favor of buying, and that the search for balance in the market is coming to the fore. The fact that last week’s positive divergence (Blue Line) between price and CMF resulted in an upward reaction supports the idea that selling pressure has weakened, but since CMF remains neutral, it is healthier to interpret this movement as a channel-internal reaction rather than a trend reversal for now.
The main reference for the coming week will be whether the $0.00000635 region can be maintained as support. If it stays above this level and the price recovers the 50-period Exponential Moving Average (EMA) zone and breaks through the $0.00000770 resistance, it could open up room for upward movement towards the $0.00000845 and $0.00000945 levels. In this scenario, the CMF moving from the neutral zone to the positive side would be one of the clearest confirmations that the reaction is gaining quality. Conversely, if there is a return below $0.00000635 and weak closes, pressure is expected to expand first towards the $0.00000590 support, then towards the $0.00000545 and $0.00000510 bands. In this case, the CMF falling below the neutral zone would produce an early warning that the reaction is weakening. It should be remembered that as long as the price remains below the 200-period EMA, the main trend remains downward, so the risk of resistance zones hardening during upward attempts continues.
(EMA200: Black line, EMA50: Blue line)
Supports: 0.00000590 – 0.00000545 – 0.00000510
Resistances: 0.00000770 – 0.00000845 – 0.00000945
 BNB/USDT
When comparing the BNB Chain’s data from the end of January and the beginning of February, a clear divergence is observed in the ecosystem’s user base and liquidity structure; while the number of daily active users on the BSC network increased by approximately 15% to reach 2.98 million, a 22.6% decline on the opBNB side indicates that user interest has returned to the main network. Although the total number of transactions on both networks fell by approximately 11-14% and the total transaction volume declined to $51.4 billion, the Total Value Locked (TVL) surged by a significant 30% from $6.83 billion to $8.9 billion, indicating that assets on the network are gaining value or that users are choosing to lock their assets in the ecosystem rather than trade them.
In summary, while there has been a short-term cooling in trading intensity and volume, the significant increase in confidence in the ecosystem and the amount of assets held (TVL) presents a positive fundamental outlook for the BNB Chain.
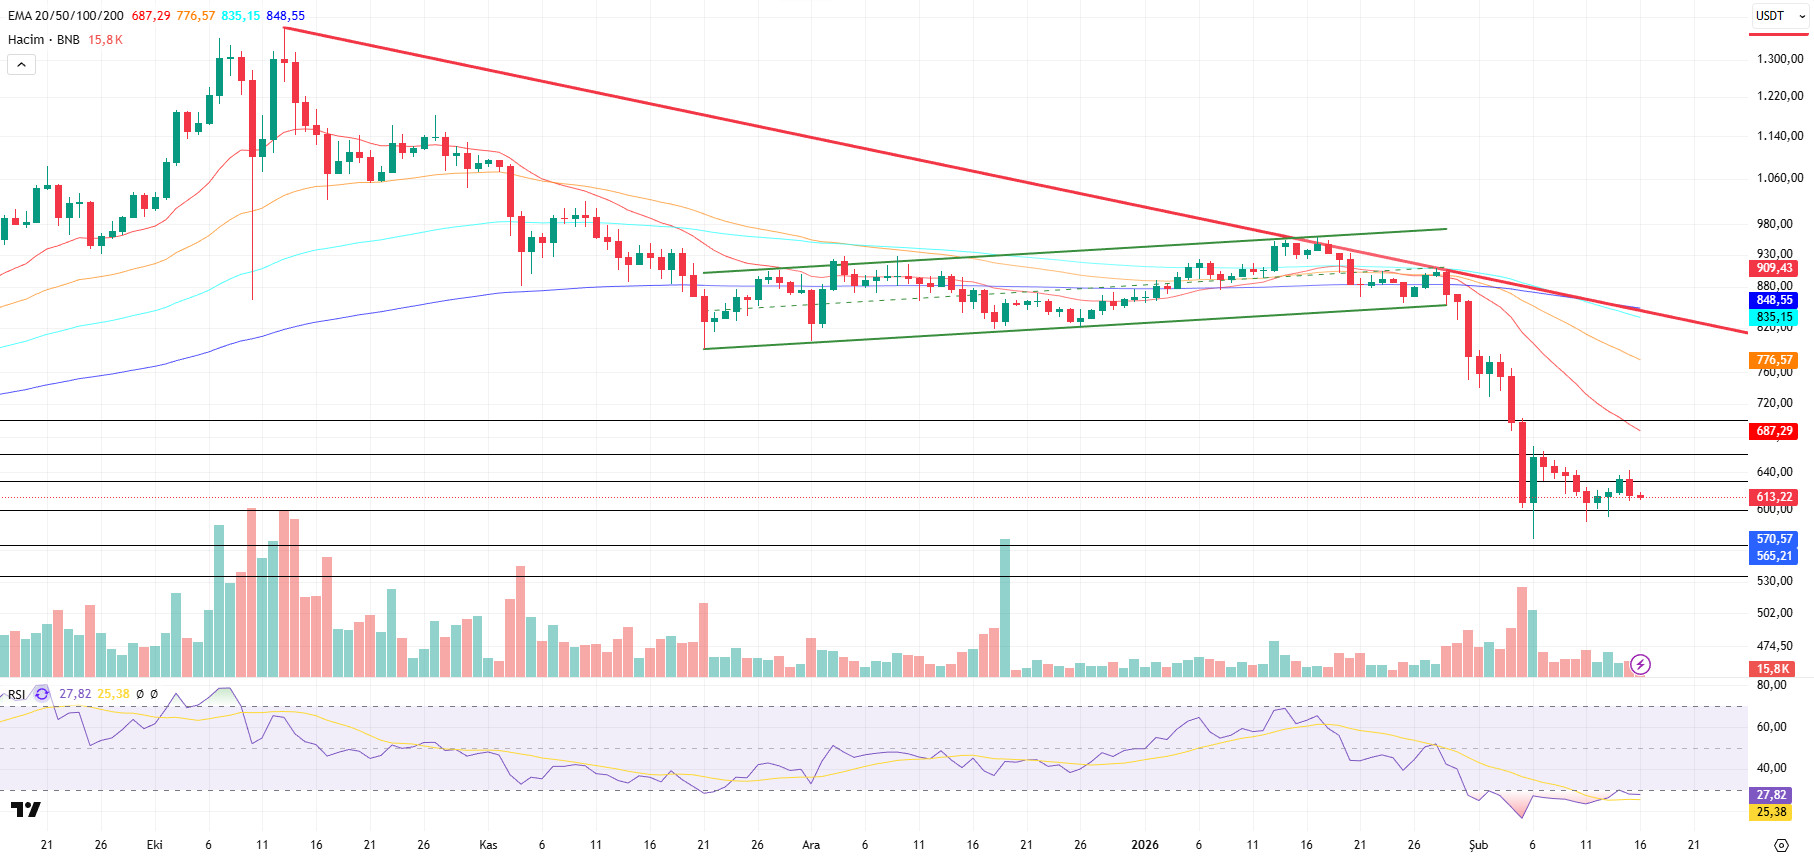
From a technical perspective, BNB, which has been strengthening its upward momentum for some time, has surpassed its previously set target levels and reached the $950 threshold. Facing pressure at these levels, it has gained downward momentum, remaining below the ongoing downtrend.
Technical indicators for the asset, currently trading in the $600-$630 range, show that declining trading volume is supporting the pullback momentum. In addition, the Relative Strength Index (RSI) falling below the 30 level is considered critical data confirming the current technical outlook.
Accordingly, if selling pressure intensifies, the price is expected to test the $600 support level first. If this level is broken downward, the possibility of a pullback towards the $565 and $535 support zones will remain on the agenda.
If buying appetite continues and market momentum strengthens, the asset is expected to retest the $630 resistance level in the first stage. If this level is exceeded, it appears technically possible to move above the falling trend line. If the trend breakout is confirmed and the price maintains stability above this region, the $660 and $700 levels can be tracked as the next upside targets.
Supports: 600 – 565 – 535
Resistances: 630 – 660 – 700
LTC/USDT
Litecoin (LTC) ended last week with a 1.01% increase against USDT and started the new week at $55.08. At the same time, it gained 3.09% against Bitcoin, showing a relatively stronger performance compared to Bitcoin.
In the current table, Litecoin’s total market value stands at approximately $4.2 billion, while it has dropped two places in the global ranking to 23rd place. In other words, although there are signs of recovery in terms of price, momentum has worked against it in market value-based competition. On the futures front, the total open interest remaining nearly flat on a weekly basis indicates that there has been no new and aggressive money entering the market. In addition, the long/short ratio of 0.899 in new positions opened at the beginning of the week reveals that the weight on the derivatives side is still in favor of short-term trades. In other words, the majority of newly opened contracts are positioned with a bearish outlook.
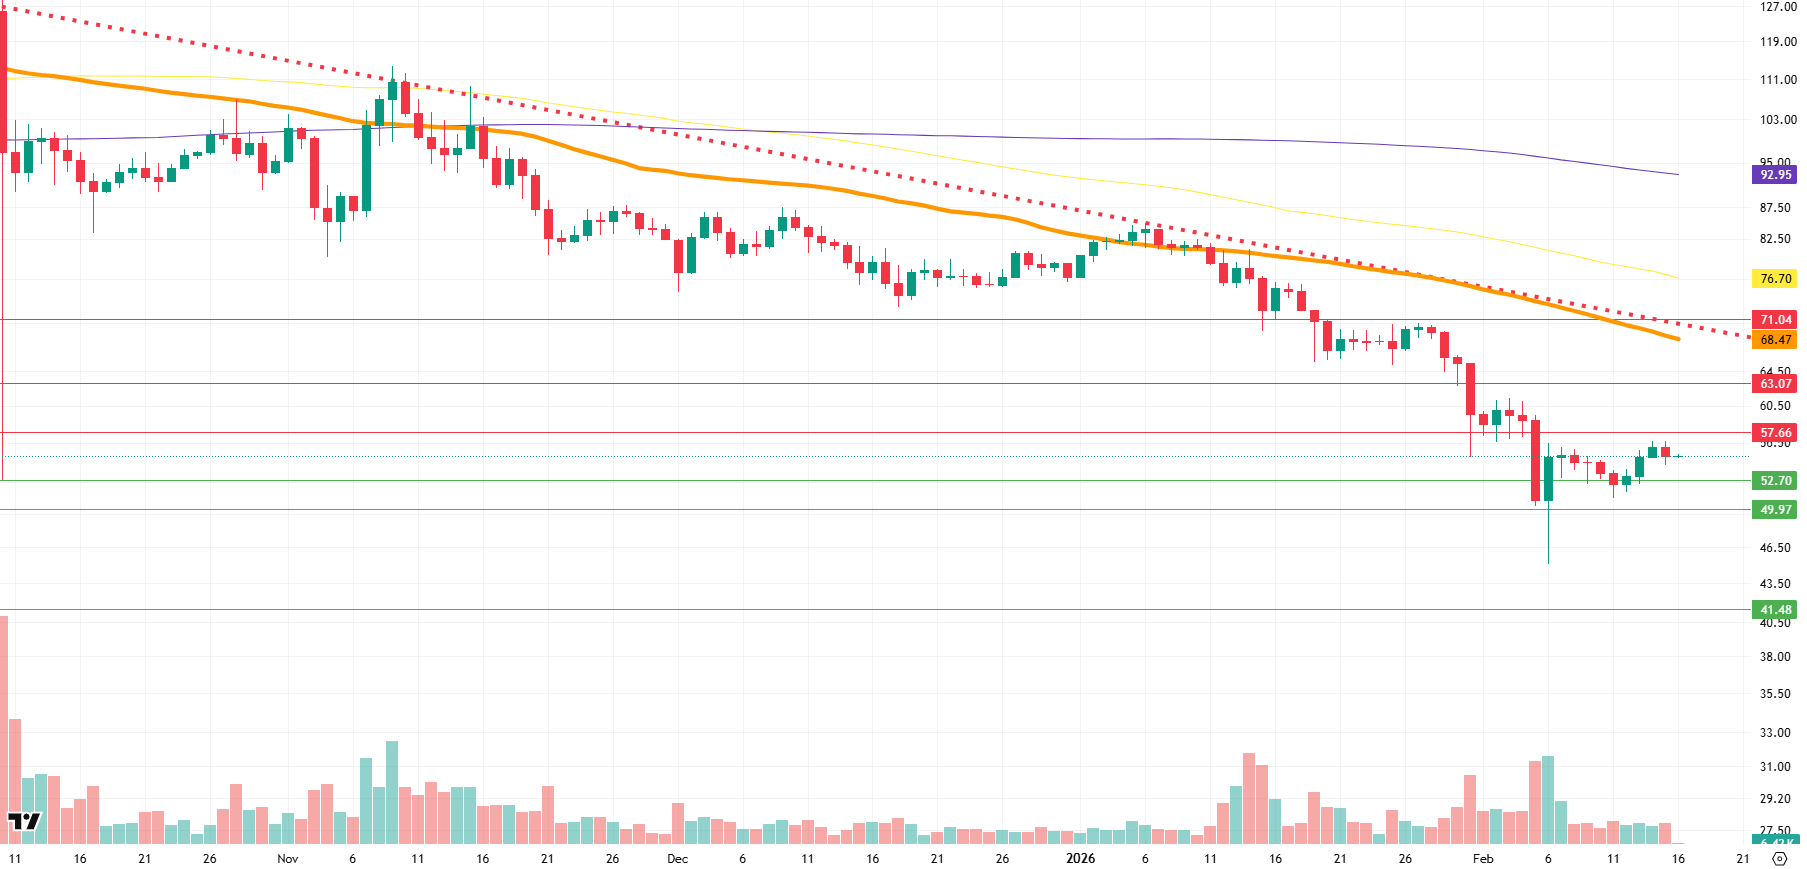
When examining the daily candlestick chart, it is noteworthy that the Litecoin price is trading below the 100-period (yellow), 200-period (purple), and 50-period (orange) moving averages. This technical structure presents a clear picture indicating that control in the market still lies with sellers. In particular, the price continuing to remain below both the medium and long-term averages confirms that upward attempts remain weak and selling pressure persists.
Contrary to the general expectations of derivatives market participants, if an upward scenario comes into play, the first strong threshold the price may encounter will be the horizontal resistance at the 57.66 level. This area should be monitored as the first pause zone where short-term profit-taking could come into play. If the upward momentum is maintained and the 57.66 level is breached, the next major resistance level is 63.07. This level will serve as an important intermediate test of whether the trend can gain strength. Finally, the 71.04 level, which is positioned above the descending horizontal trend line supported by the 50-period moving average and has historically acted as horizontal resistance, is considered the most critical threshold for this period. In a potential upside scenario, this will be the main area where selling pressure is expected to intensify most significantly.
If new positions opened on the futures side meet downward expectations, selling pressure is likely to continue. In such a scenario, reactionary buying and profit-taking on short positions are likely to come from the horizontal support at the 52.70 level in the first stage. This level may serve as a decisive threshold for the start of an upward reaction. However, if the 52.70 support is broken downward, the next critical level would be the 49.97 horizontal support. Possible scenarios include the price attempting to hold in this region or gathering liquidity with a short-term spike. Finally, if both support levels are lost, the downward movement is expected to deepen, bringing the 41.48 level into focus as the new bottom region.
Supports: 52.70 – 49.97 – 41.48
Resistances 57.66 – 63.07 – 71.04
LINK/USDT
Recently, the Commodity Futures Trading Commission (CFTC) established an advisory committee on crypto assets, and the inclusion of Chainlink CEO Sergey Nazarov on this committee sent an important message that industry representatives will be at the table on the regulatory side. This development alone is not a catalyst that will drive the price up; however, especially when discussing oracle infrastructure and the integration of real-world assets (RWA) on-chain, Chainlink’s involvement in decision-making mechanisms should be noted as a strategic point for long-term positioning. In addition, Chainlink purchased 135,693.16 more LINK tokens for its reserve, bringing its total reserve to 2.04 million tokens. Especially when macro liquidity conditions are tight, internal accumulation moves are seen as reassuring for investor psychology and create supply pressure.
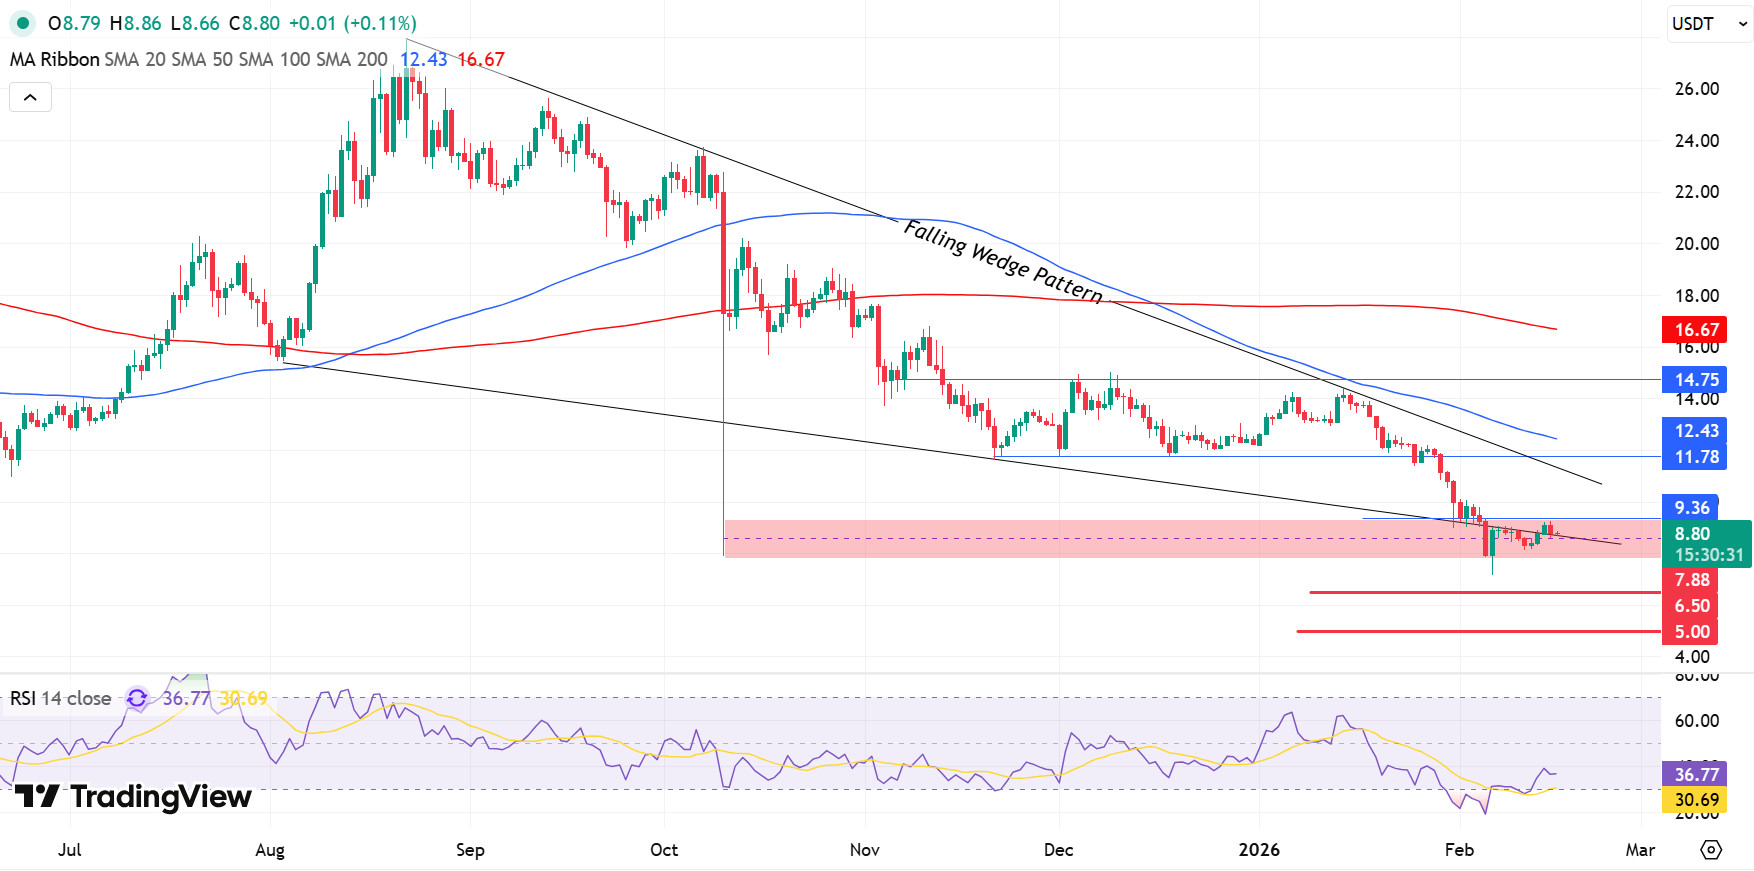
On the technical front, the picture remains cautious. The downtrend structure remains intact. The price has been moving within a lower high – lower low pattern for a long time and continues to stay below both the 50-day and 200-day simple moving averages. The downward slope of these two averages has so far limited the rebound rallies to only weak corrections. For us to talk about a trend change, this structure must first break, and then it would be much healthier to see the averages recover.
The price is currently trying to stabilize within the red-shaded demand zone we highlighted weeks ago. This area is also psychologically important because it is the point where the decline lost momentum and selling pressure slowed down. As long as it stays above this zone, short-term rebound attempts are possible. The 9.36 level above is the first serious barrier. This level is not only horizontal resistance but also an area where short-term sellers are concentrated. If there is a high-volume breakout, a relief zone could form up to the 11.78 and then 12.43 bands. In particular, a daily close above 12.43 would break the wedge formation, significantly softening the technical outlook and shifting the structure into positive territory.
The downside risk is clearer and faster. Persistent closes below the 8.00 level could trigger the area where liquidity accumulates on the chart. While 7.88 is the first stop, the real gap is felt around 6.50. In such downward structures, support breakouts are generally sharp because there is a large accumulation of downward stops, and the market tends to test this liquidity. Therefore, while upward movement can be spread over time, downward breakouts are generally more aggressive.
On the momentum side, the Relative Strength Index (RSI) has not yet produced a strong reversal signal. It is hovering in the 30–40 band; the RSI needs to settle above 50 and make this level a support for us to be able to talk about momentum changing direction. Otherwise, the movements seen may remain short-term breathing space.
Supports: 7.88 – 7.50 – 5.00
Resistances: 9.36 – 12.43 – 14.75
SUI/USDT
This week, there were significant and noteworthy developments in the Sui (SUI) ecosystem. The Ethena-backed suiUSDe stablecoin went live, and the first yield system was launched on it. This new stablecoin is expected to increase the DeFi liquidity and product diversity of the Sui ecosystem. This step is seen as a major fundamental development, particularly because it facilitates access to SUI for US institutional and individual investors. It was also announced that a portion of the fees earned will be used for buybacks of Sui coins.
Meanwhile, Sui was listed on HashKey Exchange, one of Hong Kong’s licensed exchanges, on February 13. Evan Cheng, CEO of Mysten Labs, stated that they will also be active in the Chinese market, emphasizing that institutional interest in Sui has peaked and that the network is ideal for “agentic commerce” (AI-based trading).
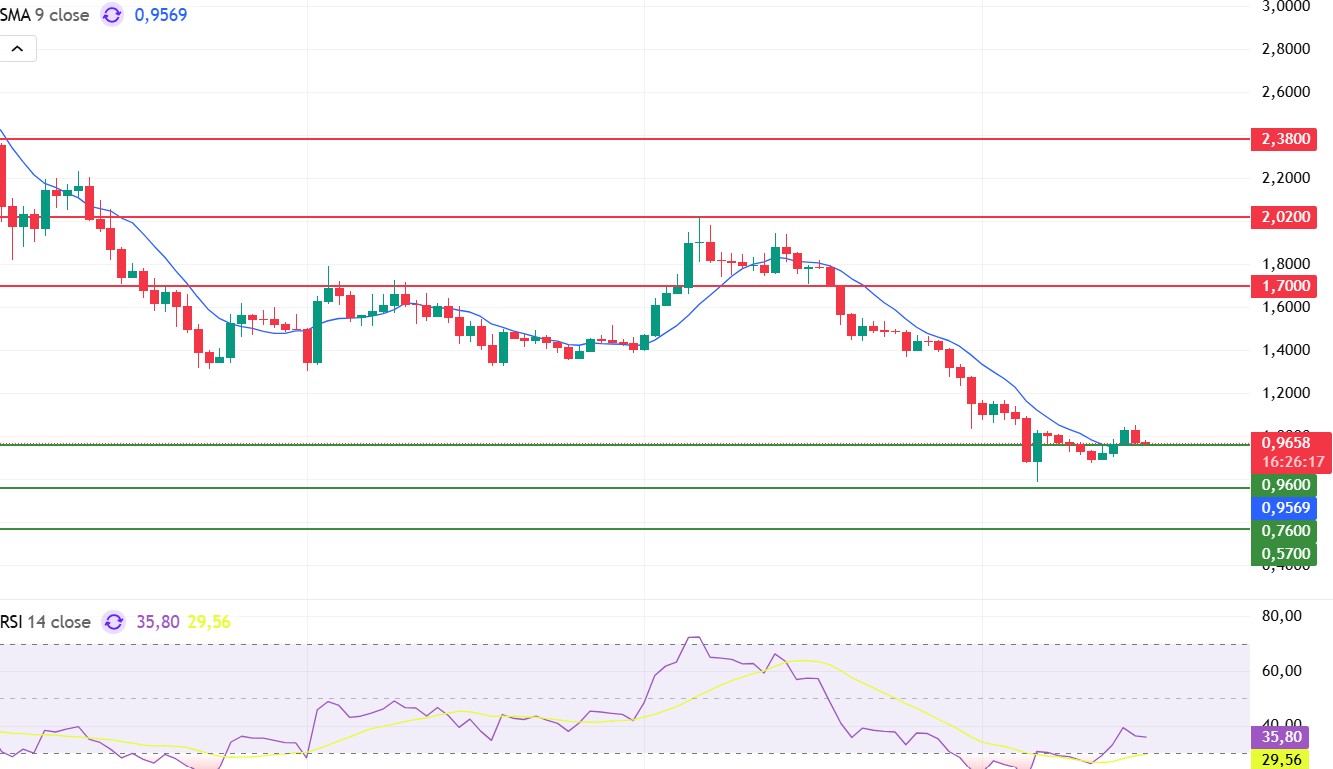
Looking at Sui’s technical outlook following recent developments, we see that the price has been trending downward at around $0.96 on a weekly basis, influenced by fundamental developments. The Relative Strength Index (RSI) is currently in the range of 24.37 – 32.84. This range indicates that the market is trading close to the buy zone; if the RSI continues below the 35.00 – 40.00 range in these areas, it could signal a potential buying opportunity. If the price moves upward, the resistance levels of $1.70, $2.02, and $2.18 can be monitored. However, if the price falls to new lows, it may indicate that selling pressure could deepen. In this case, the support levels of $0.57, $0.76, and $0.96 come to the fore. Based on the trend line, a pullback to $0.76 appears technically possible. According to Simple Moving Averages (SMA) data, Sui’s average price is currently at $0.95. The price being close to this level indicates that the current uptrend could technically continue.
Supports: 0.57 – 0.76 – 0.96
Resistances: 1.70 – 2.02 – 2.18
ADA/USDT
Since last week, the ADA price has gained 7% in value, rising to $0.2858. Looking at Cardano Whale data, addresses holding between 10 million and 100 million ADA have increased their holdings in recent days. Several of these wallets added over 220 million ADA worth more than $61 million. Cardano processes 250 transactions per second, and the upcoming Hydra upgrade aims to potentially increase transaction volume to one million TPS, putting it in a competitive position against both Ethereum and Solana. Cardano founder Hoskinson argues that the market needs to expand beyond finance, suggesting that services like Tinder should be integrated into the blockchain. According to him, the next surge in crypto will be driven not only by money but also by games and mainstream applications that require broader adoption.
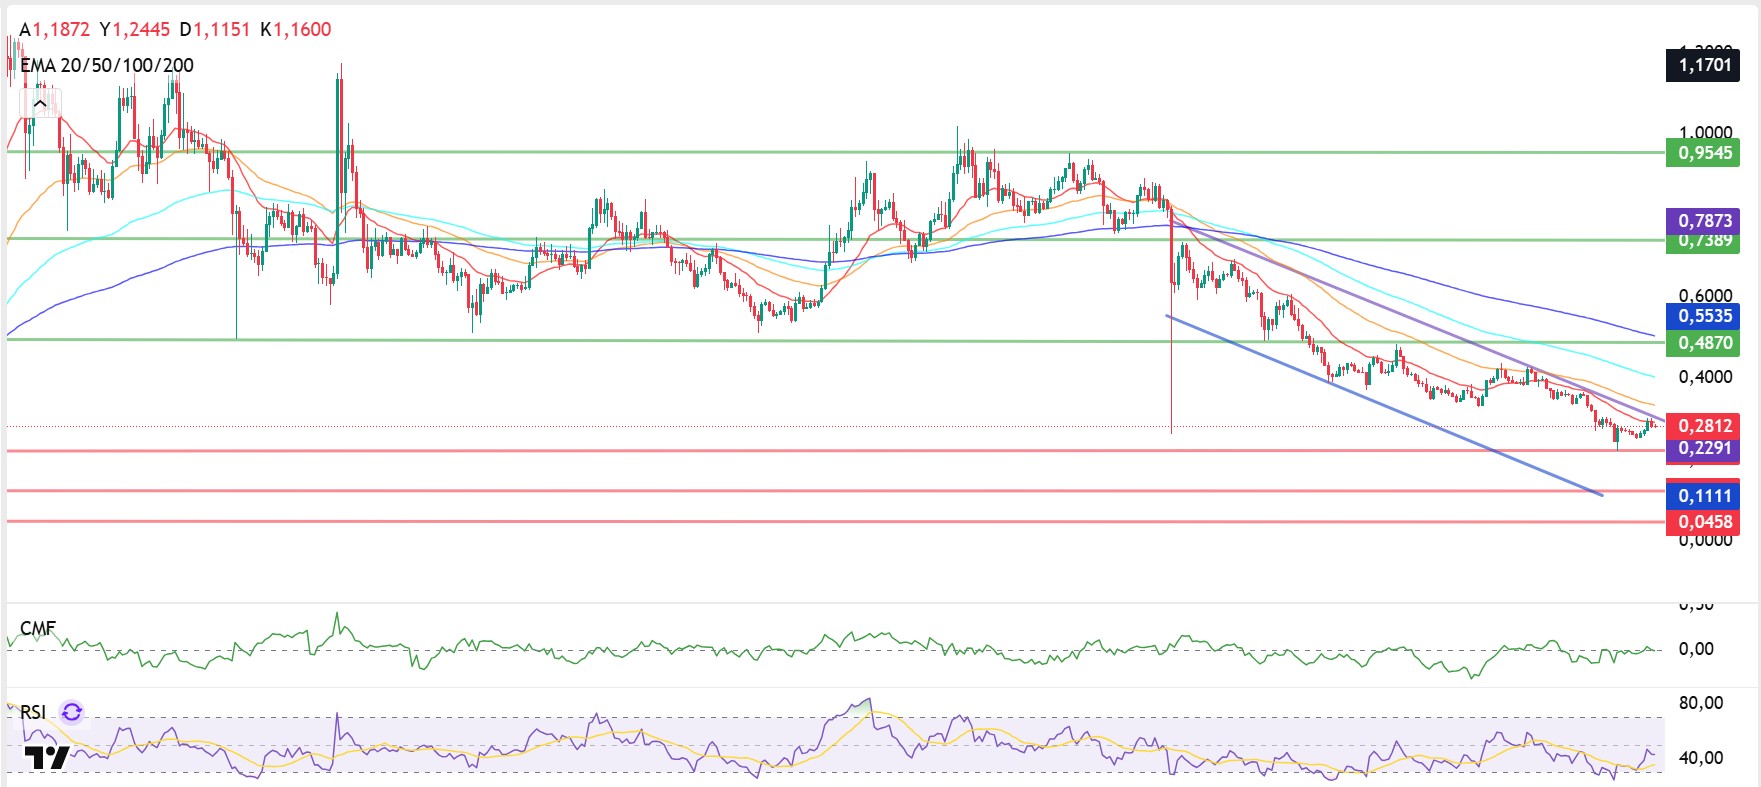
Technically speaking, it continues to trade below the 50-day and 200-day Exponential Moving Average (EMA 50 – Orange Line)(EMA 200- Blue Line). The price may continue in the downtrend channel as long as it does not close above the 20-day EMA (Red Line). To expect the price to stabilize at these levels, the $0.4870 level can be monitored as the first resistance level. If it rebounds from here, the upward movement is expected to continue to the second resistance point at the $0.7873 level. These levels indicate that ADA buyers are willing to buy at higher prices, showing that buying pressure is increasing over time. While the Relative Strength Index (RSI) continues to move in neutral territory, falling to 43 levels, the Chaikin Money Flow (CMF-20) remains at 0.01 levels, indicating that the price is in the selling zone. If the price falls as a result of the macroeconomic data expected to be announced this week and the statements to be made by US President Trump, the important levels we will follow are $0.2291 and $0.1111. If it closes below this level, the $0.2146 level may come to the fore as a support point.
Supports: 0.2291 – 0.1111 – 0.0458
Resistances: 0.9545 – 0.7873 – 0.4870
Legal Notice
The investment information, comments, and recommendations contained in this document do not constitute investment advisory services. Investment advisory services are provided by authorized institutions on a personal basis, taking into account the risk and return preferences of individuals. The comments and recommendations contained in this document are of a general nature. These recommendations may not be suitable for your financial situation and risk and return preferences. Therefore, making an investment decision based solely on the information contained in this document may not result in outcomes that align with your expectations.

