
Fear & Greed Index
Source: Alternative.me
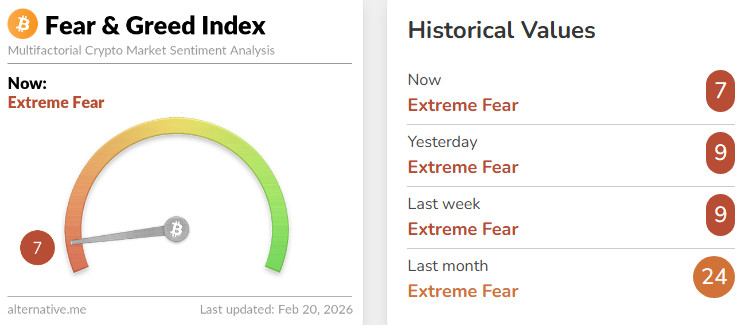
- Change in Fear and Greed Value: -2
- Last Week’s Level: 9
- This Week’s Level: 7
The Fear and Greed Index fell from 9 last week to 7 this week, indicating that sentiment has shifted to an even more defensive stance in the extreme fear zone. Interpreting this movement solely as a weakening would be incomplete, as the main theme priced in this week was the renewed strength of the idea that financial conditions will not ease rapidly and that recovery in risky assets will not come easily.
On the macro side, the picture painted by the Fed minutes did not produce the clear easing signal the market wanted to see. Within the committee, a tone emerged where, on the one hand, some remained cautious about easing before the inflation risk subsided, while on the other, some said that room for cuts could only open up with data confirmation. This uncertainty pushed back the path to rate cuts, bringing dollar and bond yield sensitivity back to the forefront. At the same time, strong weekly jobless claims reinforced the perception that employment is resilient enough not to rush the Fed. While the decline in pending home sales signaled cooling growth, the market priced this not as reassuring but as a reminder that financing conditions are suppressing demand.
On the geopolitical front, rising tensions between the US and Iran increased risk premiums, creating pressure that pushed inflation expectations back up via oil. This both fueled volatility in the market and reinforced concerns that interest rates could remain high for longer. On the crypto side, no clear catalyst emerged to drive buying appetite; particularly, the lack of clarity on the regulatory framework, especially in controversial areas like stablecoin returns, kept the market cautious. As a result, when volatility, momentum, and volume—the channels most sensitive to the index—weakened simultaneously, Fear and Greed fell from 9 to 7, seeking a lower equilibrium in the extreme fear zone.
Fund Flows
Source: Coinshares
Overview:
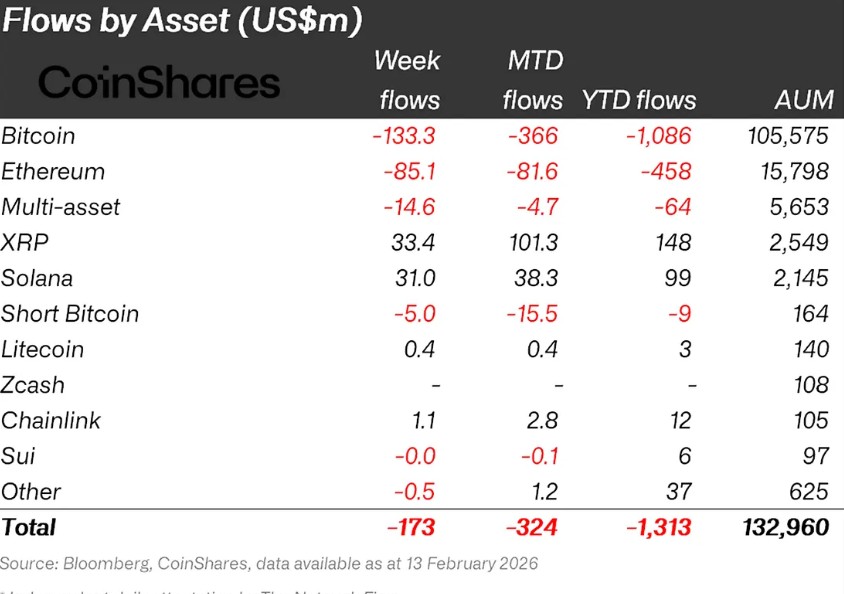
Crypto markets experienced another week of significant declines, marked by the US’s planned operation against Iran and renewed details surrounding the Epstein case. As a result, Bitcoin lost over 3% of its value throughout the week.
- Solana (SOL): Solana saw an inflow of $31.0 million.
- Chainlink (LINK): Chainlink saw an inflow of $1.1 million.
- Ripple (XRP): XRP saw an inflow of $33.4 million.
Fund Outflows:
- Bitcoin (BTC): Bitcoin experienced significant outflows from investors this week. Bitcoin-focused funds saw outflows of $133.3 million.
- Ethereum (ETH): Along with spot ETH inflows, there was an outflow of $85.1 million from Ethereum this week.
- Short Bitcoin: Short Bitcoin saw an outflow of $5.0 million.
- Multi-asset: Outflows were observed in the multi-asset group.
- Other: Sector-specific and project-based declines in altcoins, along with the overall market sentiment, resulted in a $0.5 million outflow in fund flow data.
Total MarketCap
Source: TradingView
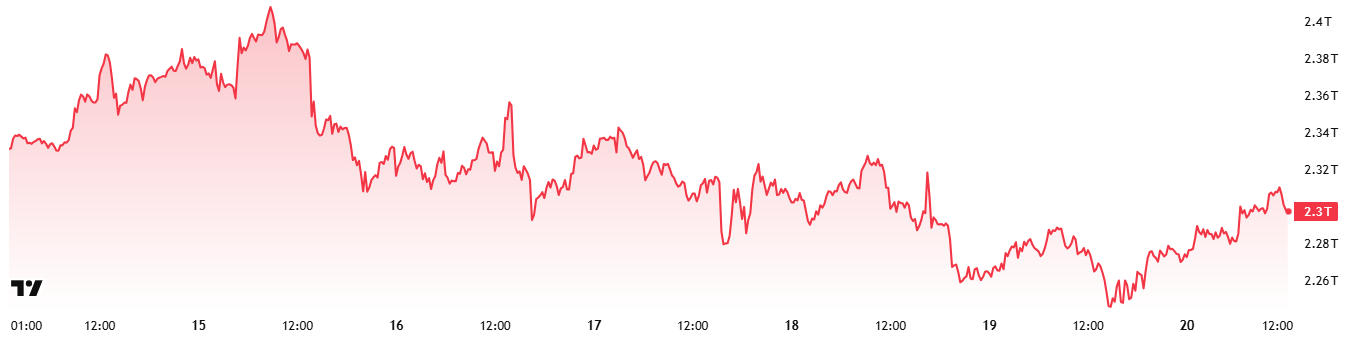
- Last Week’s Market Value: $2.33 Trillion
- This Week’s Market Value: 2.3 trillion USD
This week, the cryptocurrency market experienced a decline of approximately 30 billion USD, falling by 1.32%, and the total market cap is currently hovering around 2.3 trillion USD. The weekly high was recorded at 2.37 trillion USD, while the low was 2.24 trillion USD. Accordingly, the market moved within a band of ~135 billion USD, indicating a volatility of 6.05% during the period. In this context, it can be said that the weekly average candle length in the cryptocurrency market was in line with the average.
Total 2
Starting the week with a market value of 952.25 billion USD, the Total 2 index declined by 1.18% during the week, losing approximately 11.28 billion USD, and is currently at 940.97 billion USD. The weekly high was recorded at 969.35 billion USD, while the low was 922.91 billion USD. The index fluctuated within a band of 46.43 billion USD, corresponding to volatility of approximately 5.03% for the period.
With this outlook, Total 2 continues to trade approximately 826 billion USD below its all-time high. It is estimated that an upward movement of approximately 87.80% is required to reach its previous peak from current levels.
Total 3
The Total 3 index, which started the week with a total market value of $715.05 billion, declined by approximately $9.18 billion during the week, falling by 1.28% to currently stand at $705.87 billion. Volatility between the weekly high and low was measured at 4.7%.
The proportional ranking of the indices according to volatility, which is “Total > Total 2 > Total 3,” shows that the sharpest volatility market cap loss this negative week occurred on the Bitcoin side, followed by Ethereum and the average of other altcoins.
Altcoin Season Index
Source: Coinmarketcap
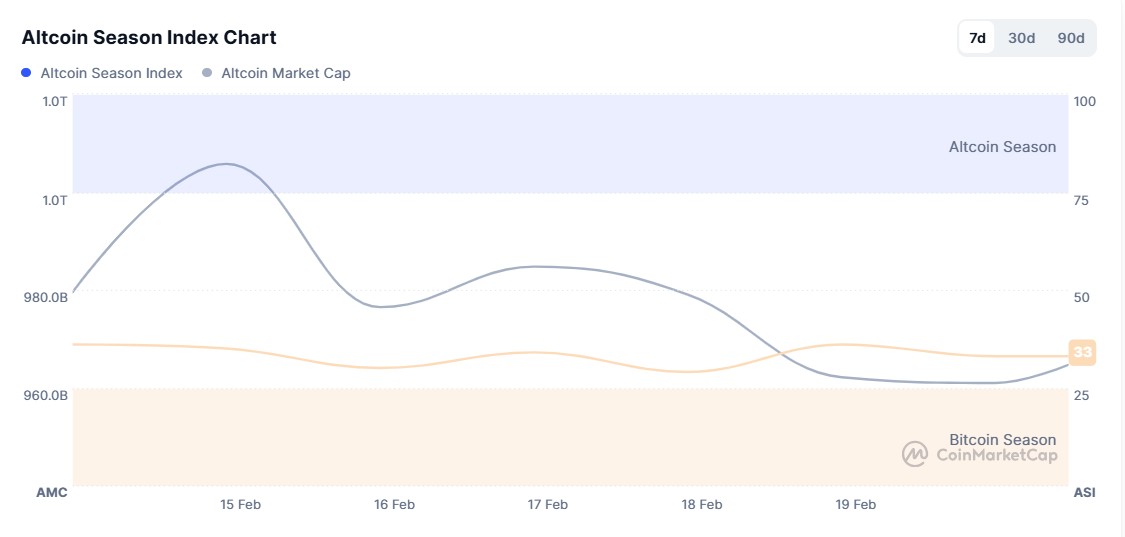
- Last Week’s Index Value: 31/100
- This Week’s Index Value: 33/100
Between February 13 and 20, 2026, a partial increase was observed in the correlation between altcoin market dominance (Altcoin Market Cap) and the Altcoin Season Index. The graph shows that the index retreated to 33 on February 20, the highest point this week, indicating that the Altcoin Market Cap fell below 1.00T. When the index rose this week, the top 5 coins leading the rise were PIPPIN, KITE, CC, SKY, and H. In summary, the Altcoin Season Index rose this week compared to last week, indicating a relative increase in the total market value of altcoins compared to Bitcoin.
Bitcoin Dominance
Source: Tradingview
Weekly Change
- Last Week’s Level:89%
- This Week’s Level:85%
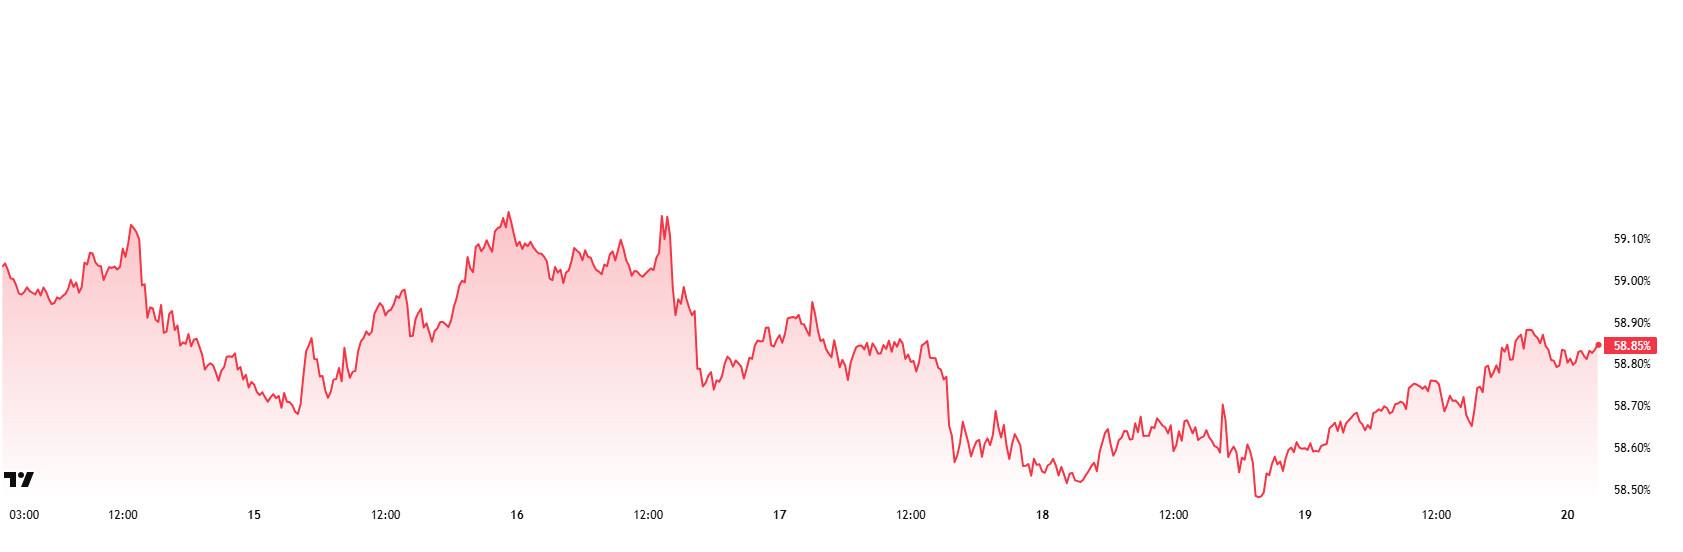
Bitcoin dominance, which started the week at 59.09%, fell to 58.56% during the week but then rose slightly and is currently at 58.85%.
This week, Strategy purchased 2,486 Bitcoin and DDC Enterprise purchased 80 Bitcoin. Additionally, data on Bitcoin spot ETFs shows a net outflow of $403.9 million to date.
Weekly data shows that Strategy continues to purchase Bitcoin steadily, while DDC Enterprise maintains its regular accumulation strategy. No significant purchases have been recorded from other treasury companies, indicating that a wait-and-see approach is being maintained at current price levels. This outlook suggests that institutional demand has not completely disappeared but continues through a limited number of companies. The continued net outflow trend on the ETF side also indicates that selling pressure remains in the short term. The overall picture shows no significant change compared to last week. While Bitcoin maintained its dominance in the market, limited resistance was observed in the altcoin front until midweek, but a noticeable weakening, particularly in Ethereum, has been observed since midweek. Despite this, there is no strong signal of a break in Bitcoin dominance yet. It is expected to continue moving in the 58%–61% range next week.
Ethereum Dominance
Source: Tradingview
Weekly Change:
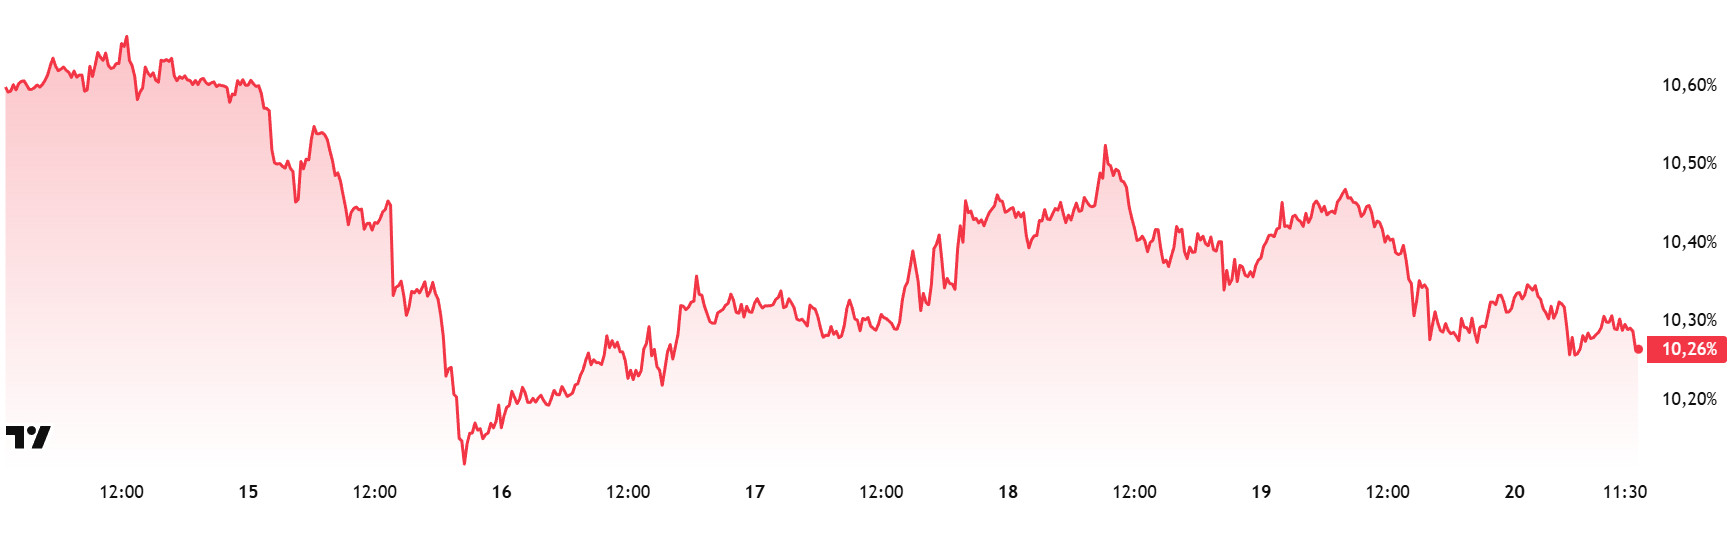
- Last Week’s Level: 10.19%
- This Week’s Level: 1 0.26%
Ethereum dominance, which rose to 15% levels in mid-August, lost momentum in the following period and entered a downward trend. This negative outlook progressed to 13% levels with a positive correction until the last week of November. However, it saw strong pressure from this level and turned downward again. In the last week, some positive momentum was observed.
In this context, Ethereum dominance ended last week at 10.19% and is currently trading at around 10.26%. During the same period, Bitcoin dominance has followed a negative trend, unlike Ethereum dominance.
The key developments affecting Ethereum dominance are as follows:
The Ethereum Foundation updated its 2026 protocol priorities under the headings of scalability, user experience, and strengthening L1 security. Plans include increasing the gas limit to 100 million, developing ePBS, and accelerating zkEVM work. The Glamsterdam upgrade is targeted for deployment in the first half of 2026.
Ethereum Foundation Co-Executive Director Tomasz Stańczak said Ethereum could be the first blockchain to work with large language models. He noted that Ethereum has a natural advantage thanks to its transparent governance structure and technical documentation. It was announced that the Foundation has established a decentralized artificial intelligence team and taken new steps for coordination in this area. This approach aims to accelerate the integration of artificial intelligence with the blockchain.
Bitcoin Spot ETF
Source: Darkex Research Department
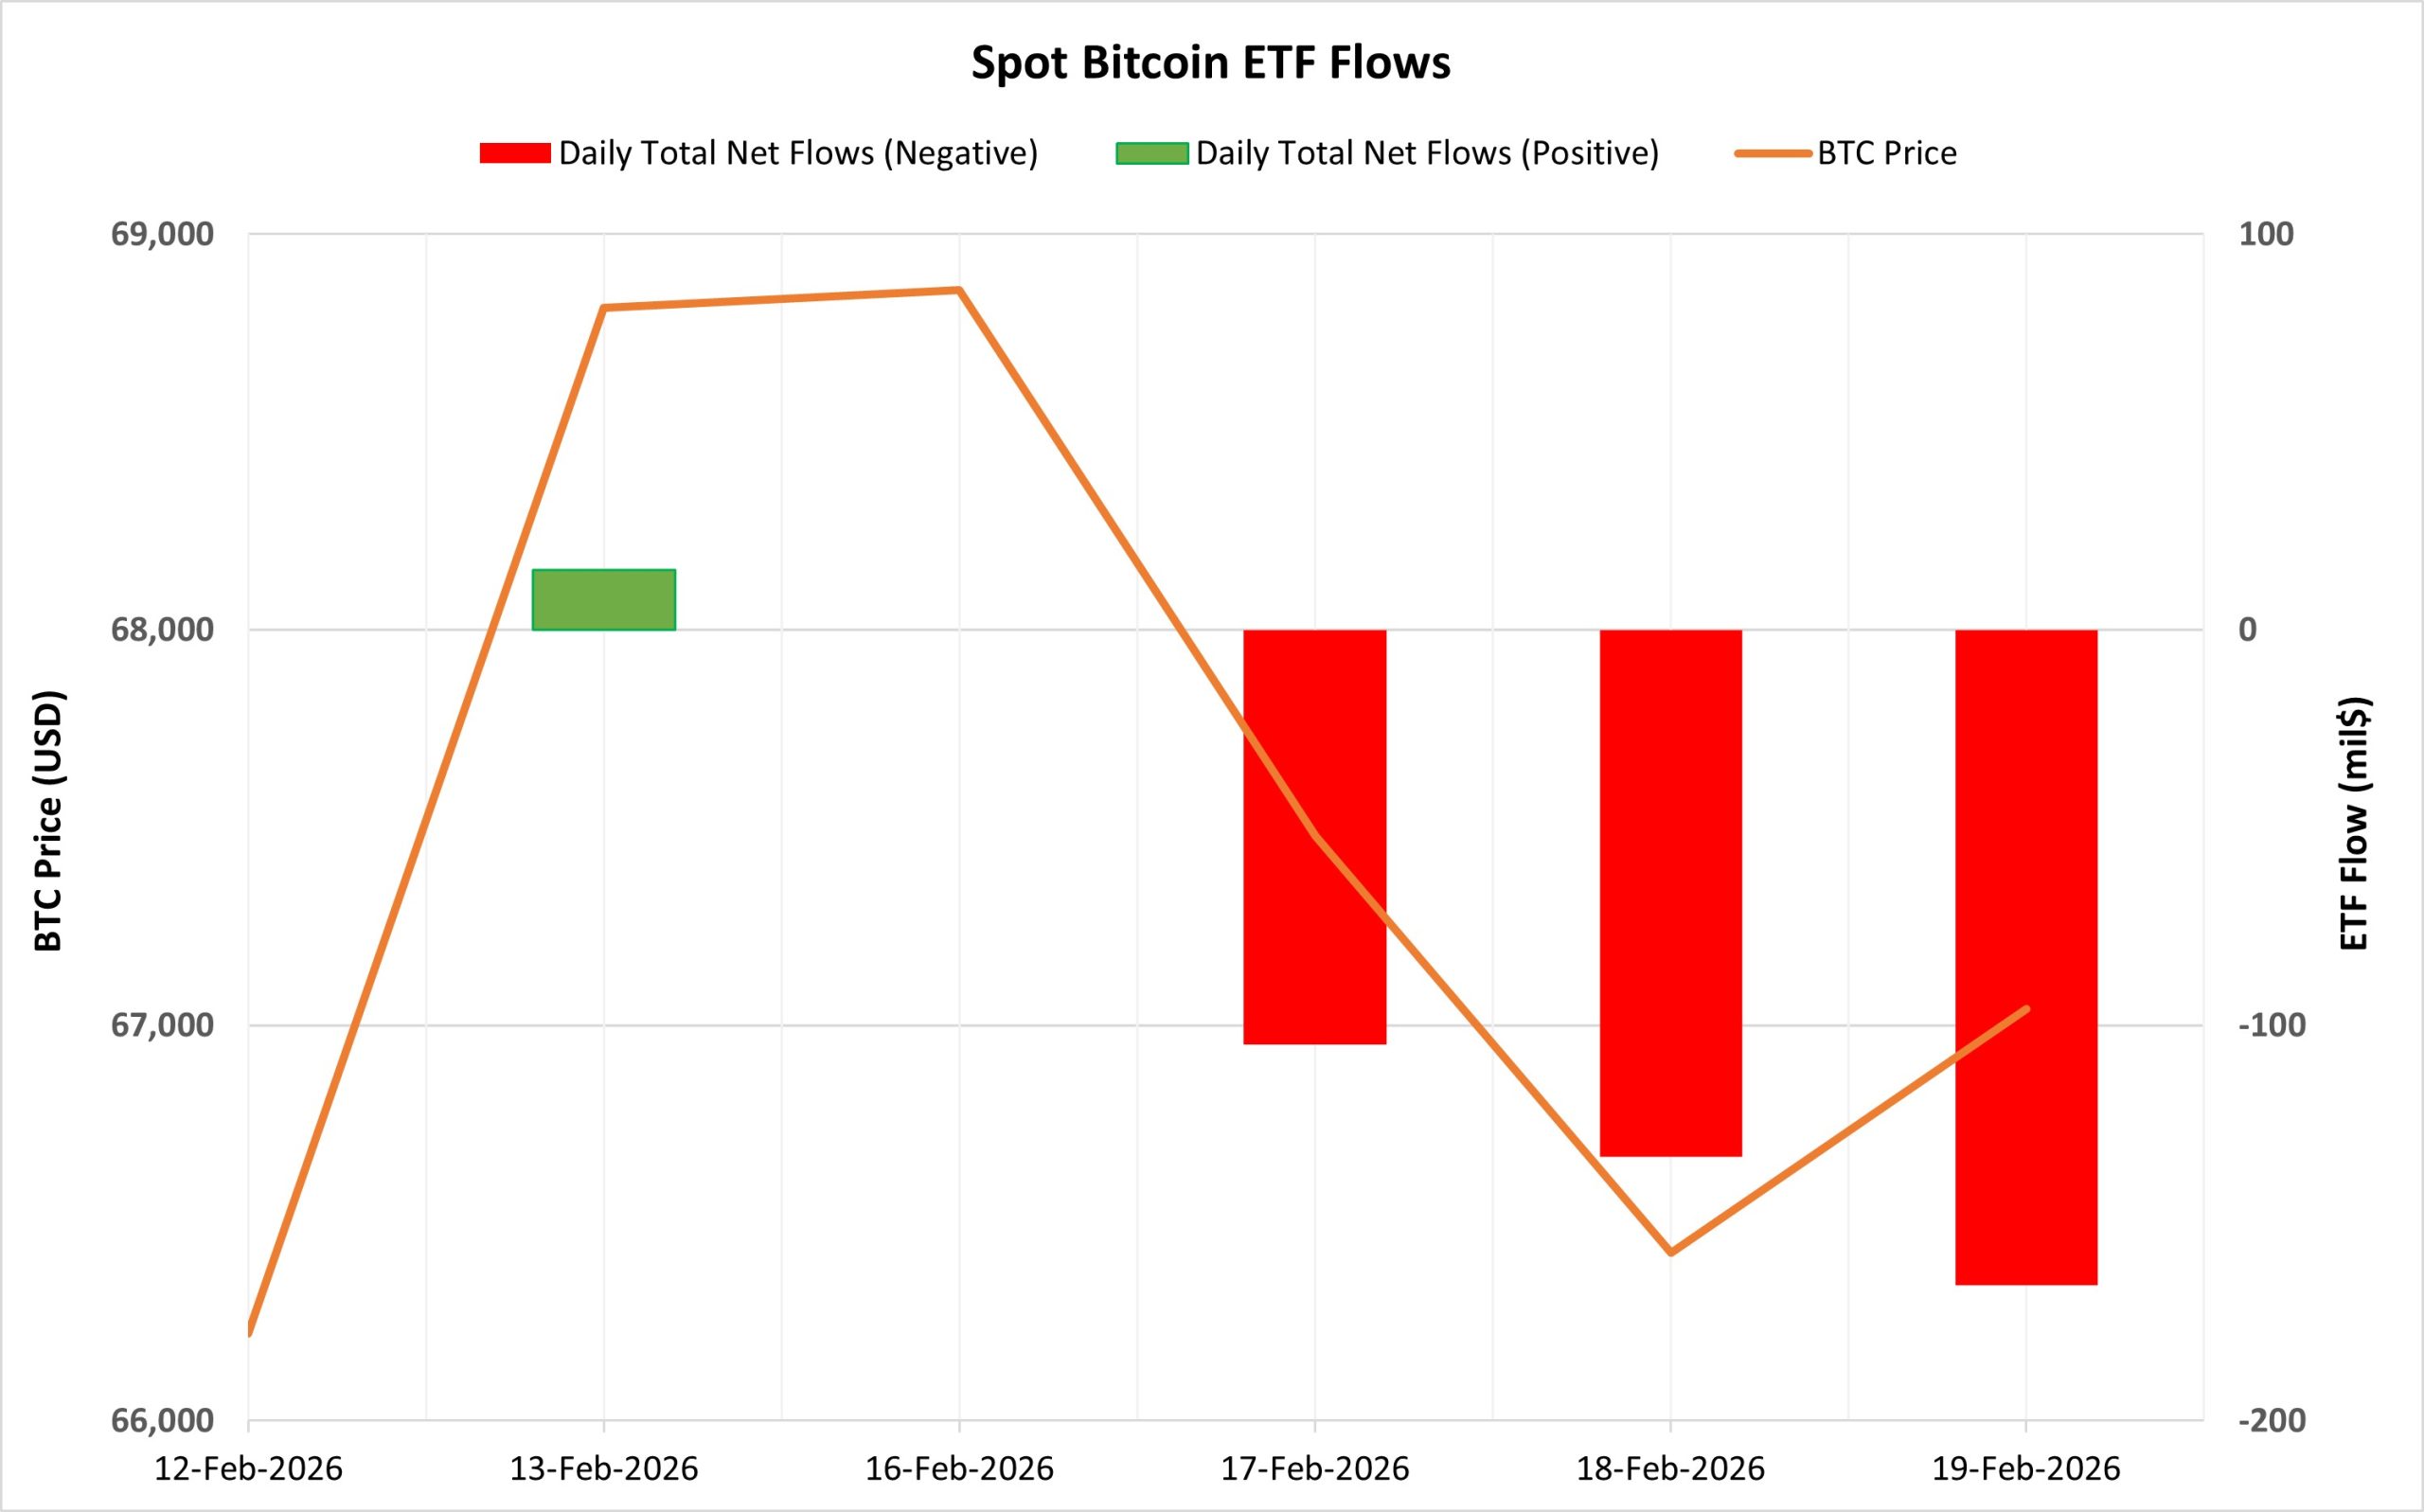
Netflow Status: Between February 13-19, 2026, there was a total net outflow of $388.9 million from Spot Bitcoin ETFs. Consecutive negative flows over the last three trading days turned the overall total negative. The accelerating outflows indicated that risk reduction tendencies were regaining strength on the institutional side. The highest net outflow by fund was $377.4 million from BlackRock IBIT.
Bitcoin Price: Bitcoin opened at $66,220 on February 13 and closed at $67,042 on February 19. During this period, the BTC price rose by 1.24%. Despite the price increase, the fact that ETF flows remained negative indicated that the upward movement occurred without institutional support.
Cumulative Net Inflow: At the end of the 526th trading day, the cumulative total net inflow into Spot Bitcoin ETFs fell to $53.907 billion.
| Date | Coin | Open | Close | Change % | ETF Flow (mil$) |
|---|---|---|---|---|---|
| February 13, 2026 | BTC | 66,220 | 68,814 | 3.92% | 15.1 |
| February 16, 2026 | BTC | 68,793 | 68,859 | 0.10% | 0 |
| February 17, 2026 | BTC | 68,859 | 67,477 | -2.01% | -104.9 |
| February 18, 2026 | BTC | 67,477 | 66,424 | -1.56% | -133.3 |
| February 19, 2026 | BTC | 66,424 | 67,042 | 0.93% | -165.8 |
| Total for February 13–19, 2026 | 1.24% | -388.90 | |||
During this period, institutional demand for Spot Bitcoin ETFs weakened. The recovery seen in the Bitcoin price was not supported by ETF flows. The accelerated outflows over the last three trading days indicated a decline in short-term risk appetite and investors shifting towards cautious positioning. Should stable inflows resume on the ETF side, the BTC price could settle on a more balanced footing. However, if the negative flow trend persists, downward pressure and increased volatility may continue.
Ethereum spot ETF
Source: Darkex Research Department
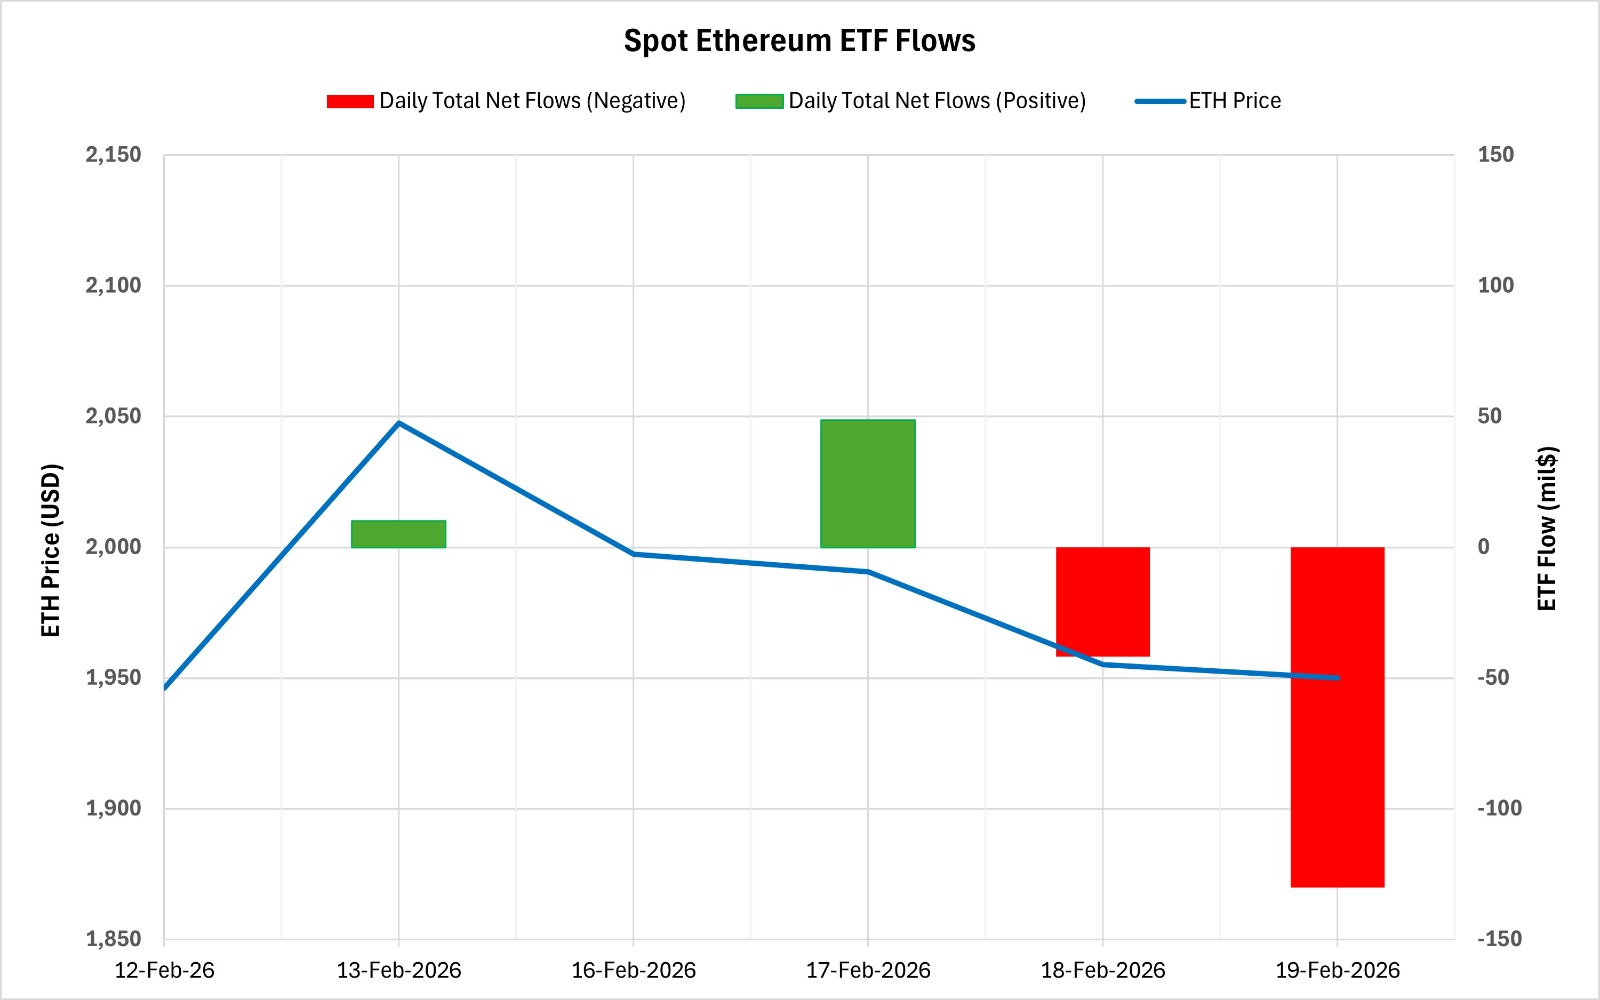
Between February 13-19, 2026, Spot Ethereum ETFs saw a total net outflow of $113.1 million. While net inflows were seen in the first two trading days, accelerated outflows in the last two trading days turned the overall picture negative. Approximately $172 million in net outflows were recorded in the last two trading days. Looking at the funds, most of the outflows came from BlackRock ETHA. At the end of the 396th trading day, the cumulative total net inflow of Spot Ethereum ETFs fell to $11.55 billion.
| Date | Coin | Open | Close | Change % | ETF Flow (mil$) |
|---|---|---|---|---|---|
| February 13, 2026 | ETH | 1,946 | 2,048 | 5.20% | 10.2 |
| February 16, 2026 | ETH | 1,965 | 1,997 | 1.62% | 0 |
| February 17, 2026 | ETH | 1,997 | 1,991 | -0.33% | 48.6 |
| February 18, 2026 | ETH | 1,991 | 1,955 | -1.79% | -41.8 |
| February 19, 2026 | ETH | 1,955 | 1,950 | -0.26% | -130.1 |
| Total for February 13–19, 2026 | 0.20% | -113.1 | |||
Ethereum opened at $1,946 on February 13 and closed at $1,950 on February 19. During this period, the price rose by 0.20%. Despite a strong 5.20% increase on the first day, pullbacks in the following days weakened the upward momentum. On the ETF side, accelerated outflows on the last two trading days increased pressure on the price. Overall, caution strengthened among institutional investors during this period. Net outflows were prominent on the ETF side. If stable inflows resume on the ETF side in the coming days, a healthier recovery in the ETH price may be seen. However, if the current negative flow trend continues, downward pressure and volatility may persist.
Bitcoin Options Distribution
Source: Laevitas
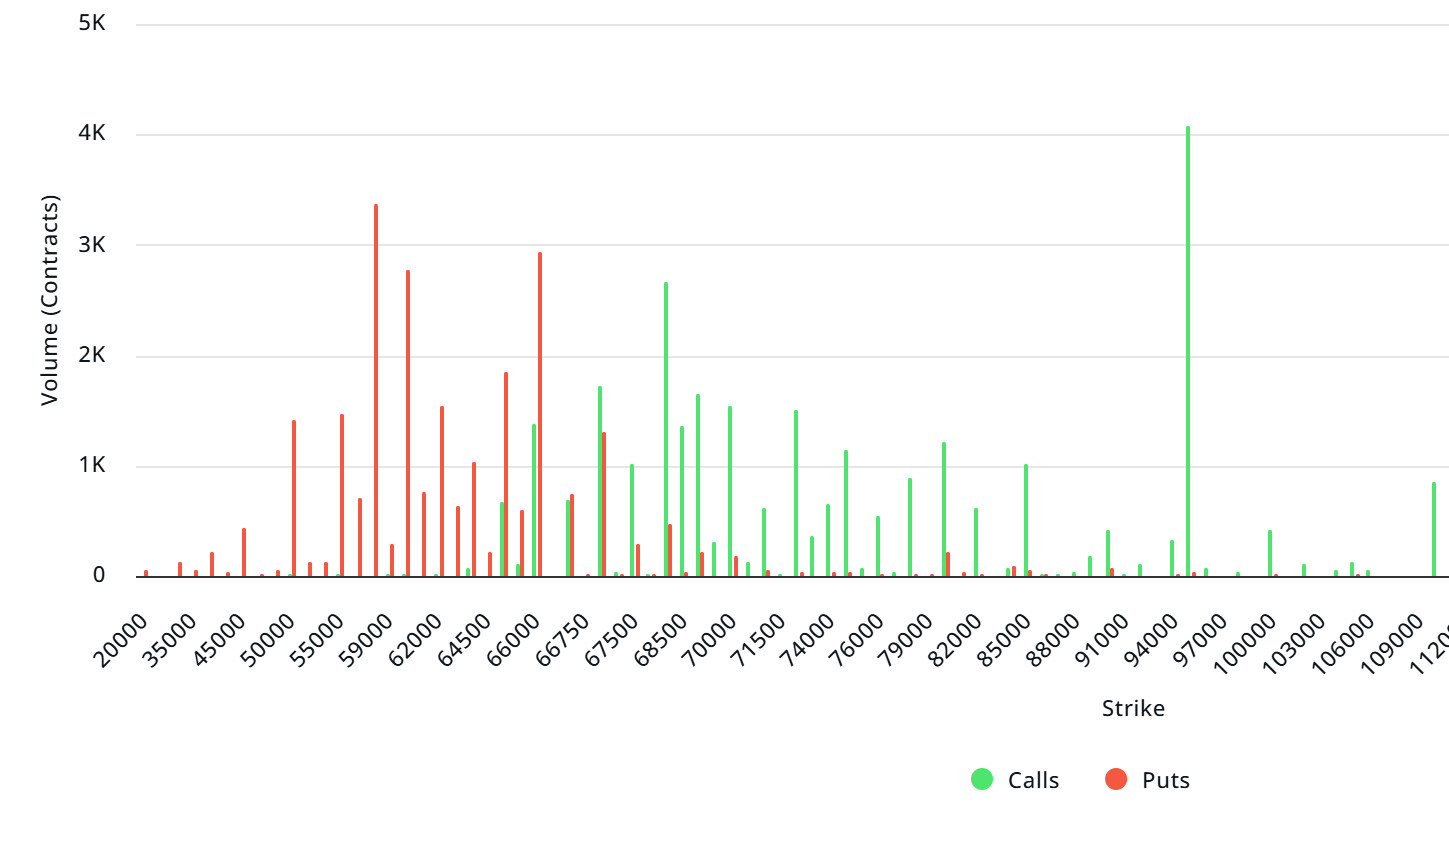
BTC: Notional: $2B | Put/Call: 0.59 | Max Pain: $70K
Deribit Data: Deribit data shows that BTC option contracts with a notional value of approximately $2 billion expire today. At the same time, looking at the risk transformation over the next week based on the last 24 hours’ data, put options are dominating over call options in terms of risk hedging. However, call options have started to increase. When examining expected volatility (IV), it is trading above realized volatility (RV). On the other hand, the positive trend in the spread metric indicates increased risk appetite in the market, suggesting that call options are expensive.
Laevitas Data: Examining the chart, we see that put options are concentrated in a band between $50,000 and $66,000. Call options, on the other hand, are spread across a broad base between the $68,000 and $95,000 levels. At the same time, the $68,000 level appears to be resistance, while the $66,000 level appears to be support. On the other hand, there are 3.38k put options at the $58,000 level, where they peak, and a decrease in put volume is observed after this level. Furthermore, 4.37K call option contracts peak at the $95,000 level. Looking at the options market, we see that call contracts dominate on a daily and weekly basis.
Option Maturity:
Put/Call Ratio and Maximum Pain Point: Looking at the options in the latest 7-day data from Laevitas, the number of call options decreased by approximately 34% compared to last week, reaching 97.47K. In contrast, the number of put options decreased by 52% compared to last week, reaching 72.23K. The put/call ratio for options is set at 0.59. This indicates that there is more demand for call options than put options among investors. Bitcoin’s maximum pain point is seen at $70,000. BTC is currently priced at $67,900 on , and if it fails to break above the pain point of $70,000, further declines can be anticipated.
Ethereum Options Distribution
Source: Laevitas
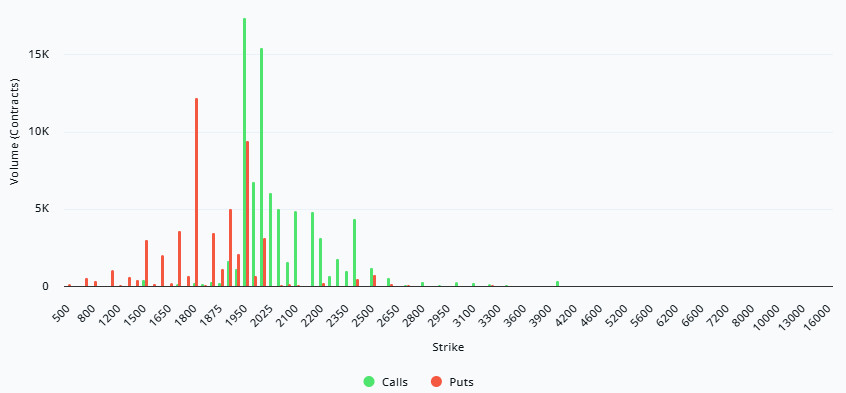
ETH: $0.404 B notional | Put/Call: 0.75 | Max Pain: $2,050
Laevitas Data: Looking at the data in the chart, we see that put options are concentrated in a fairly wide band, particularly between the $1,800 and $1,950 price levels. The highest put volume is at the $1,800 level, with approximately 12K contracts. On the other hand, in call options, there is a noticeable concentration at the $1,950 to $2,100 levels. The highest call volume is at the $1,950 level and appears to be close to the number of put contracts, at approximately 18K.
Deribit Data: On the last trading day of the week, we see that the 24-hour volume increased by 19.45% to $58.7 million, while open interest rose to $418 million. This indicates that risk appetite is still alive. Call volume increased by 73%, while put volume declined. Flow is concentrated more on upward expectations. The 25 delta risk reversal remaining negative at -7.98 and the weak appearance of the butterfly suggest that we are still in a period where downside risks are stronger. Additionally, the rise in ATM volatility to 62 increases expectations for short-term movement, but this also strengthens the signal that the impact of this expected movement on pricing could be downward.
Option Maturity:
Ethereum options with a nominal value of $0.404 billion expired on February 20. The Max Pain level was calculated at $1,950, while the put/call ratio stood at 0.75.
Legal Notice
The investment information, comments, and recommendations contained in this document do not constitute investment advisory services. Investment advisory services are provided by authorized institutions on a personal basis, taking into account the risk and return preferences of individuals. The comments and recommendations contained in this document are of a general nature. These recommendations may not be suitable for your financial situation and risk and return preferences. Therefore, making an investment decision based solely on the information contained in this document may not result in outcomes that align with your expectations.
