
Active Addresses
Active Receiving Addresses
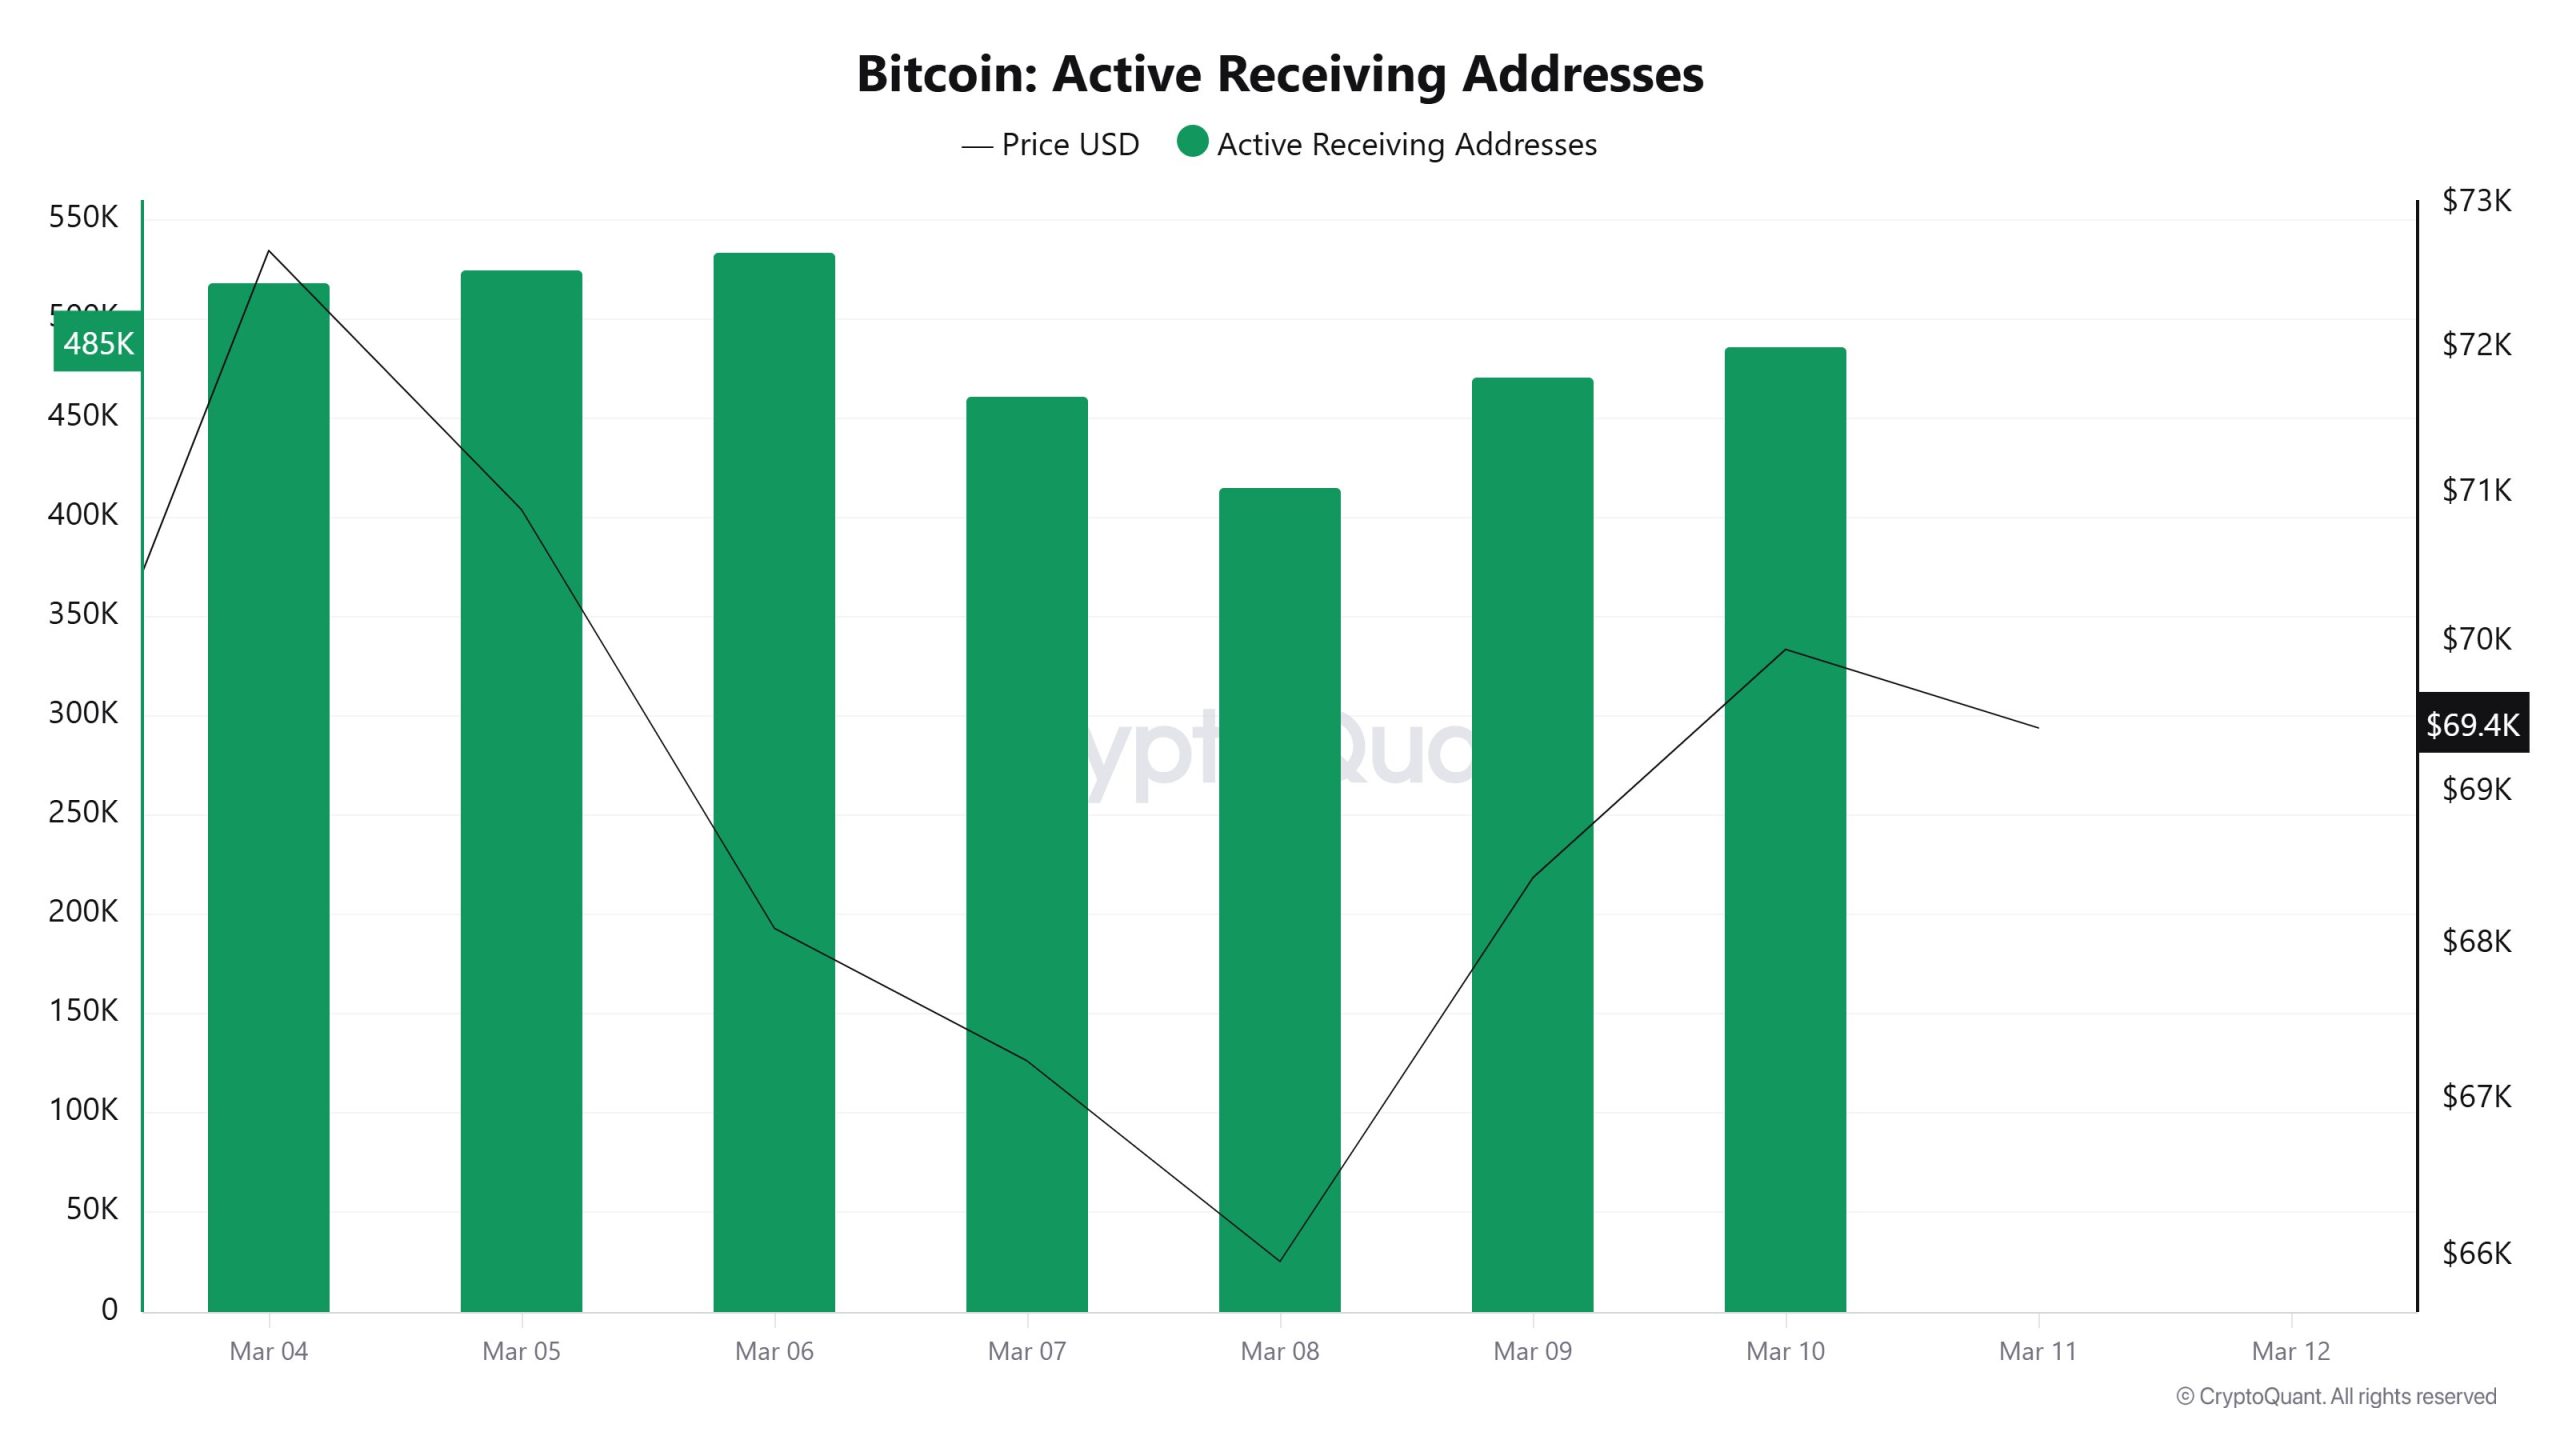
During the period between March 4 and March 10, the number of active receiving addresses on the Bitcoin network followed a relatively stable but slightly fluctuating pattern. The metric started the week at around 510,000 and reached its weekly peak near 530,000 on March 6. After this point, a noticeable decline occurred, and active receiving addresses dropped to around 410,000 on March 8, marking the lowest level of the week. Toward the end of the period, the metric recovered again and climbed back to approximately 480,000. This pattern suggests that although buyer activity weakened briefly during the middle of the week, demand on the network remained relatively stable overall and began to recover toward the end of the period.
Active Sending Addresses
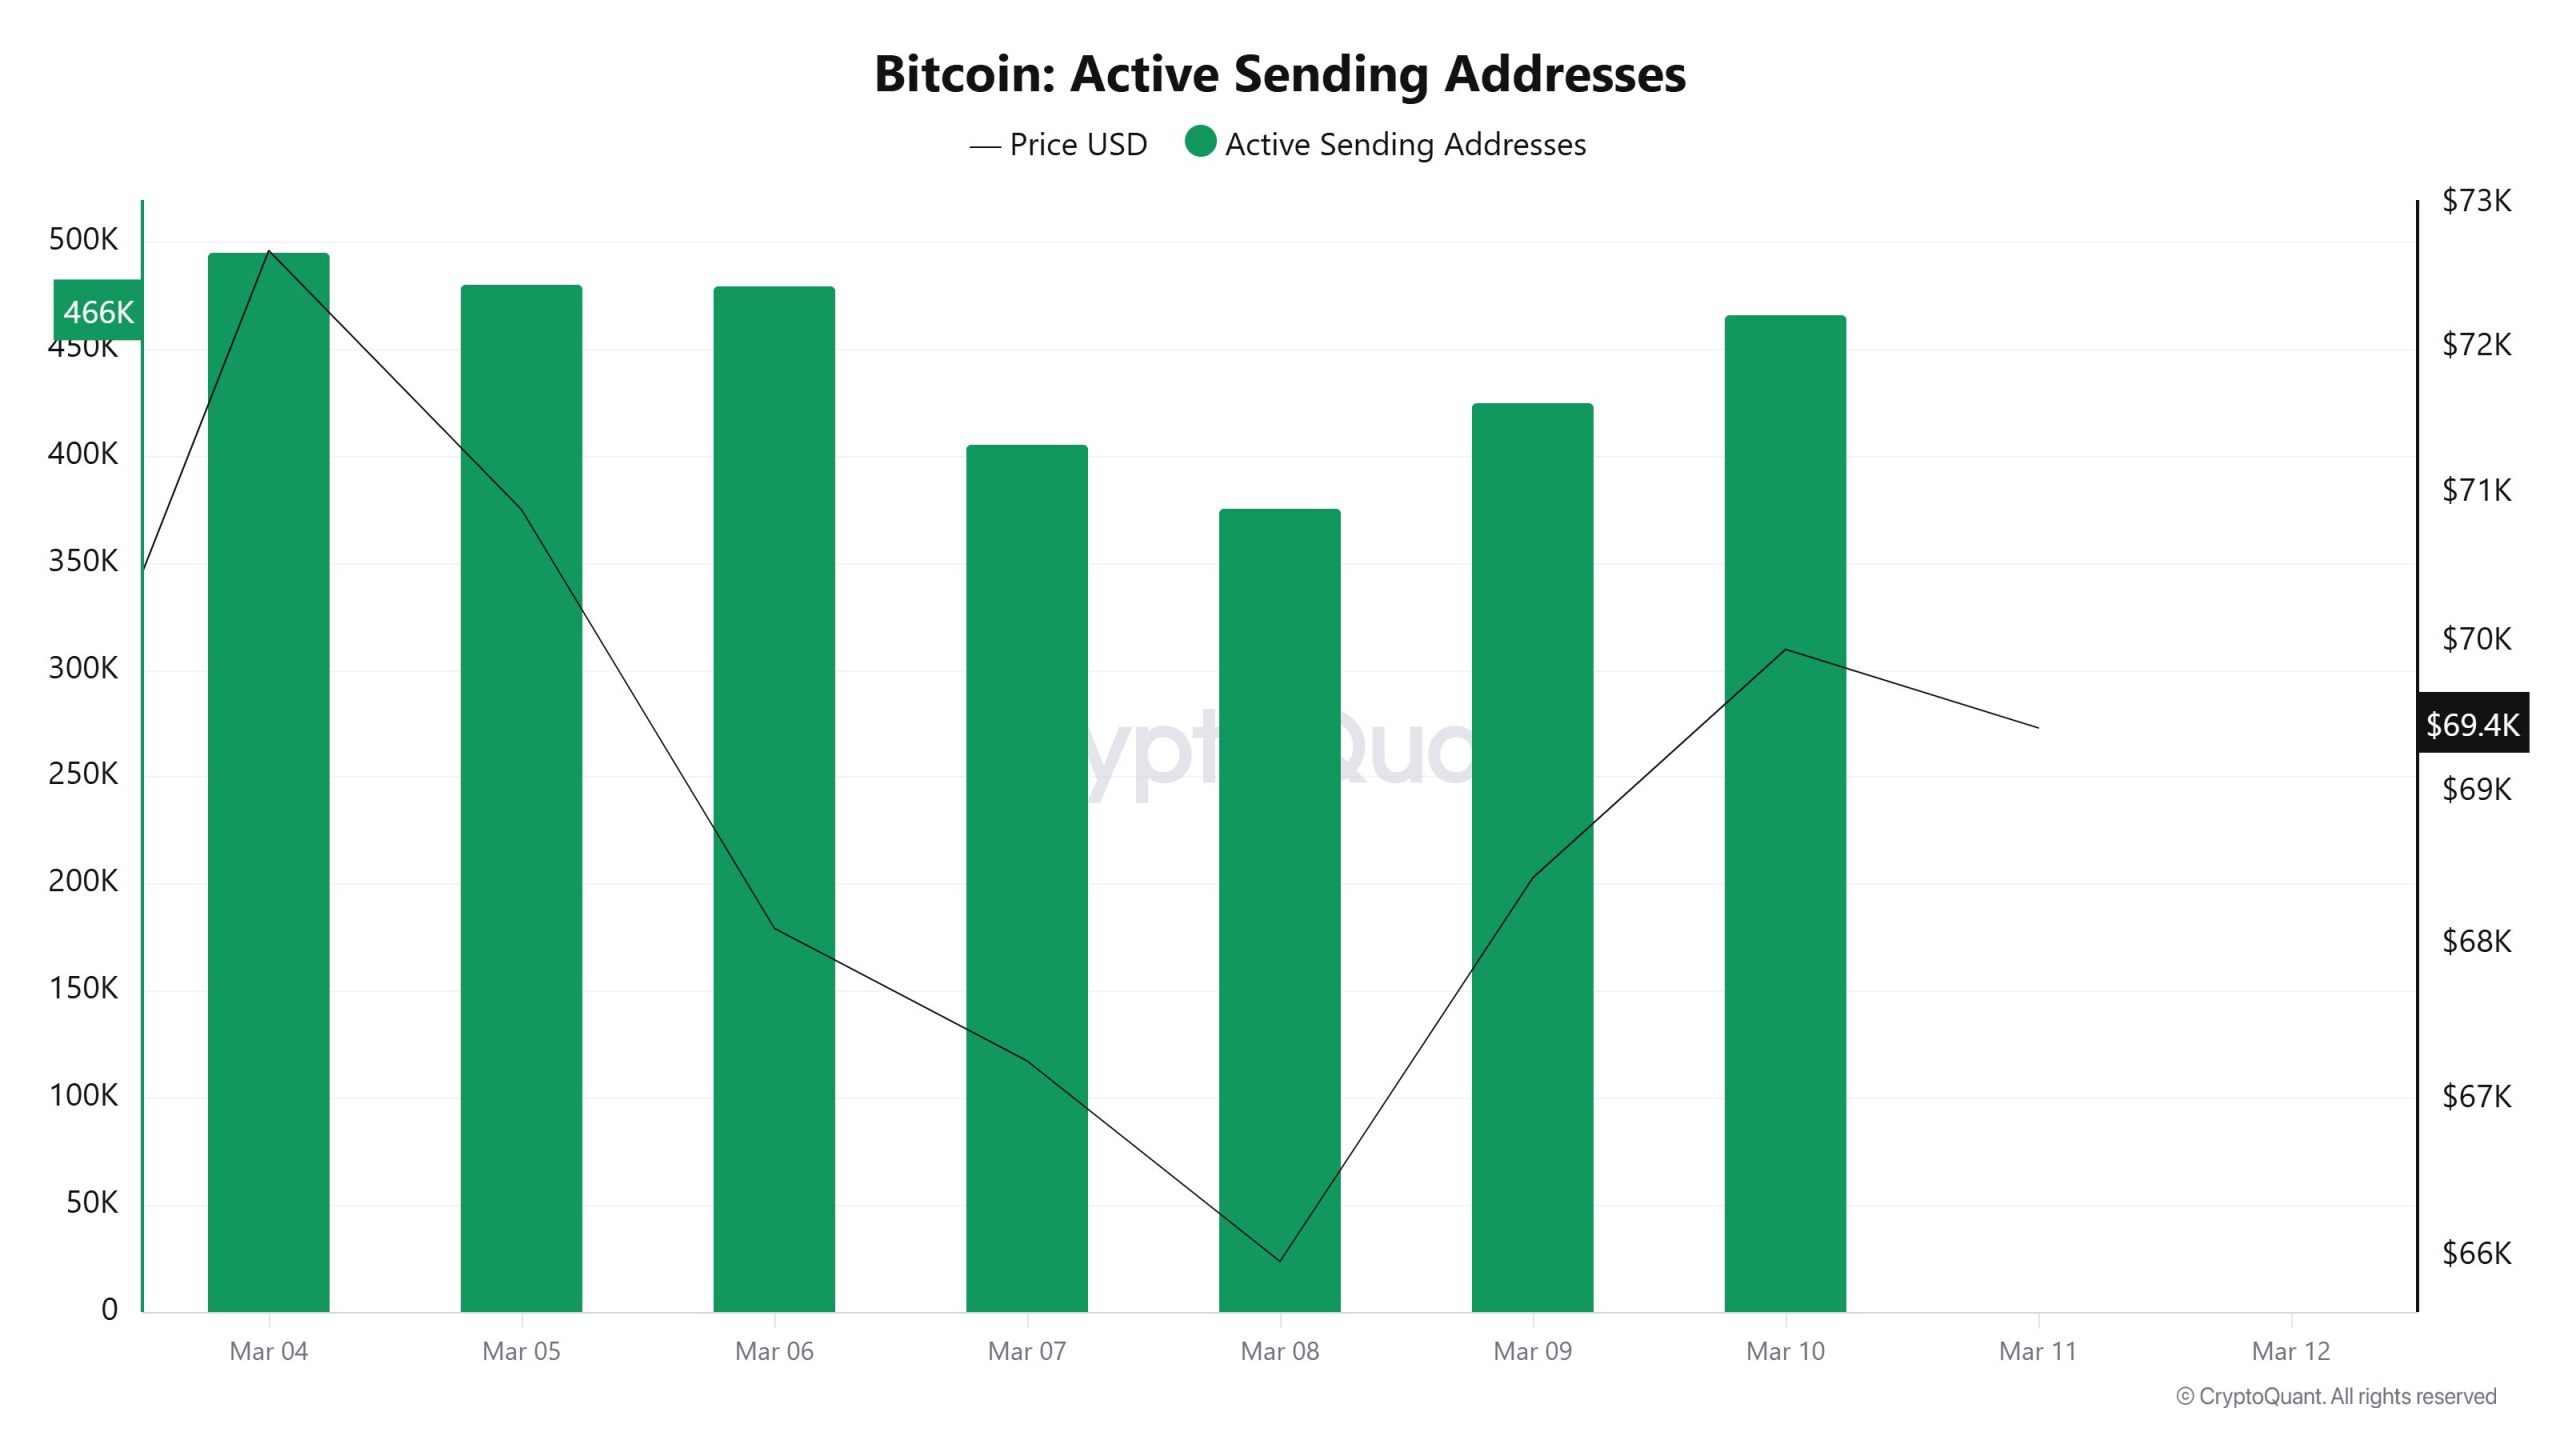
Active sending addresses showed a similar trajectory during the same period but with a clearer downward movement in the middle of the week. The metric started above 490,000 on March 4 and gradually declined to around 370,000 by March 8. This drop coincided with the sharp decline in the Bitcoin price during the same timeframe. However, sending activity began to recover in the second half of the week, rising again to approximately 460,000 by March 10. This rebound indicates that transaction activity on the network began to normalize as the market stabilized.
Breakdowns
MRVR
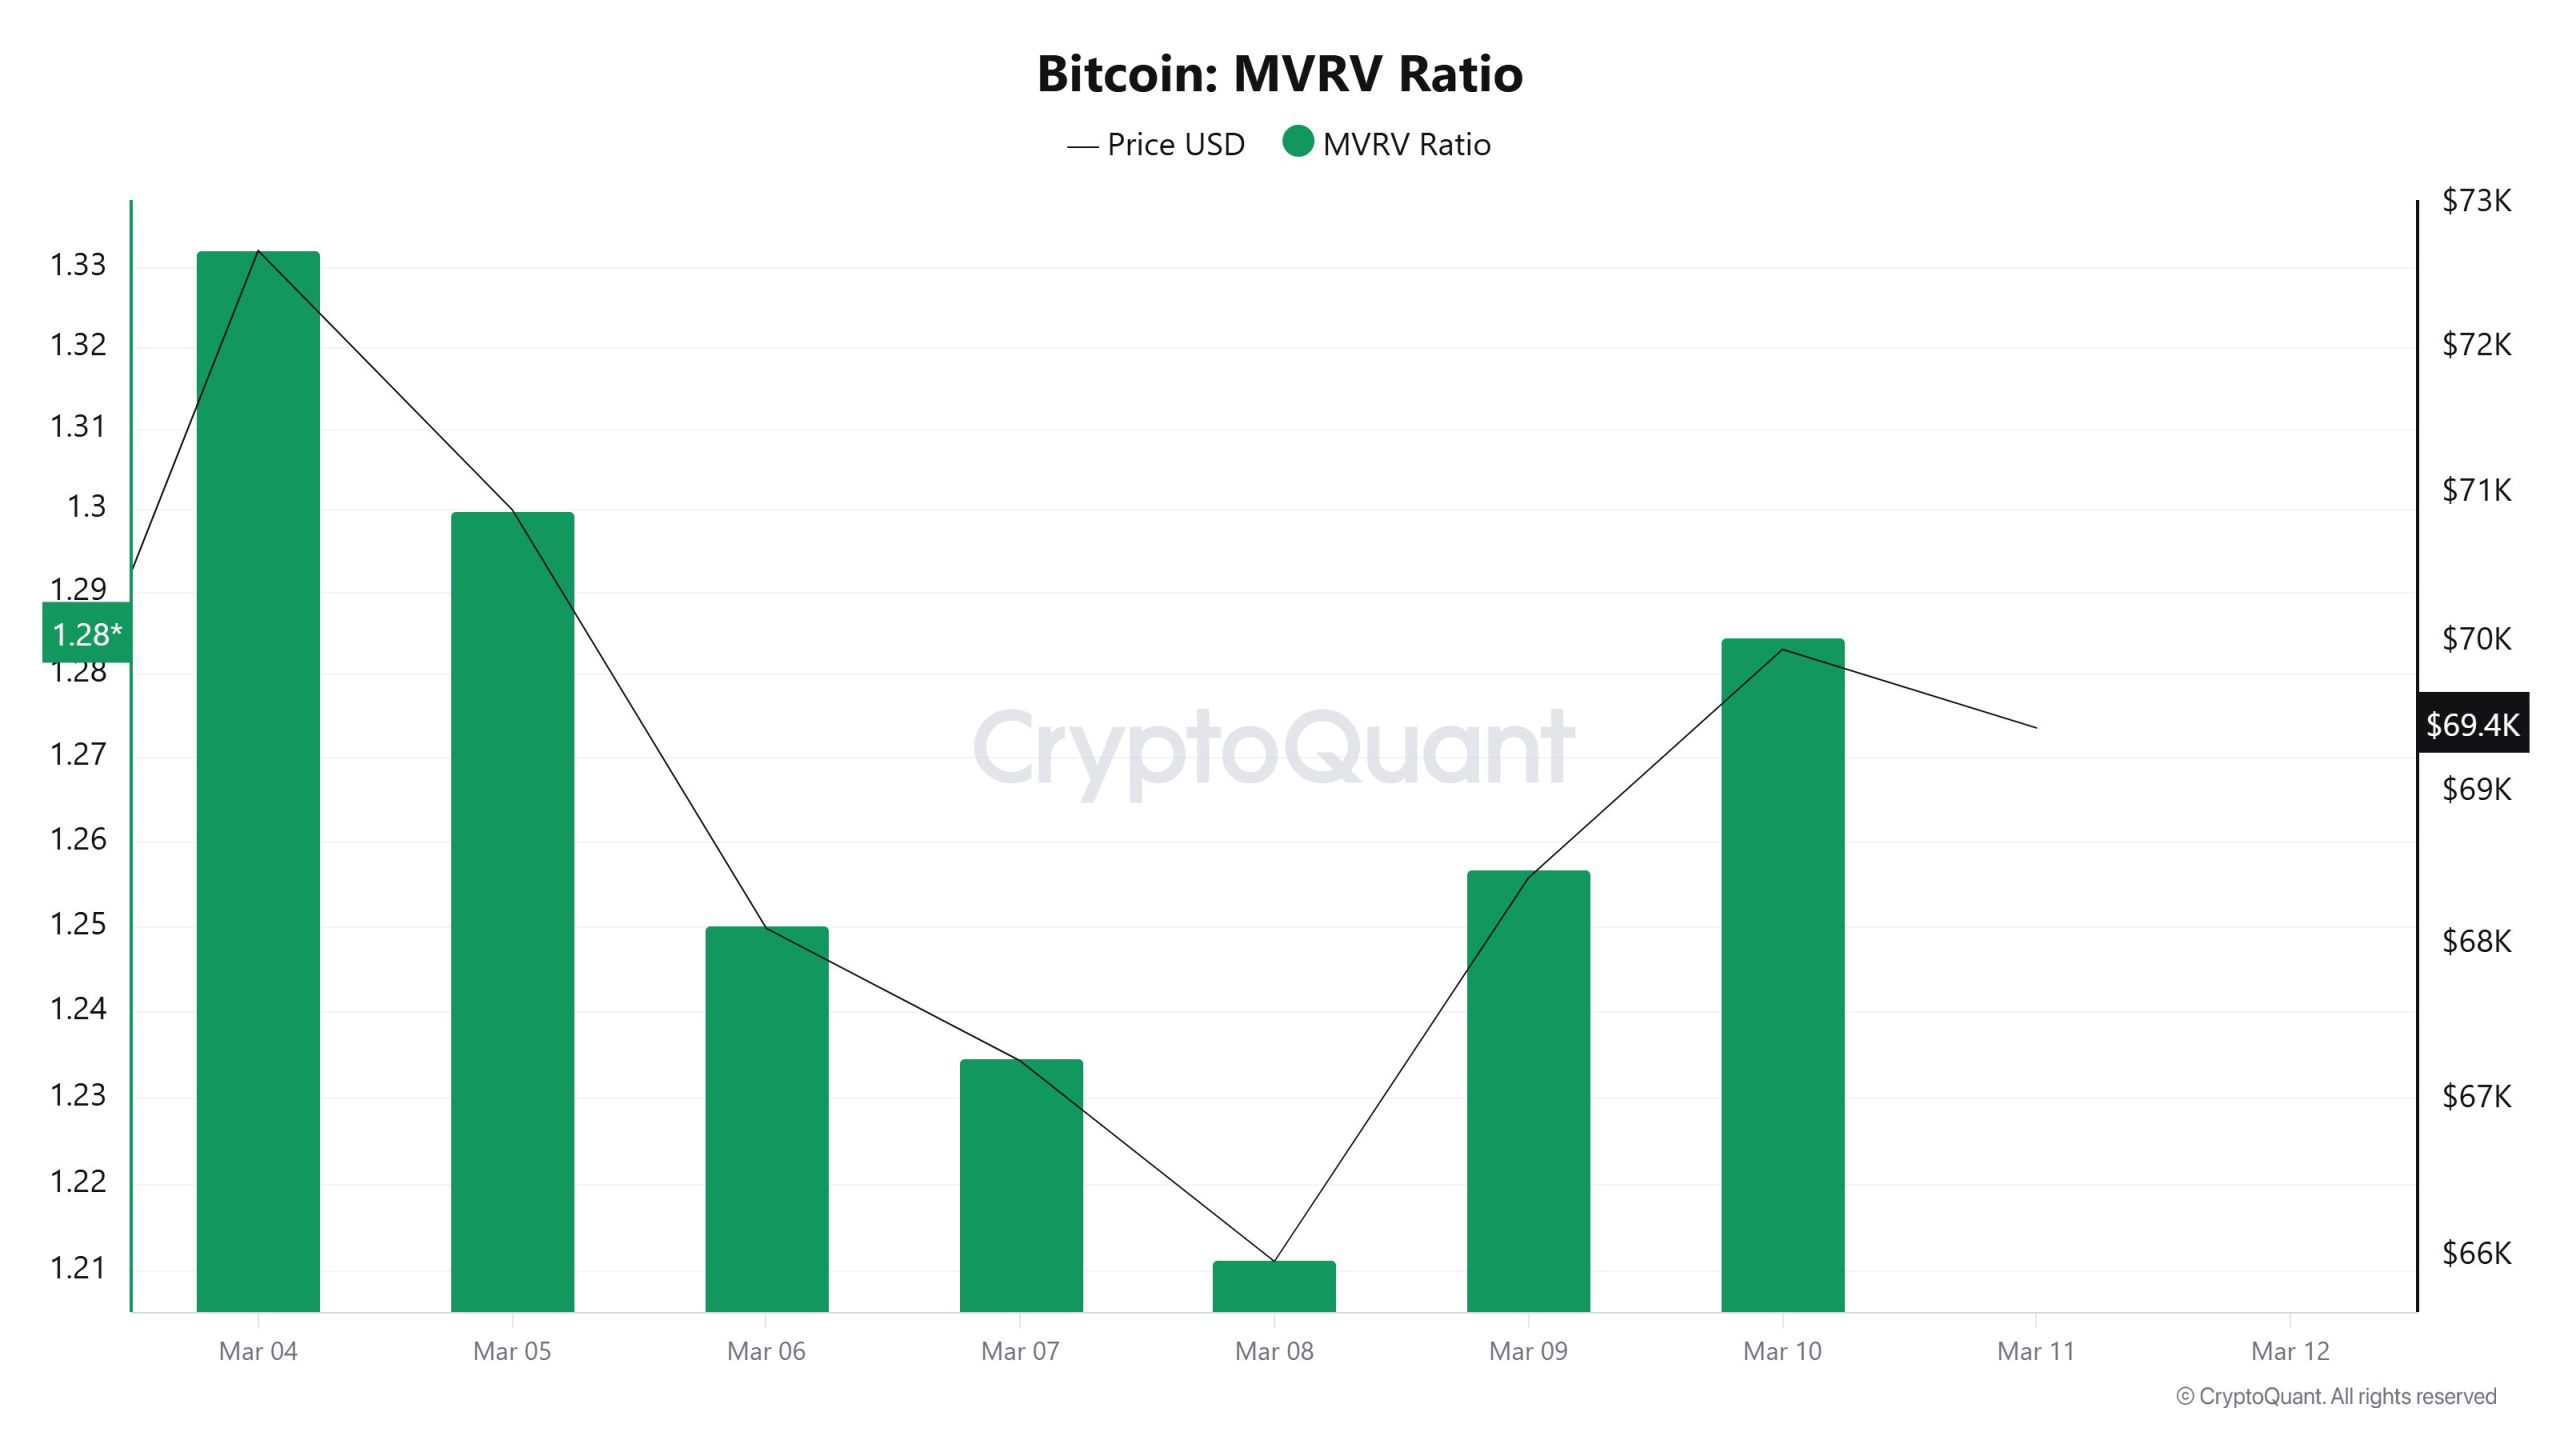
The MVRV Ratio moved downward during the first half of the week before showing a partial recovery. Starting near 1.33 on March 4, the metric steadily declined and reached around 1.21 by March 8, reflecting the impact of the price correction during the same period.
Following the market recovery, the MVRV ratio climbed again and reached approximately 1.28 toward the end of the week. This level suggests that investors remain generally in profit, but the market is still far from entering an overheated or excessive profit zone.
Spent Output Profit Ratio (SOPR)
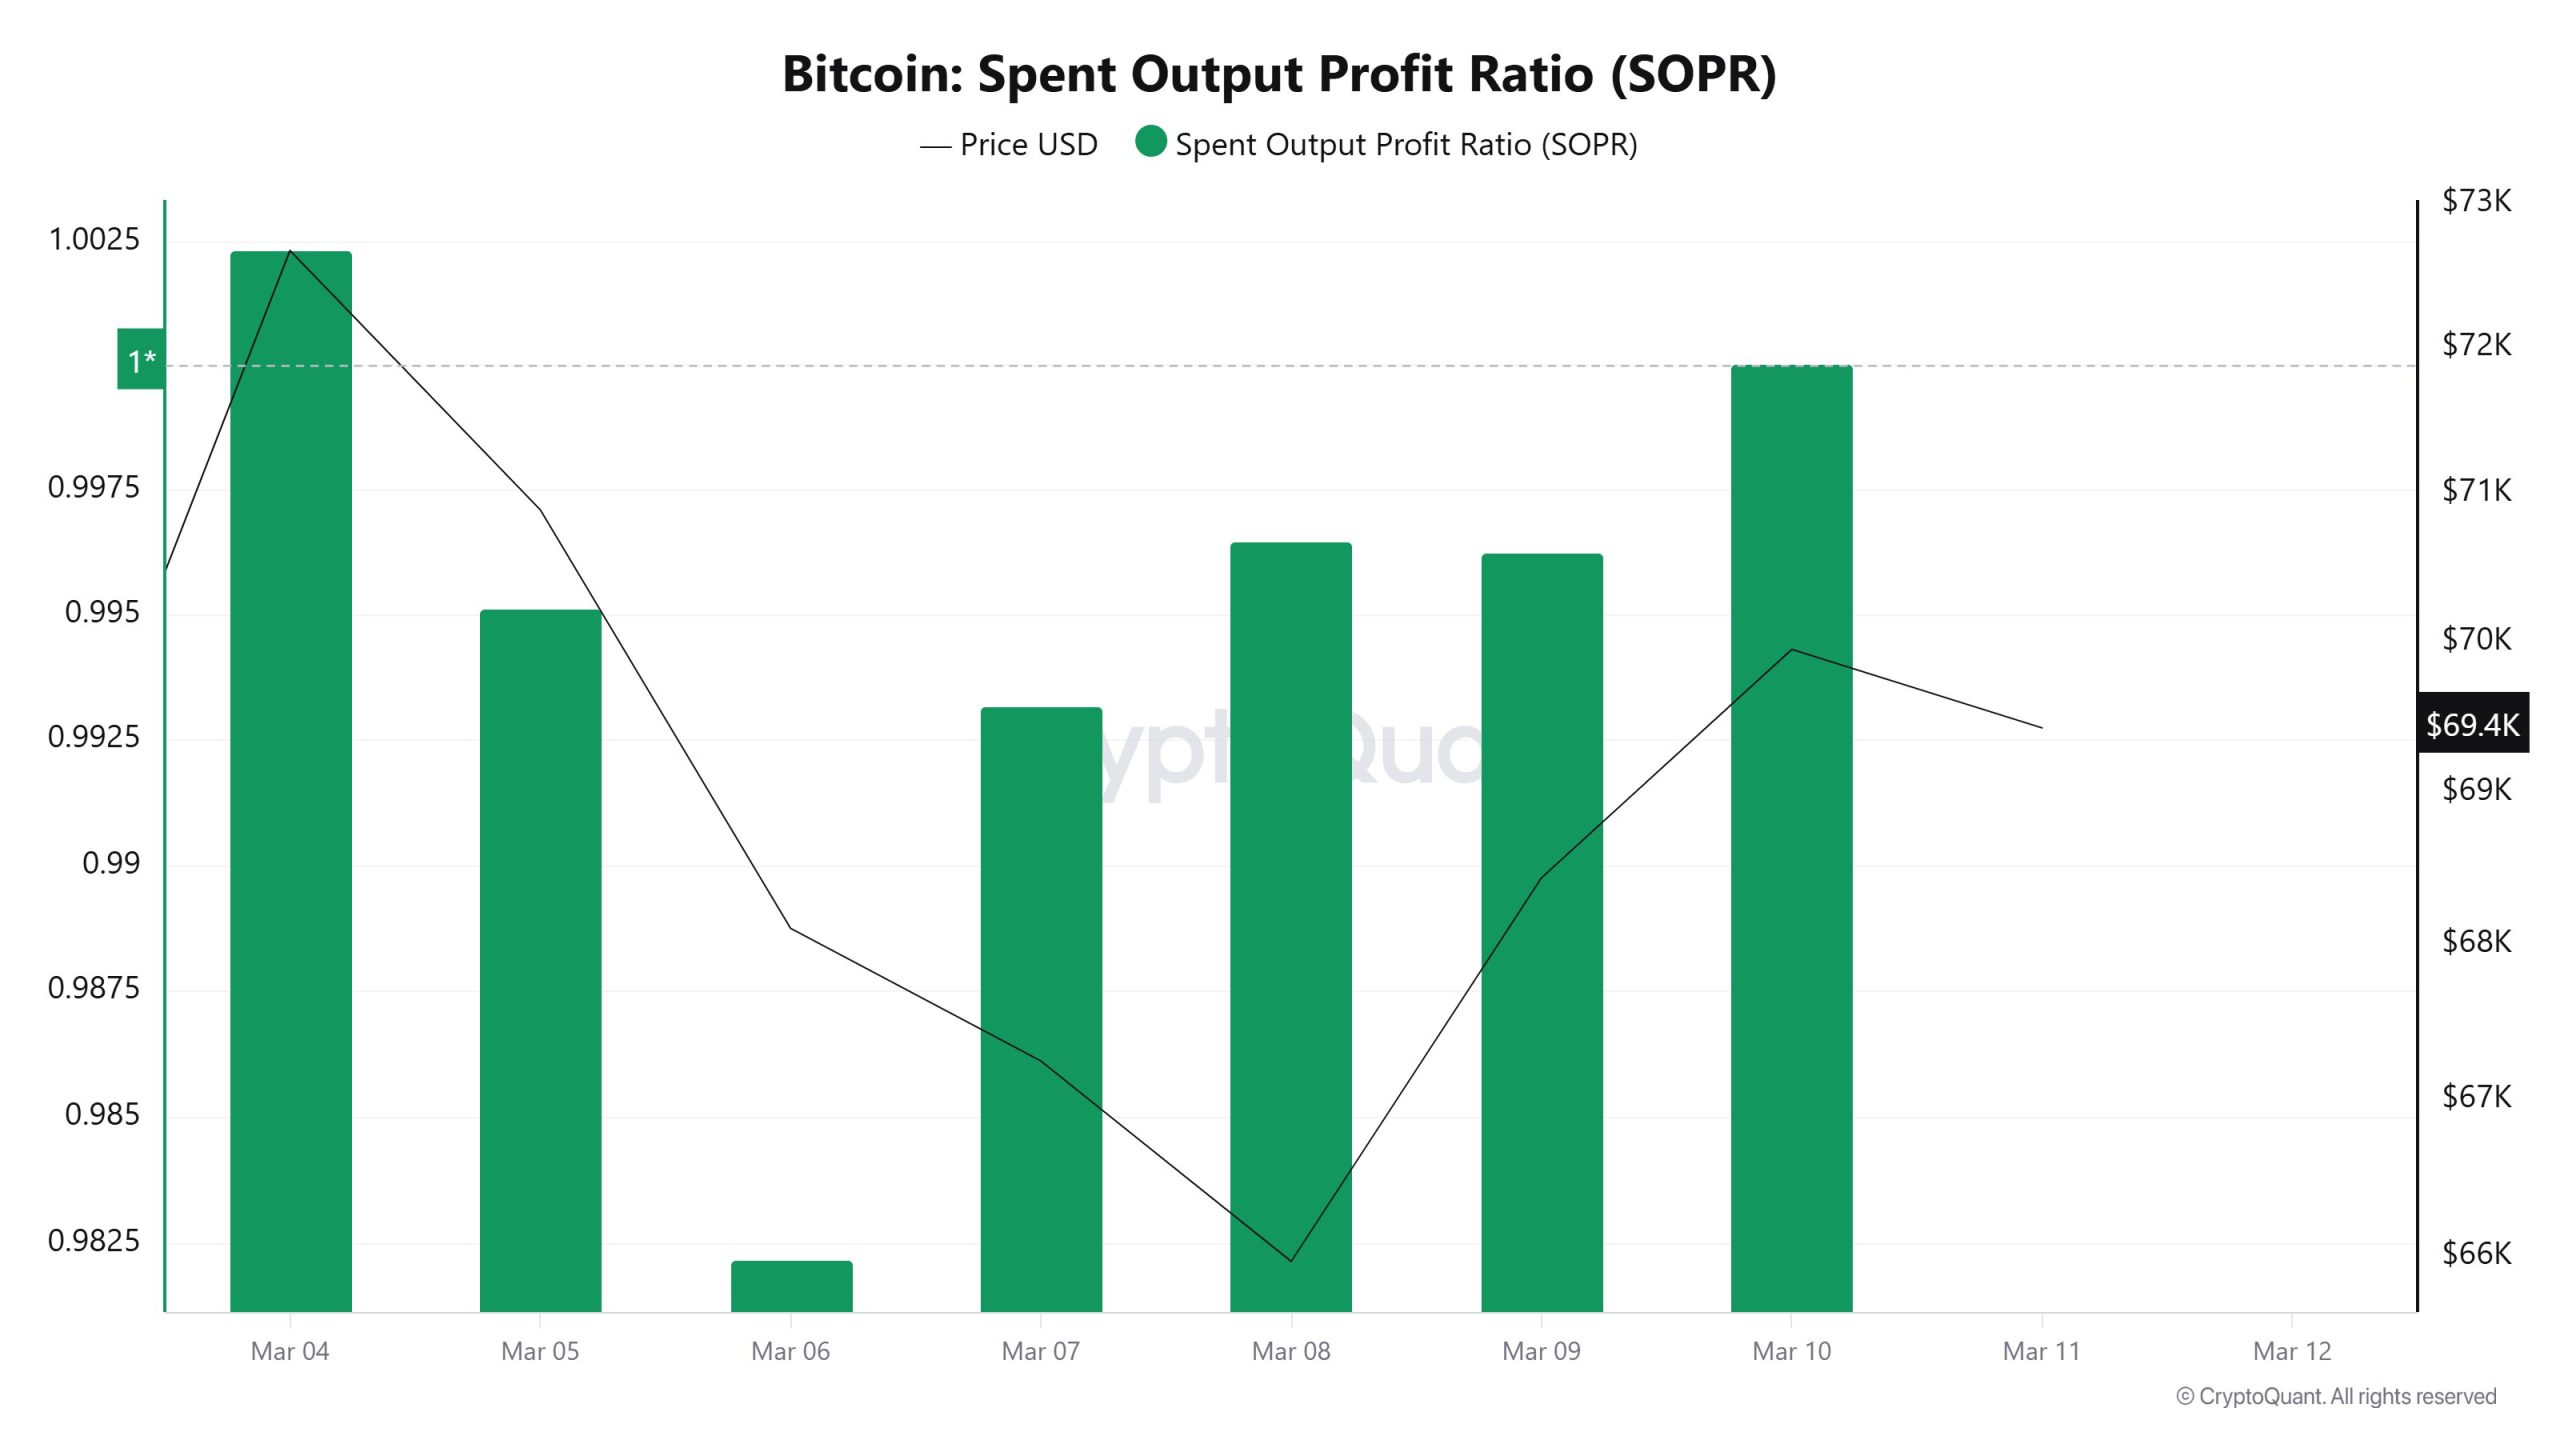
The Spent Output Profit Ratio (SOPR) fluctuated around the critical 1 level throughout the week. The metric briefly moved above 1 on March 4 but then dropped sharply to around 0.982 on March 6 as the price correction intensified.
In the following days, SOPR gradually recovered and moved closer to the neutral level again, reaching nearly 1 by March 10. This development indicates that the realized losses seen earlier in the week began to fade and that the market started to stabilize as selling pressure weakened.
Derivatives
Open Interest
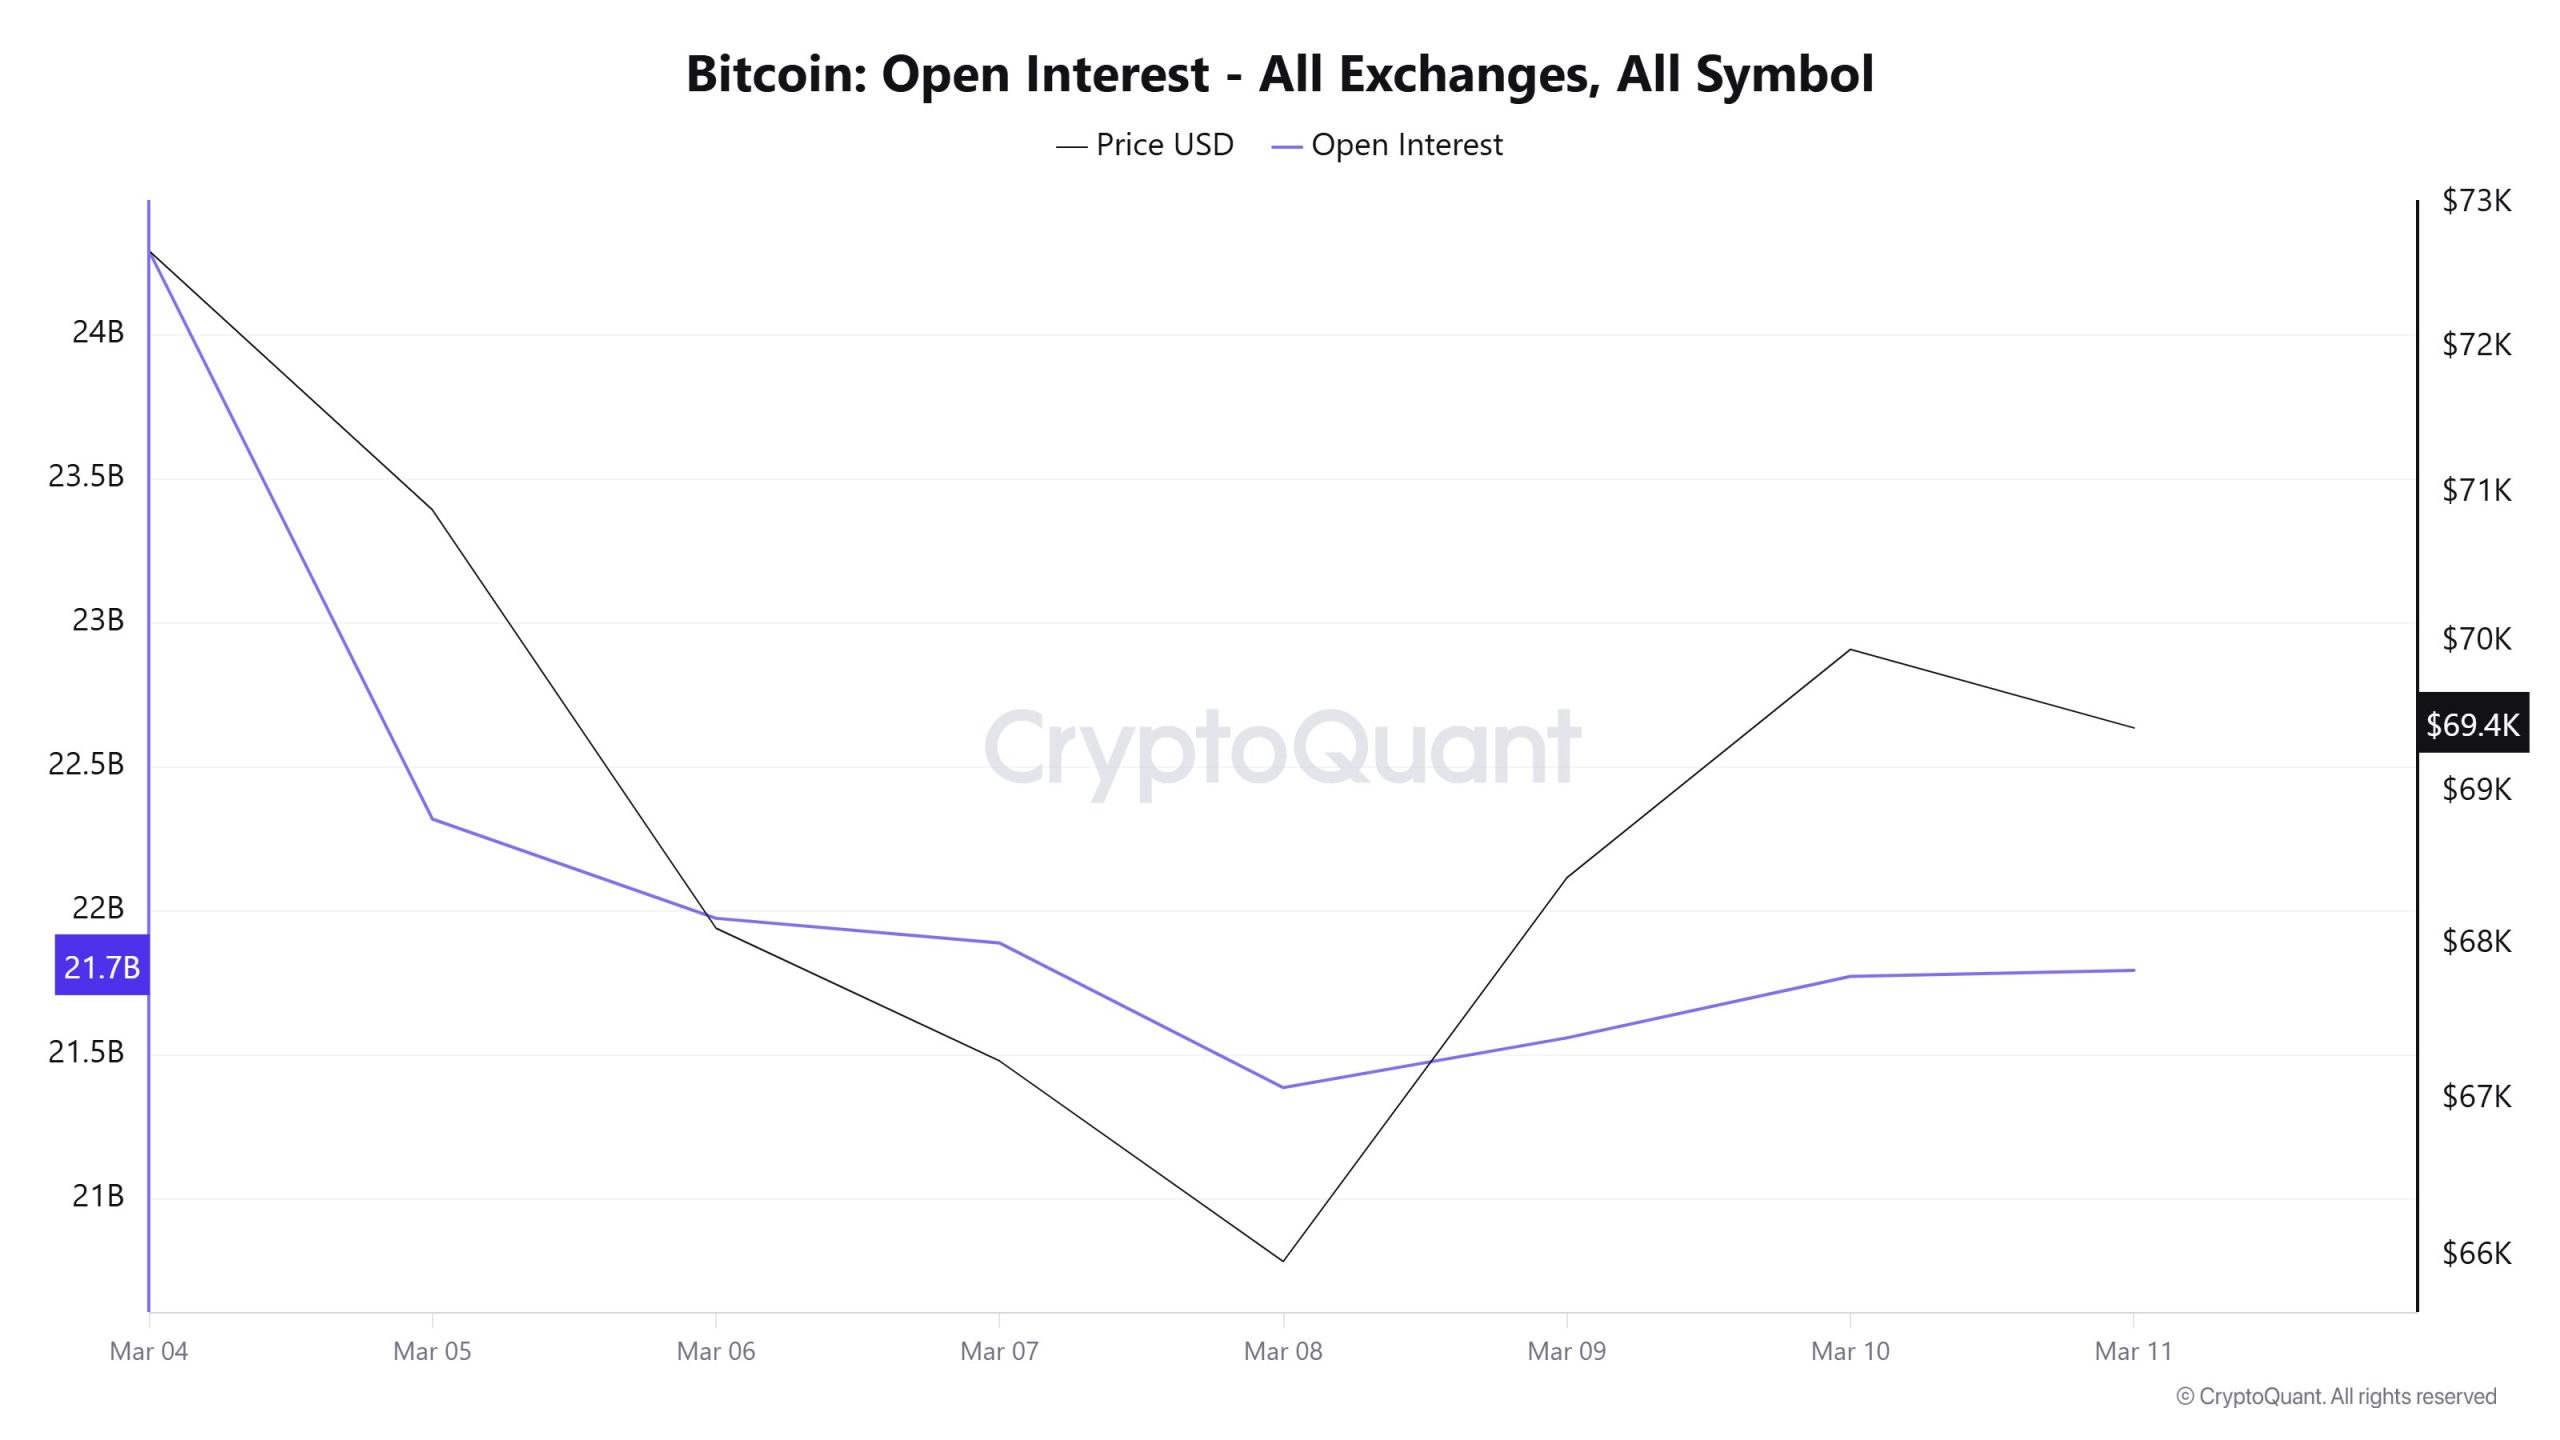
Open Interest data showed a decline during the early part of the week, followed by a moderate recovery. The metric started above $24 billion on March 4 and gradually decreased to around $21.4 billion by March 8 as the market experienced a sharp price correction. After this decline, Open Interest began to increase again and approached $21.8 billion toward the end of the period. This rebound suggests that new positions have started to enter the derivatives market again as prices stabilized.
Funding Rate
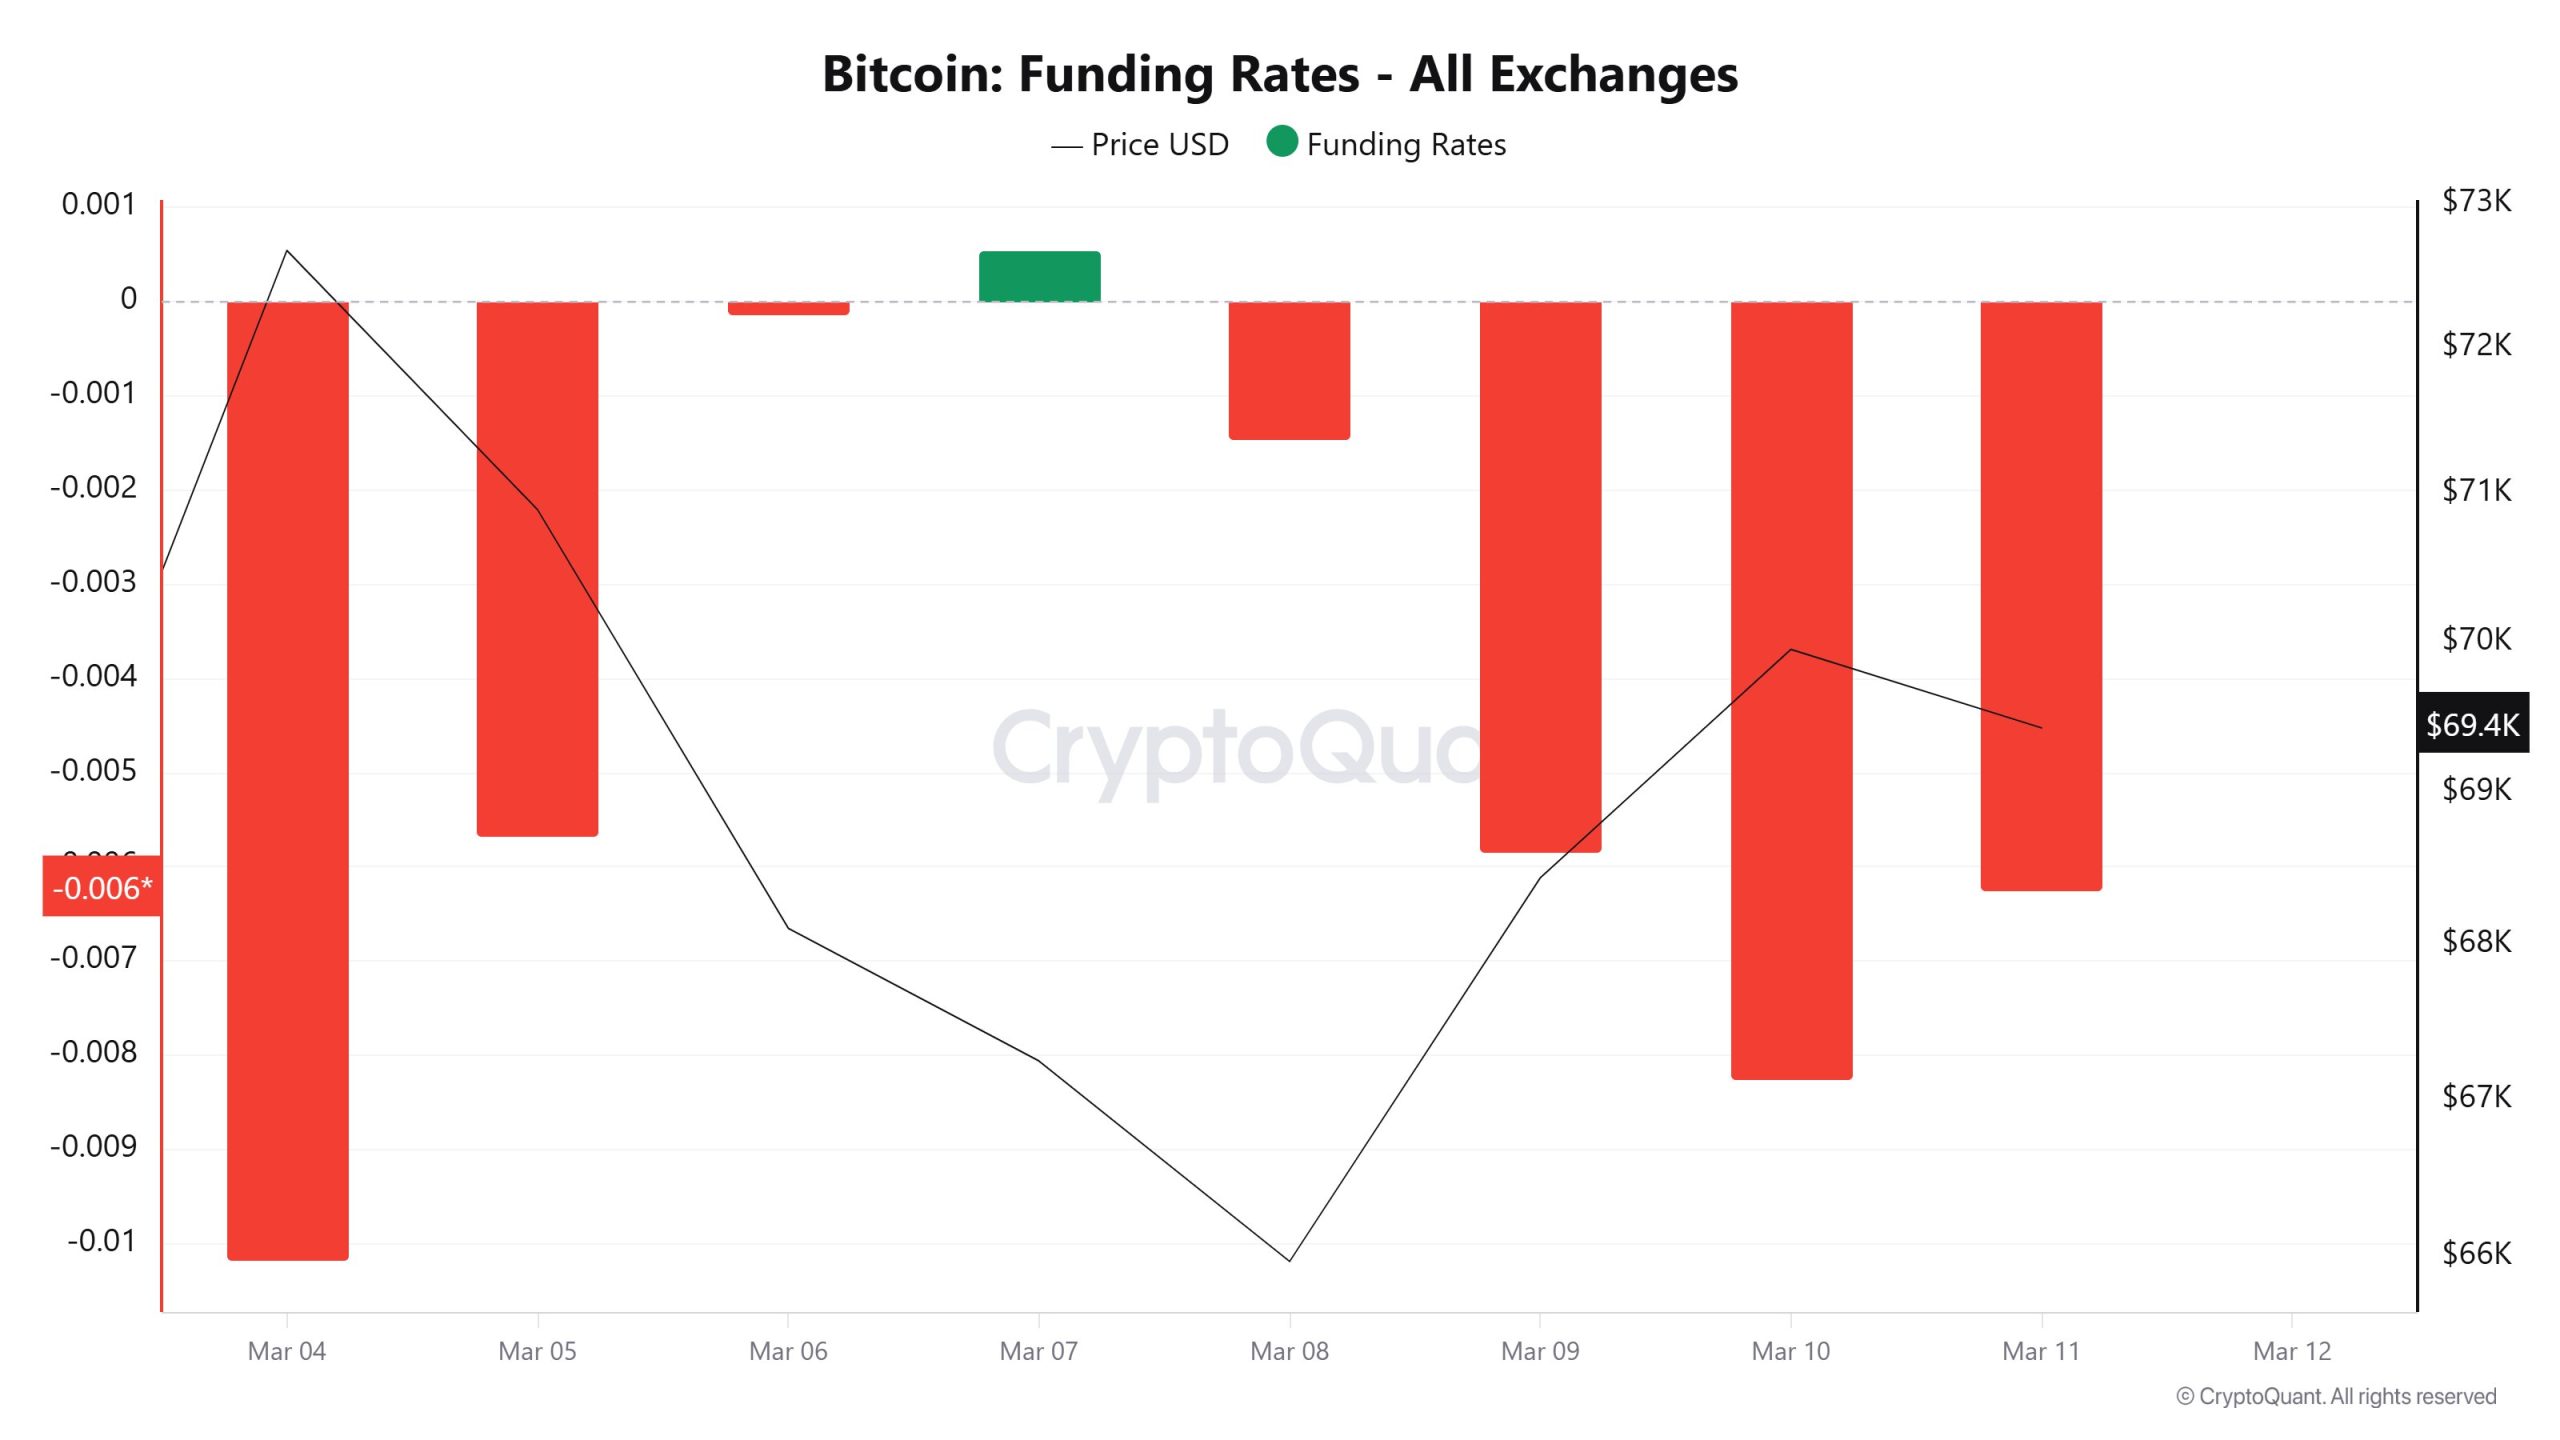
Funding rate data remained largely in negative territory throughout the week. The metric fell as low as around -0.010 on March 8, reflecting the strong dominance of short positions during the sharp market correction.
Although the funding rate briefly moved slightly above zero on March 7, it quickly returned to negative territory and ended the week near -0.006. This persistent negative funding environment indicates that bearish positioning remained dominant in derivatives markets, which could increase the potential for a short squeeze if prices continue to recover.
Long & Short Liquidations
Last week, with the BTC price fluctuating between $74,000 and $65,600, $544 million in long positions and $699 million in short positions were liquidated.
| Date | Long Amount (Million $) | Short Amount (Million $) |
|---|---|---|
| March 4 | 232.90 | 385.17 |
| March 5 | 48.83 | 28.90 |
| March 6 | 96.19 | 16.03 |
| March 7 | 32.84 | 3.52 |
| March 8 | 75.48 | 57.66 |
| March 9 | 19.45 | 133.57 |
| March 10 | 38.37 | 74.54 |
| Total | 544.06 | 699.39 |
Exchange Supply Ratio
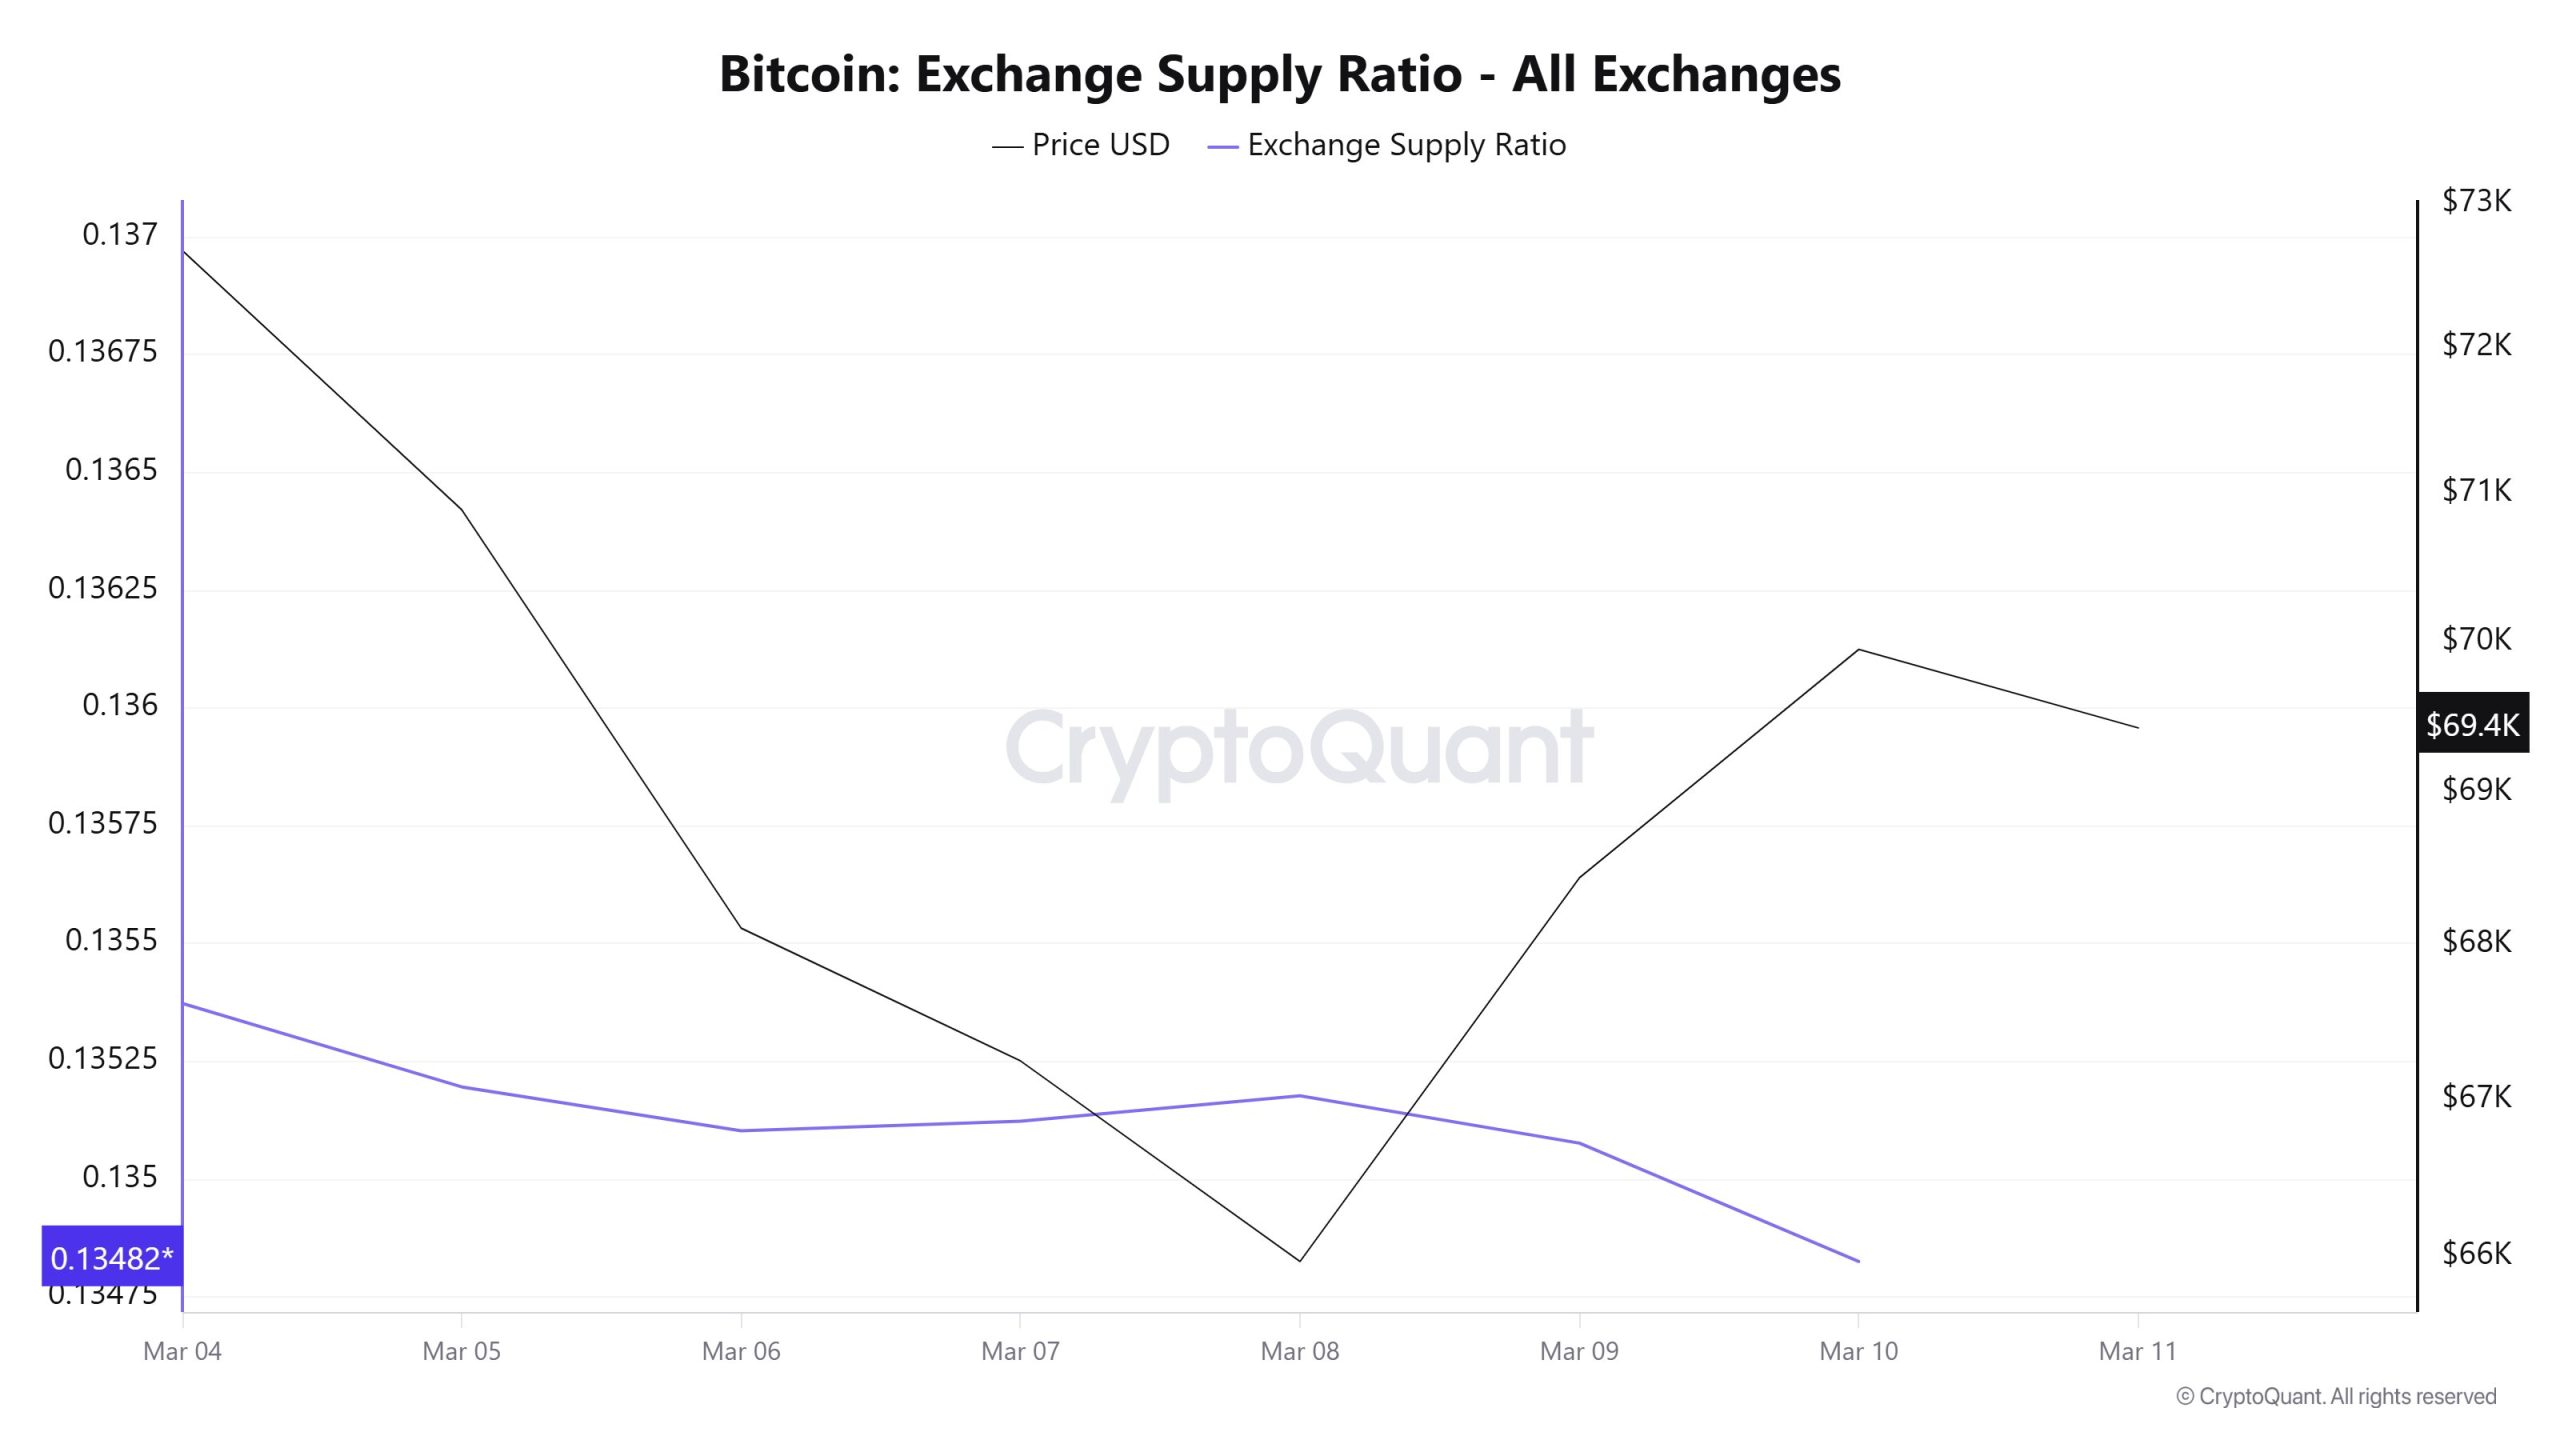
The Exchange Supply Ratio continued its downward trend throughout the week. The metric declined from approximately 0.1353 on March 4 to around 0.1348 by March 10. This gradual decrease indicates that a smaller portion of the Bitcoin supply is being held on exchanges. In practical terms, investors appear to be withdrawing their coins from exchanges to private wallets, suggesting a tendency toward holding rather than selling. This development generally points to a relatively limited level of immediate selling pressure in the market.
BTC On-Chain Overview
| Metric | Positive 📈 | Negative 📉 | Neutral ➖ |
|---|---|---|---|
| Active Addresses | ✓ | ||
| Breakdowns | ✓ | ||
| Derivatives | ✓ | ||
| Exchange Supply Ratio | ✓ |
*The metrics and guidance provided in the table do not alone explain or imply any expectation of future price changes for any asset. Digital asset prices can fluctuate based on many different variables. The on-chain analysis and related guidance are intended to assist investors in their decision-making process, and basing financial investments solely on the results of this analysis may lead to unfavorable outcomes. Even if all metrics produce positive, negative, or neutral results simultaneously, the expected outcomes may not materialize depending on market conditions. It would be beneficial for investors reviewing the report to take these warnings into consideration.
Legal Notice
The investment information, comments, and recommendations contained in this document do not constitute investment advisory services. Investment advisory services are provided by authorized institutions on a personal basis, taking into account the risk and return preferences of individuals. The comments and recommendations contained in this document are of a general nature. These recommendations may not be suitable for your financial situation and risk and return preferences. Therefore, making an investment decision based solely on the information contained in this document may not result in outcomes that align with your expectations.
NOTE: All data used in Bitcoin on-chain analysis is based on CryptoQuant.
