
Active Addresses
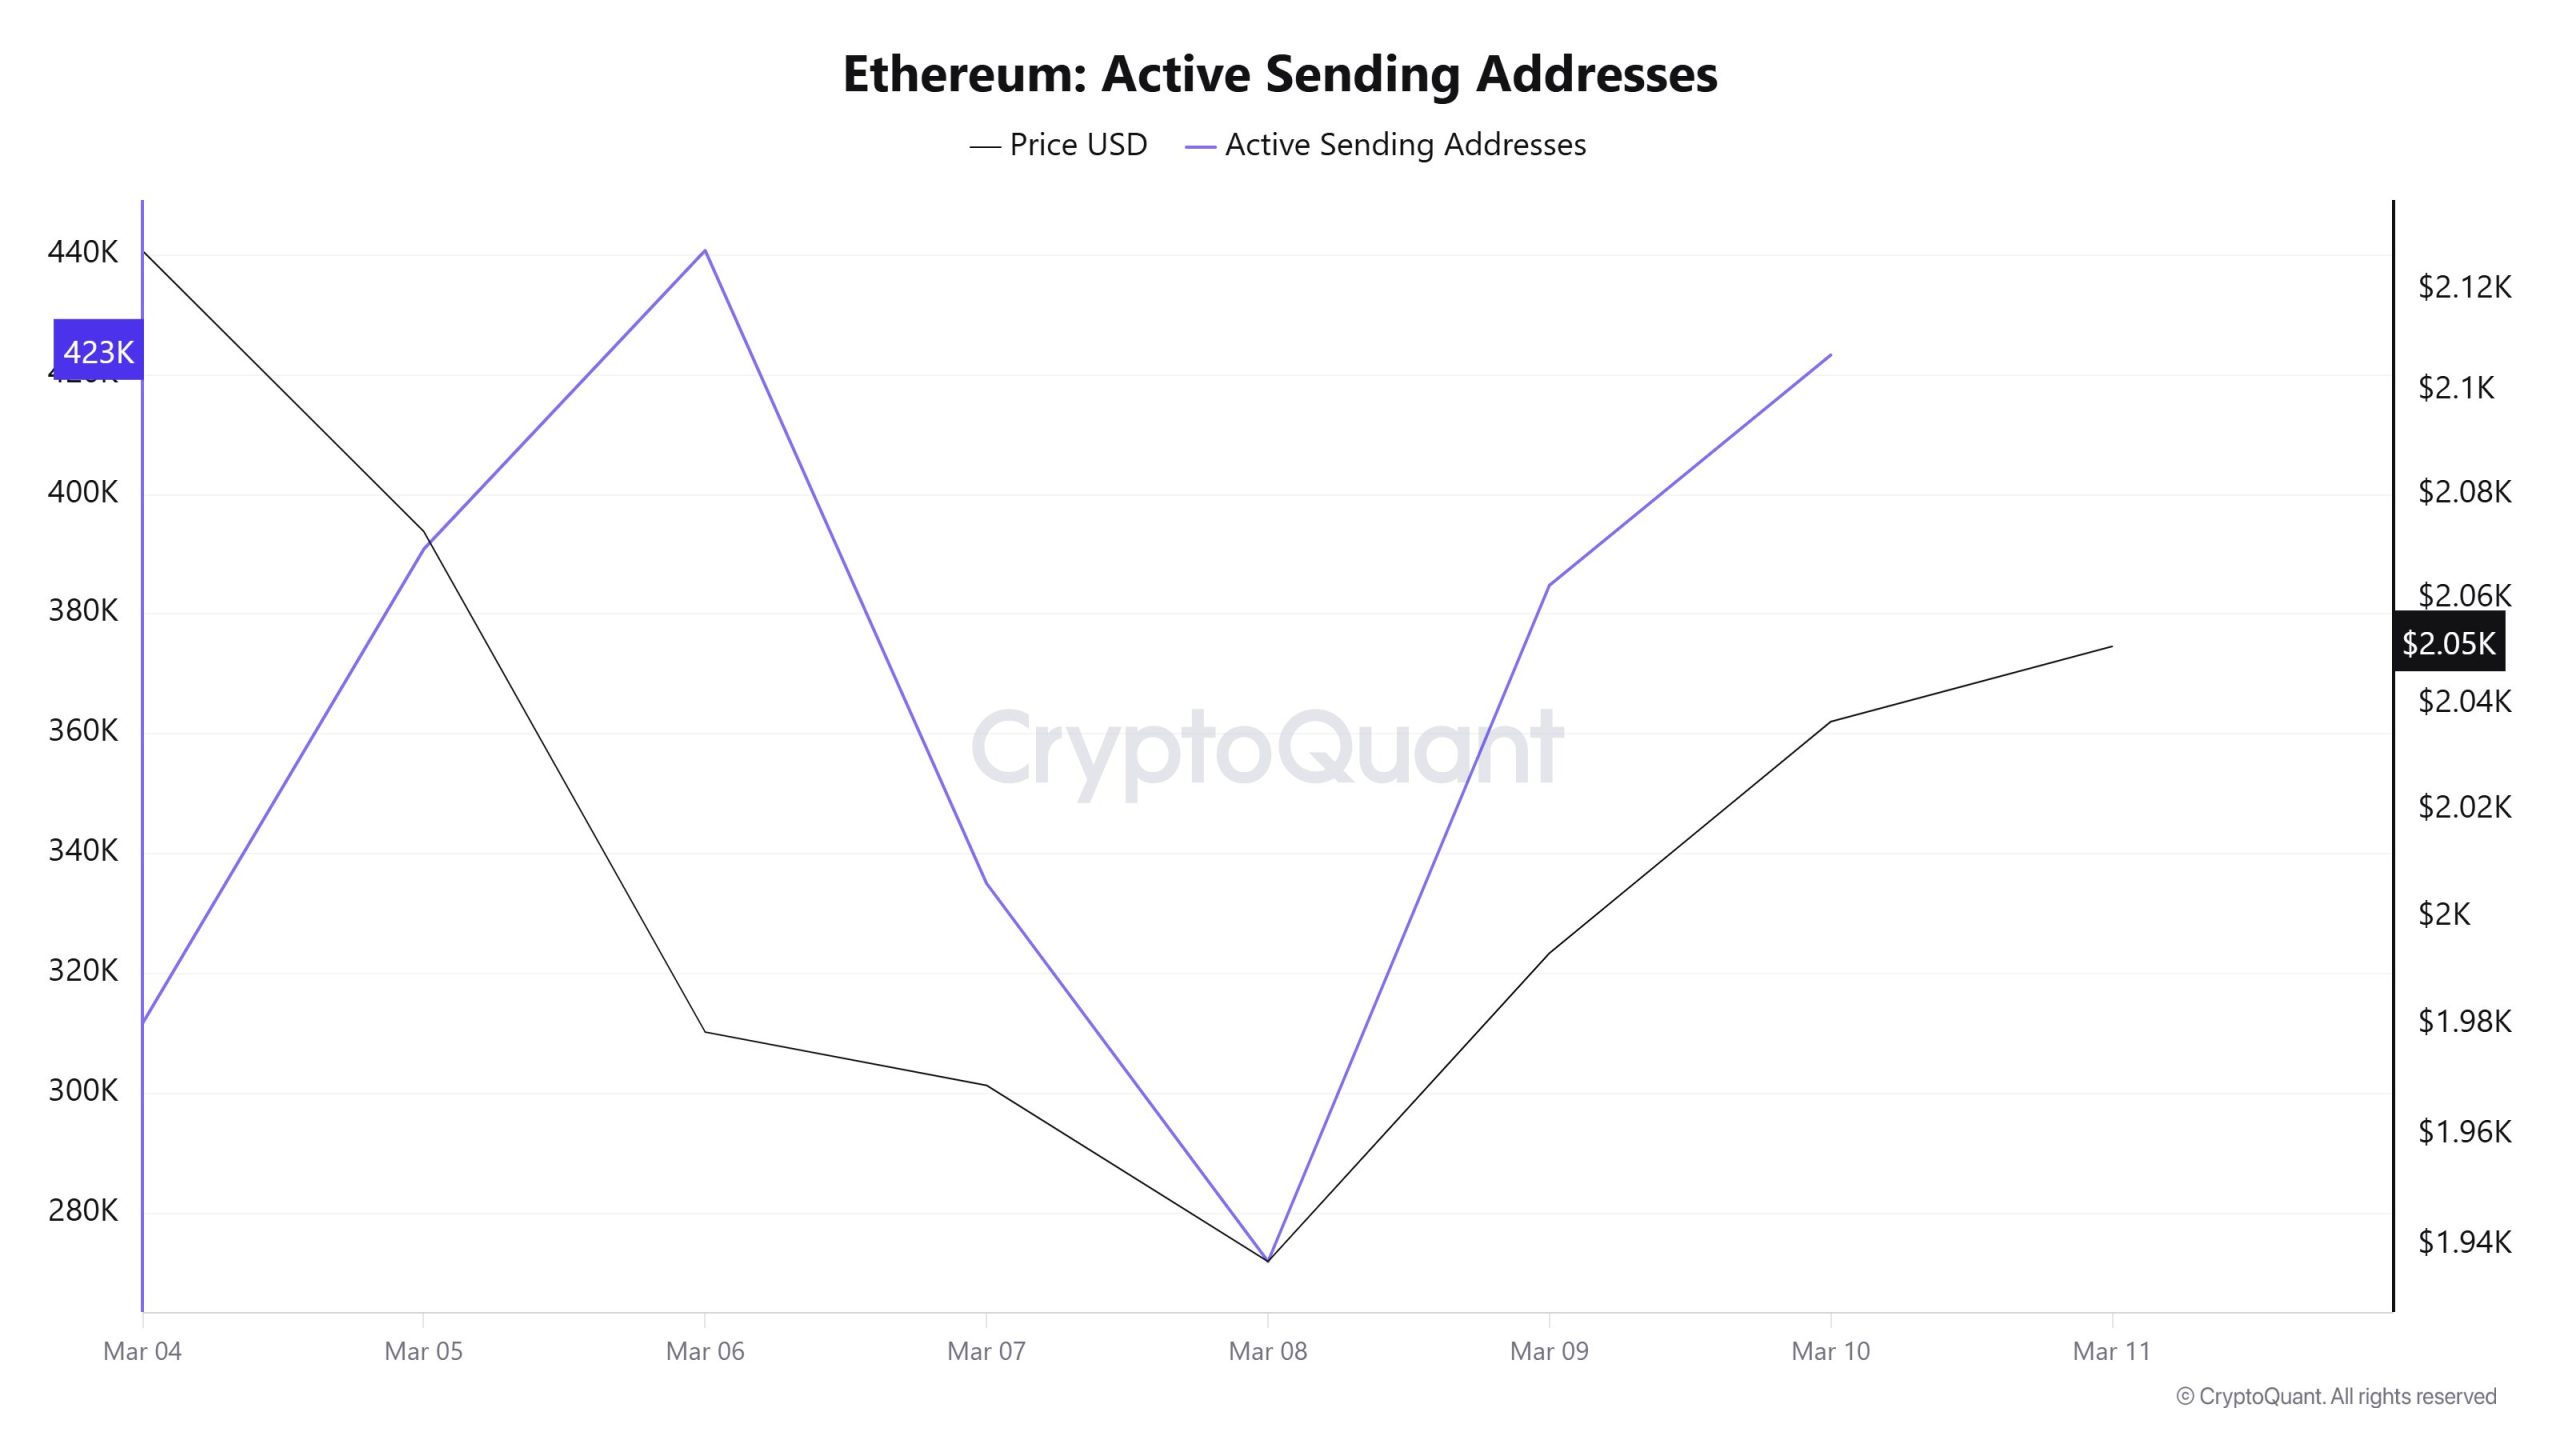
Active Sending Addresses
Between March 4 and March 10, active sending addresses on the Ethereum network showed a highly volatile pattern. The metric started the week at around 310,000 addresses and quickly rose to nearly 440,000 on March 6, marking the highest level of the period. However, this surge was followed by a sharp decline, with the number of active senders dropping to around 270,000 on March 8. In the following days, activity recovered again and climbed back to approximately 420,000 by March 10. This sharp fluctuation suggests that transaction activity briefly slowed during the mid-week price correction but picked up again as the market began to recover.
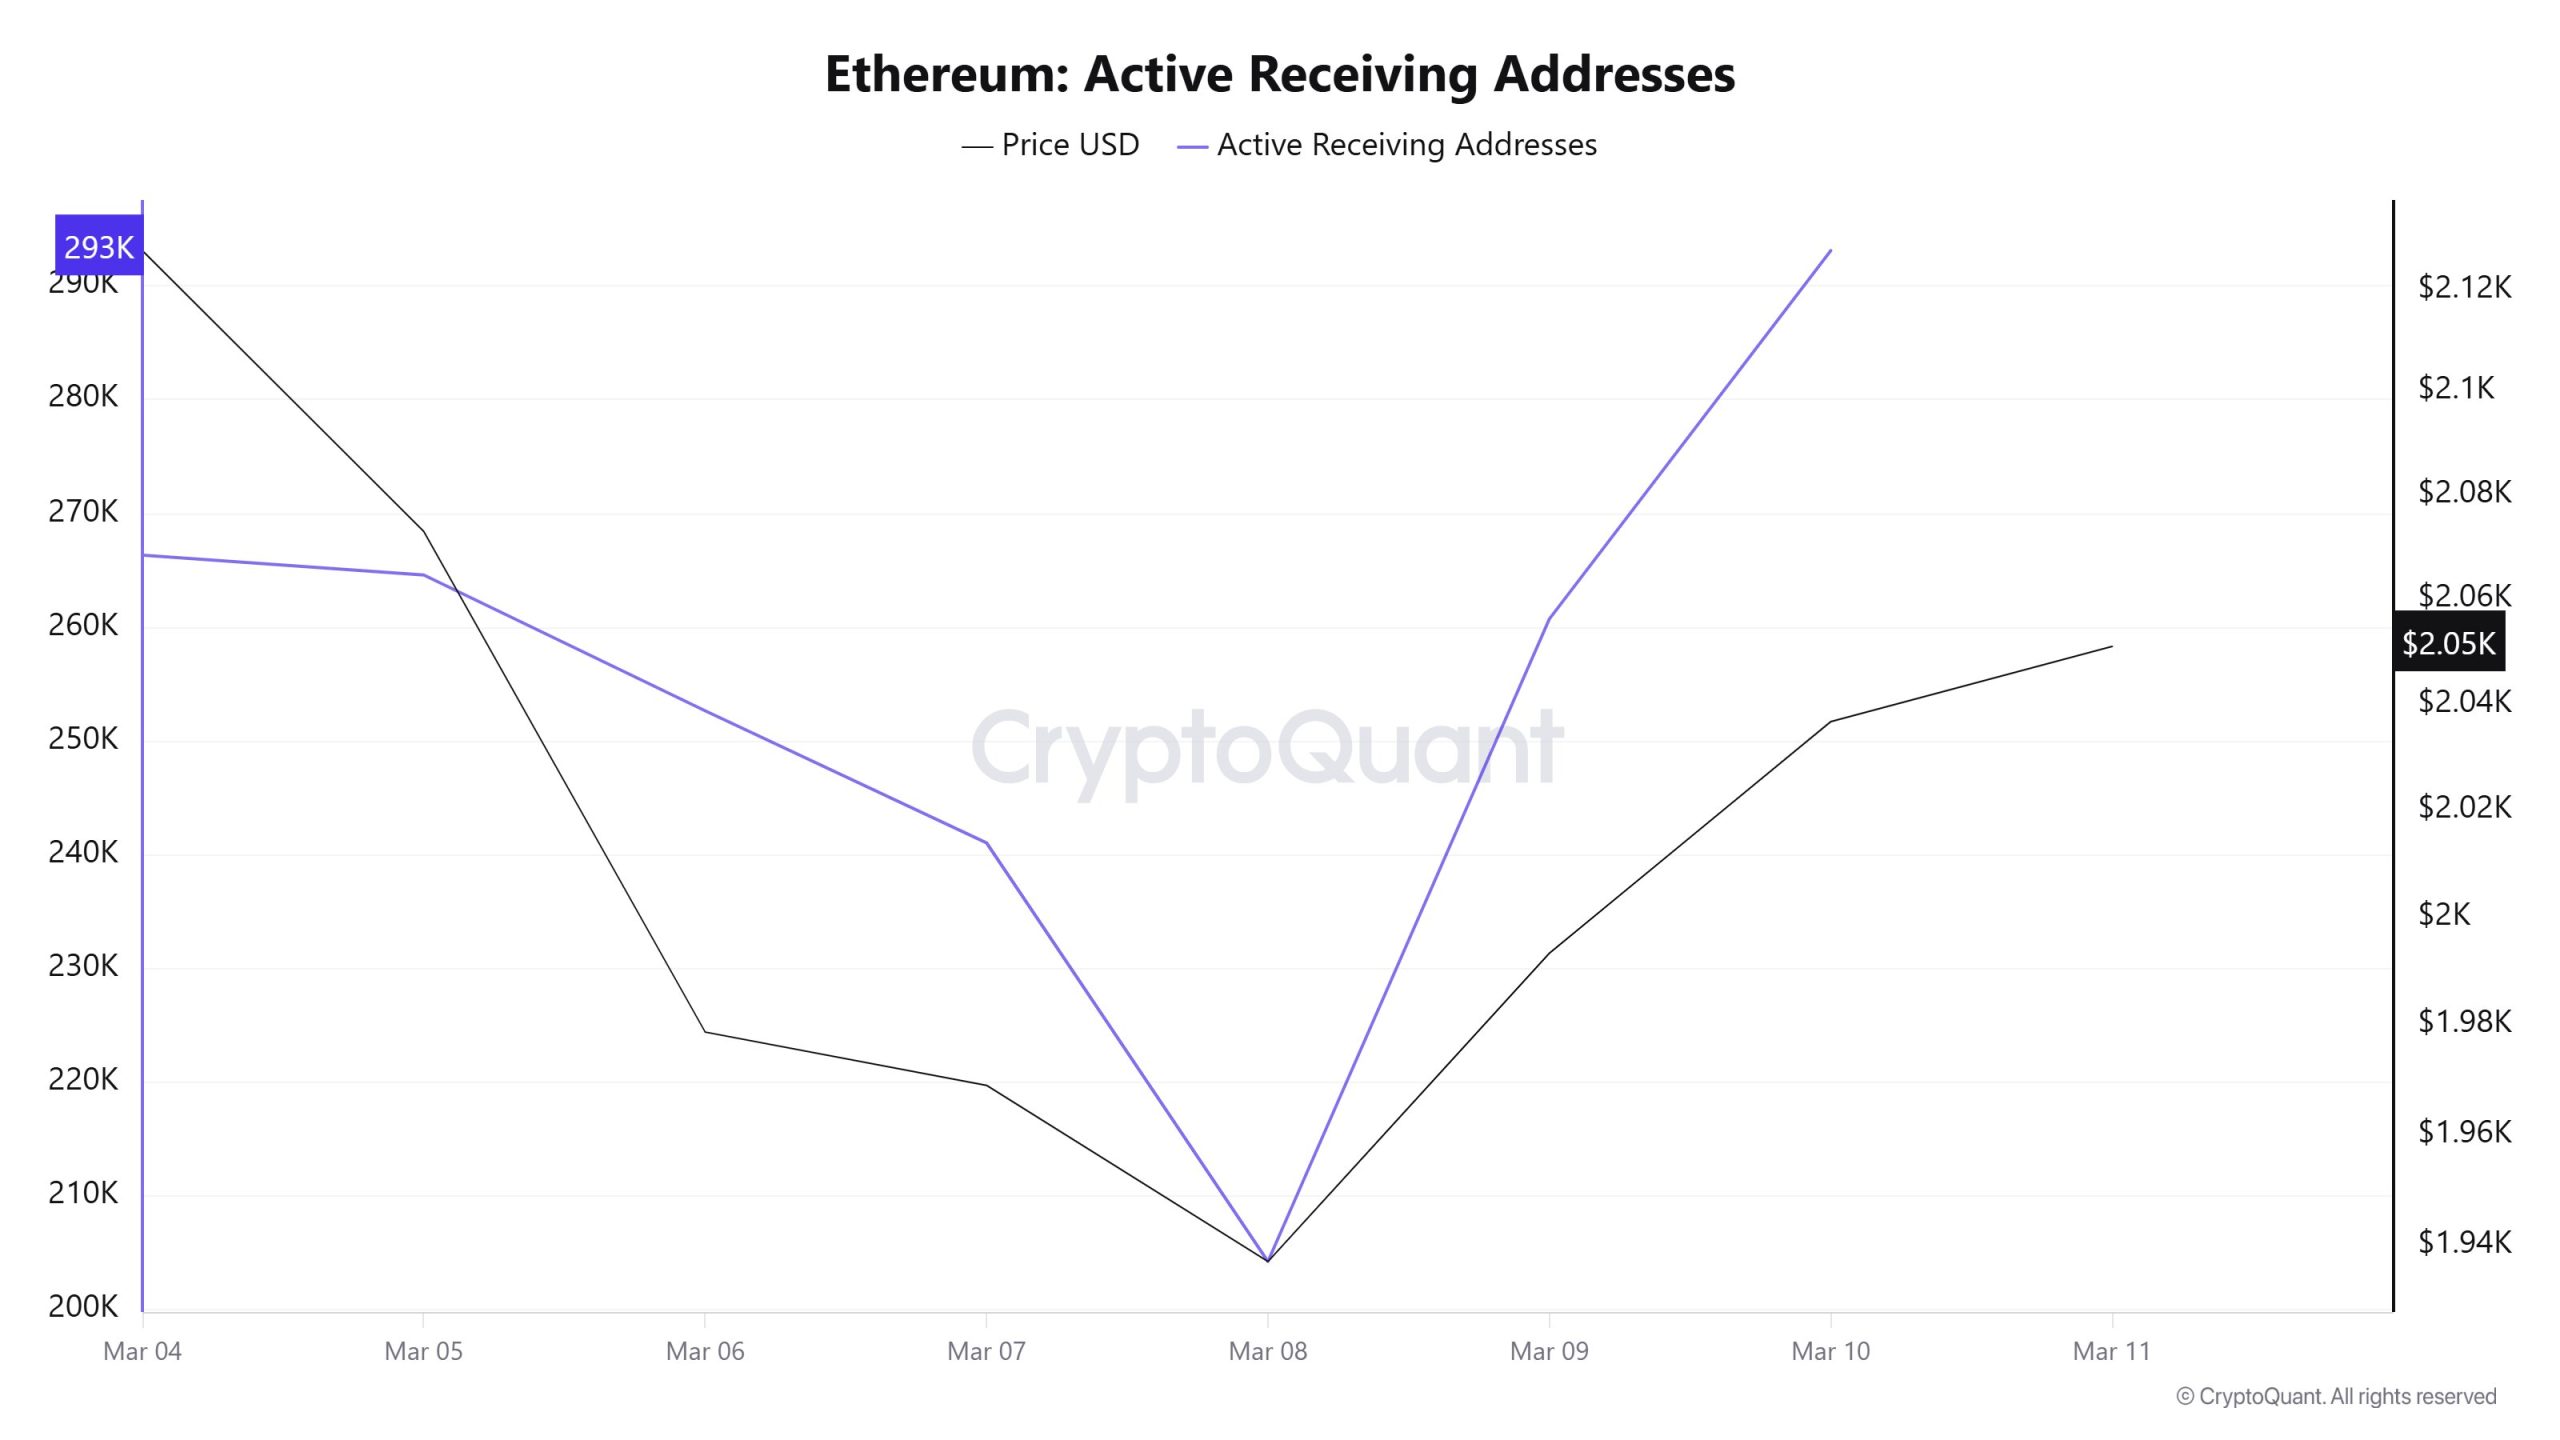
Active Receiving Addresses
Active receiving addresses on the Ethereum network followed a similar pattern during the same period. The metric started the week at around 265,000 and gradually declined to nearly 205,000 by March 8, reflecting the temporary slowdown in network demand during the price drop. However, a strong recovery occurred afterward, with receiving addresses rising sharply to around 290,000 by March 10. This rebound indicates that buyer activity returned as prices stabilized toward the end of the week.

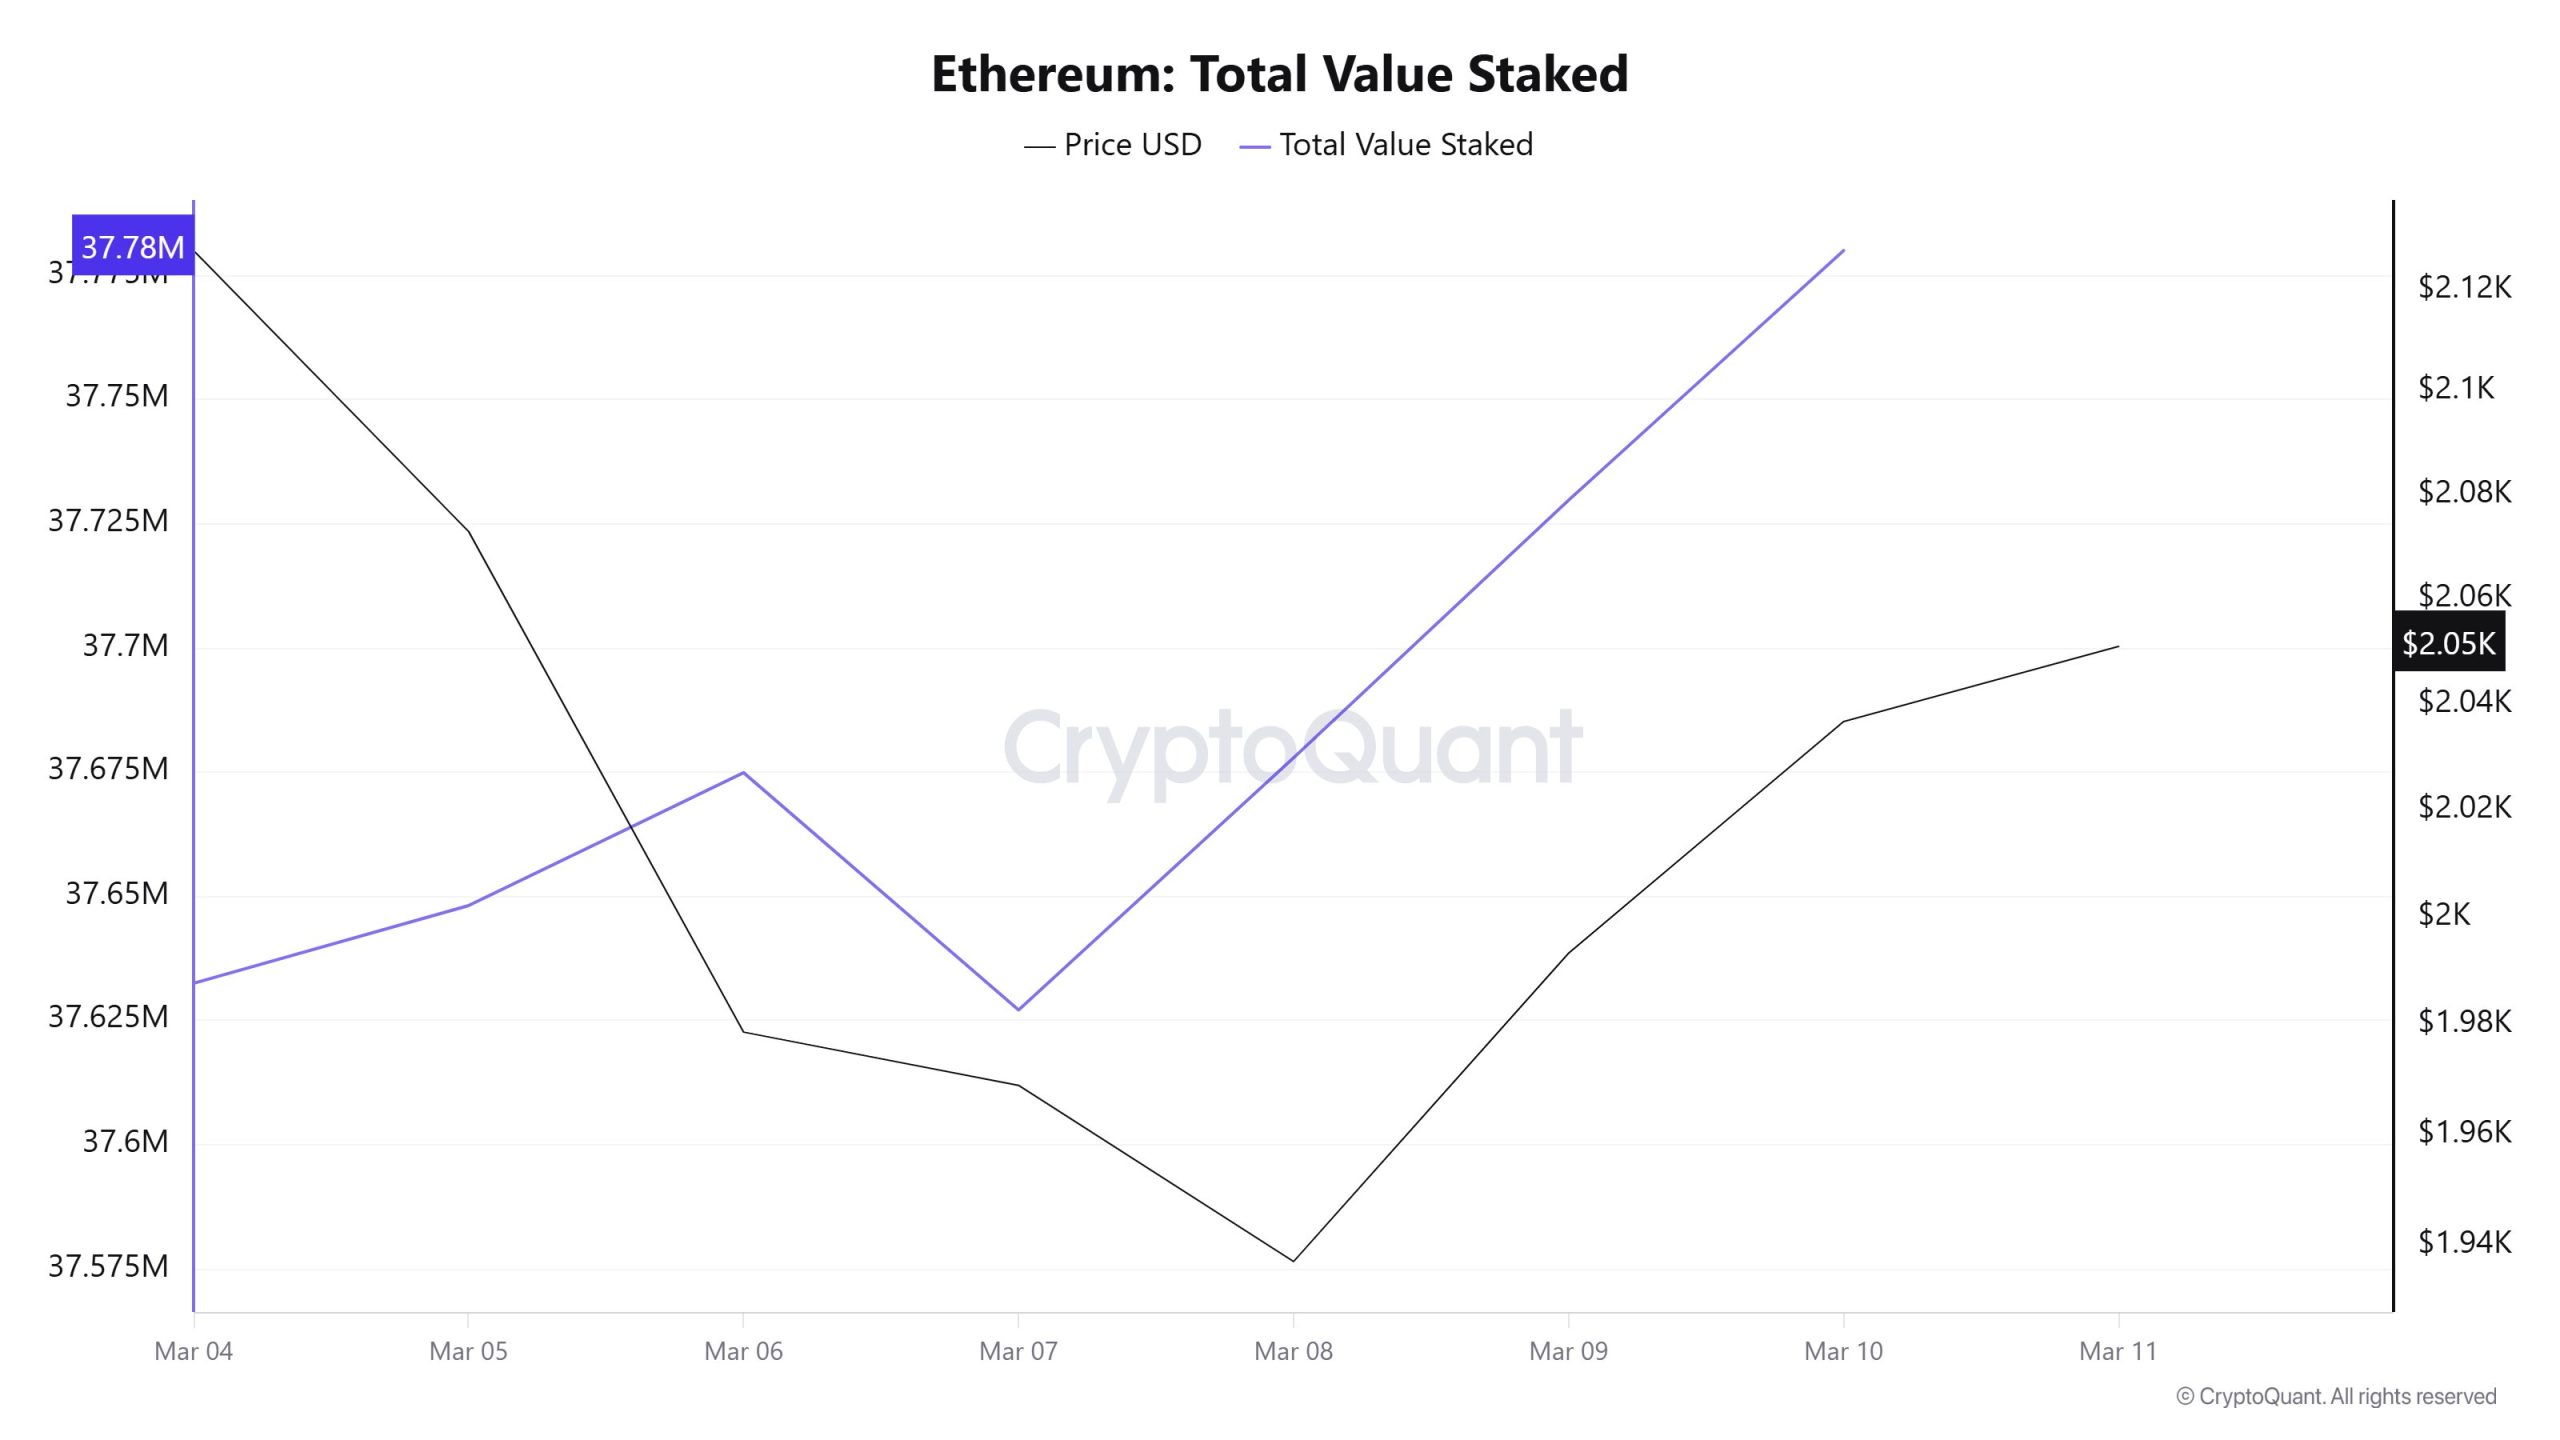
Total Value Staked
The total amount of ETH staked on the Ethereum network remained relatively stable with a slight upward trend during the week. The metric started at approximately 37.63 million ETH and briefly dipped to around 37.57 million ETH during the mid-week correction. In the second half of the week, staking levels increased steadily and reached nearly 37.78 million ETH, marking the highest level of the period. This gradual increase suggests that long-term investors continue to participate in staking despite short-term market volatility.
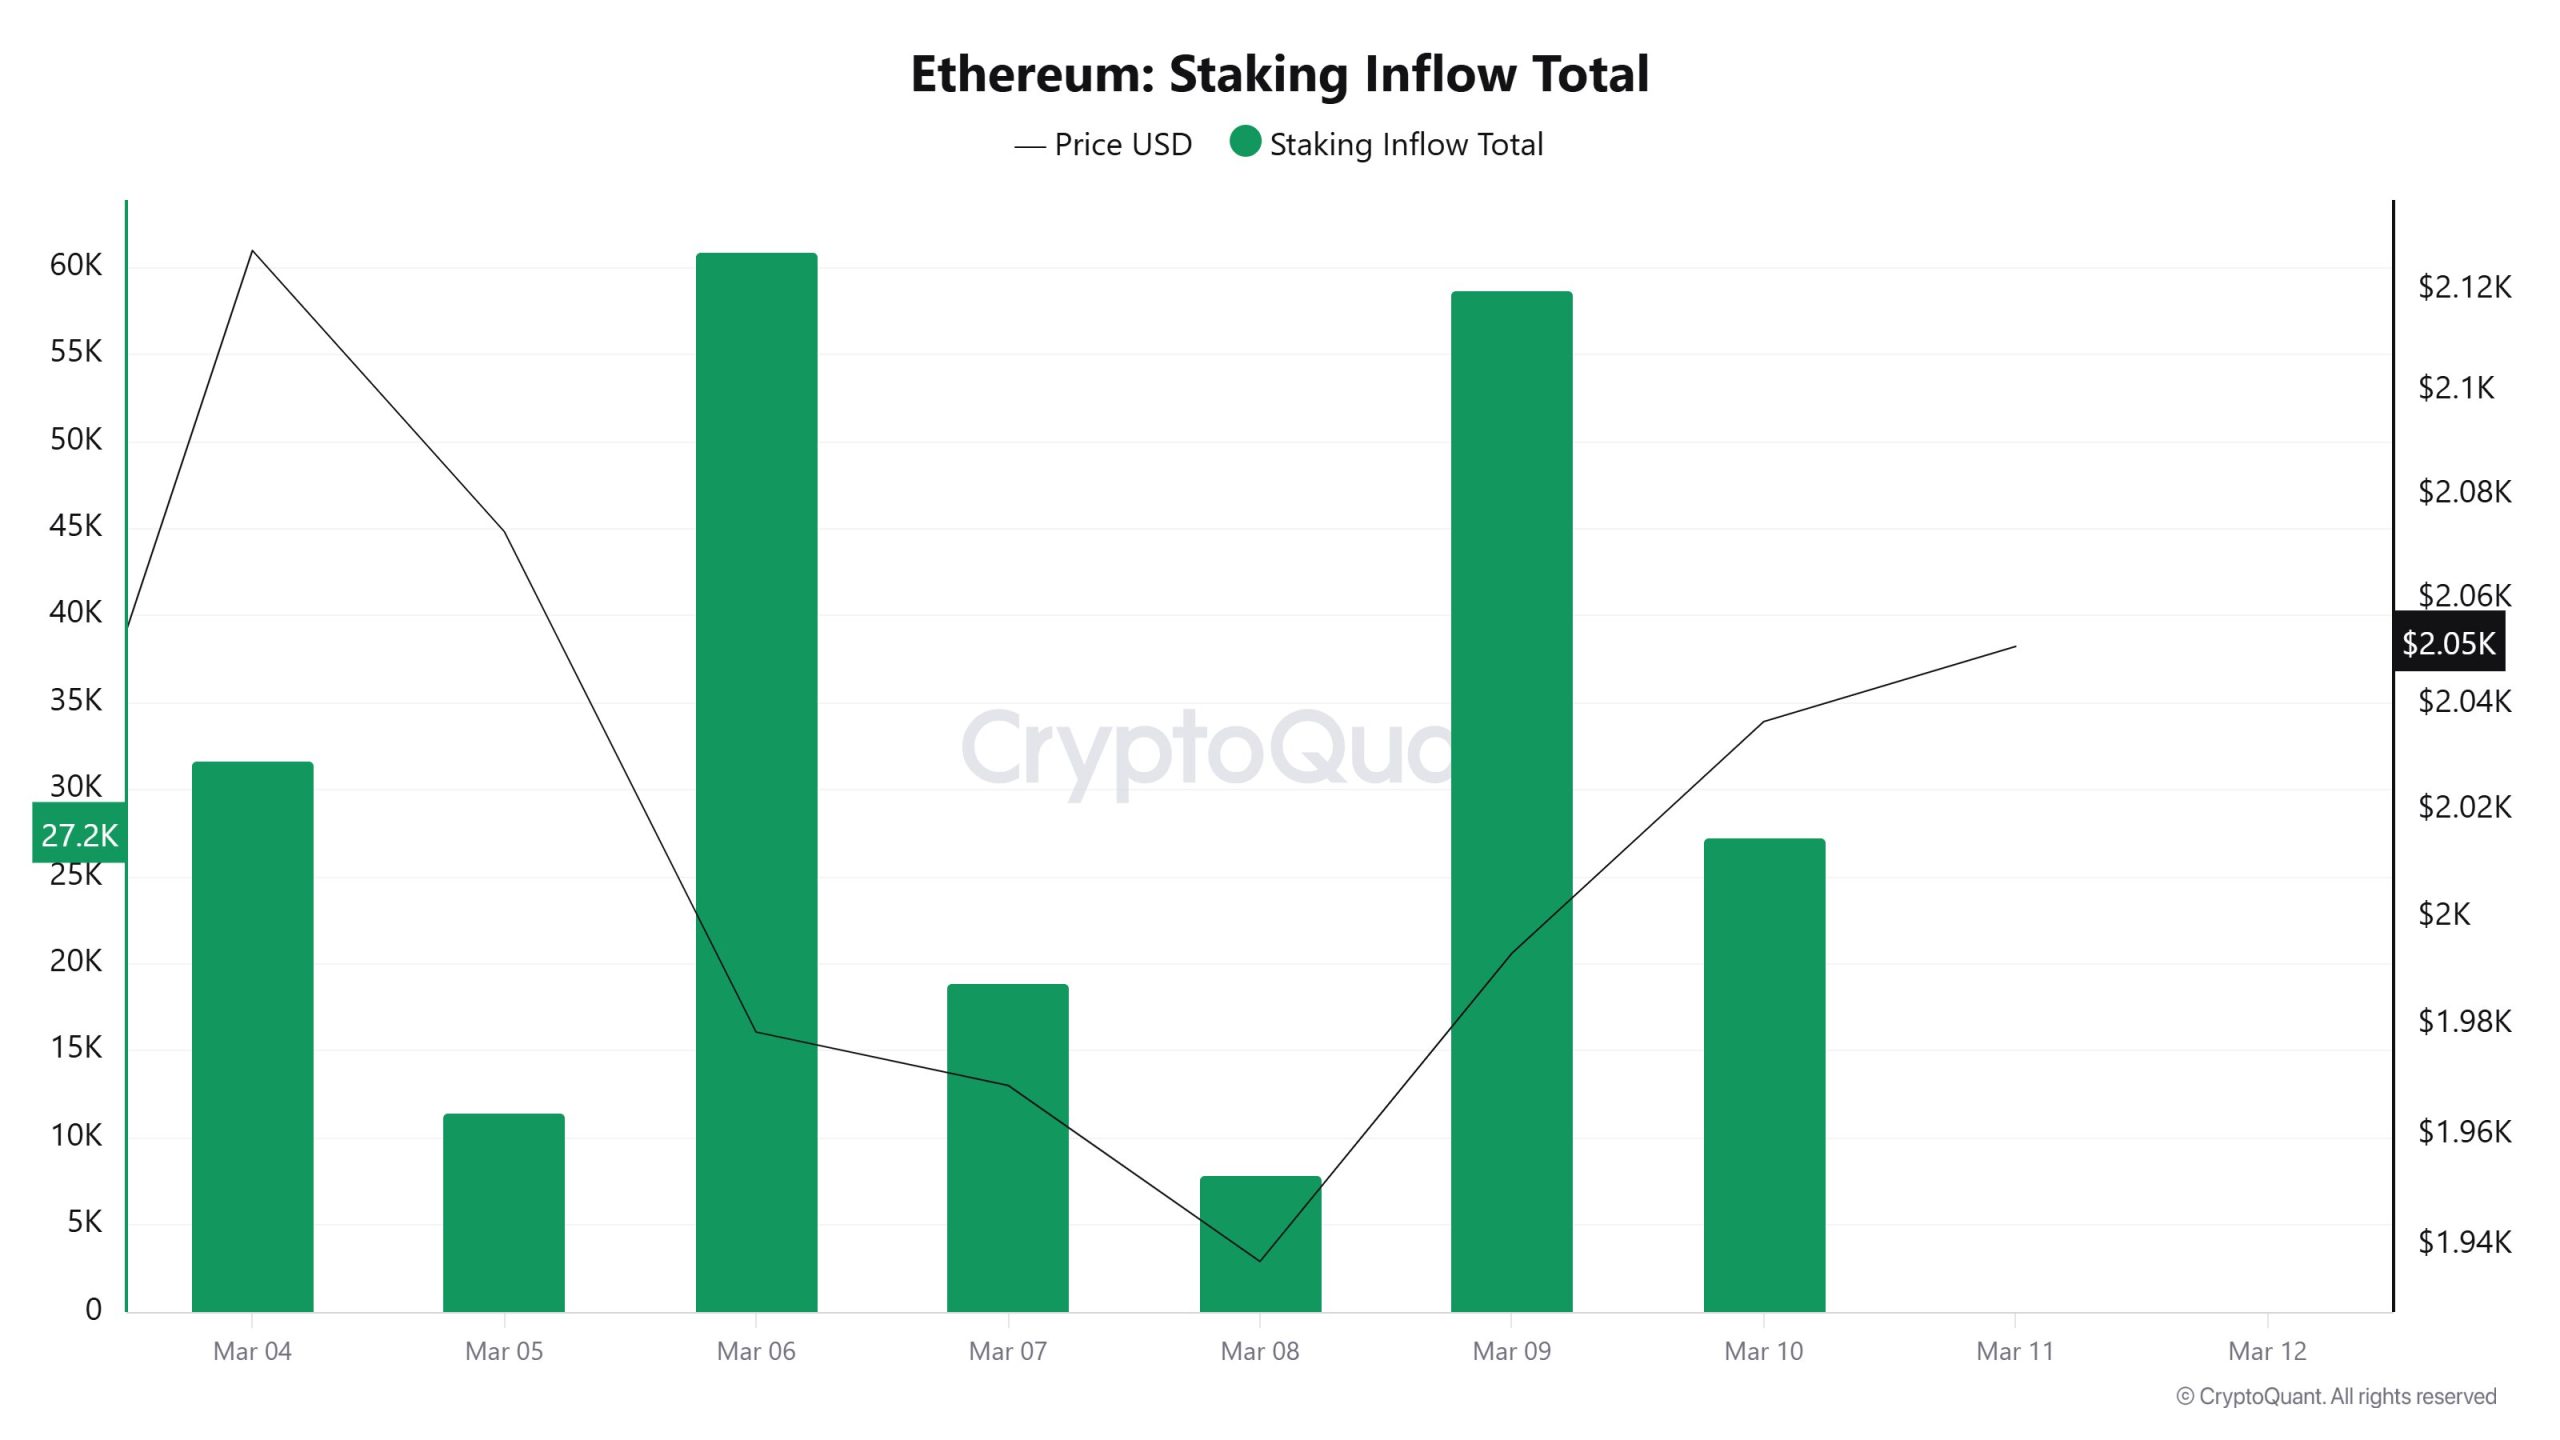
Staking Inflows
Ethereum staking inflows displayed significant volatility throughout the week. Inflows started at around 27,000 ETH on March 4, dropped sharply to approximately 11,000 ETH on March 5, and then surged to more than 60,000 ETH on March 6. After falling again to around 7,000 ETH on March 8, inflows rebounded strongly to nearly 58,000 ETH on March 9 before stabilizing near 27,000 ETH toward the end of the period. This sharp fluctuation indicates that staking participation is highly sensitive to short-term market movements, although overall inflows remain relatively strong.
Derivatives
Open Interest
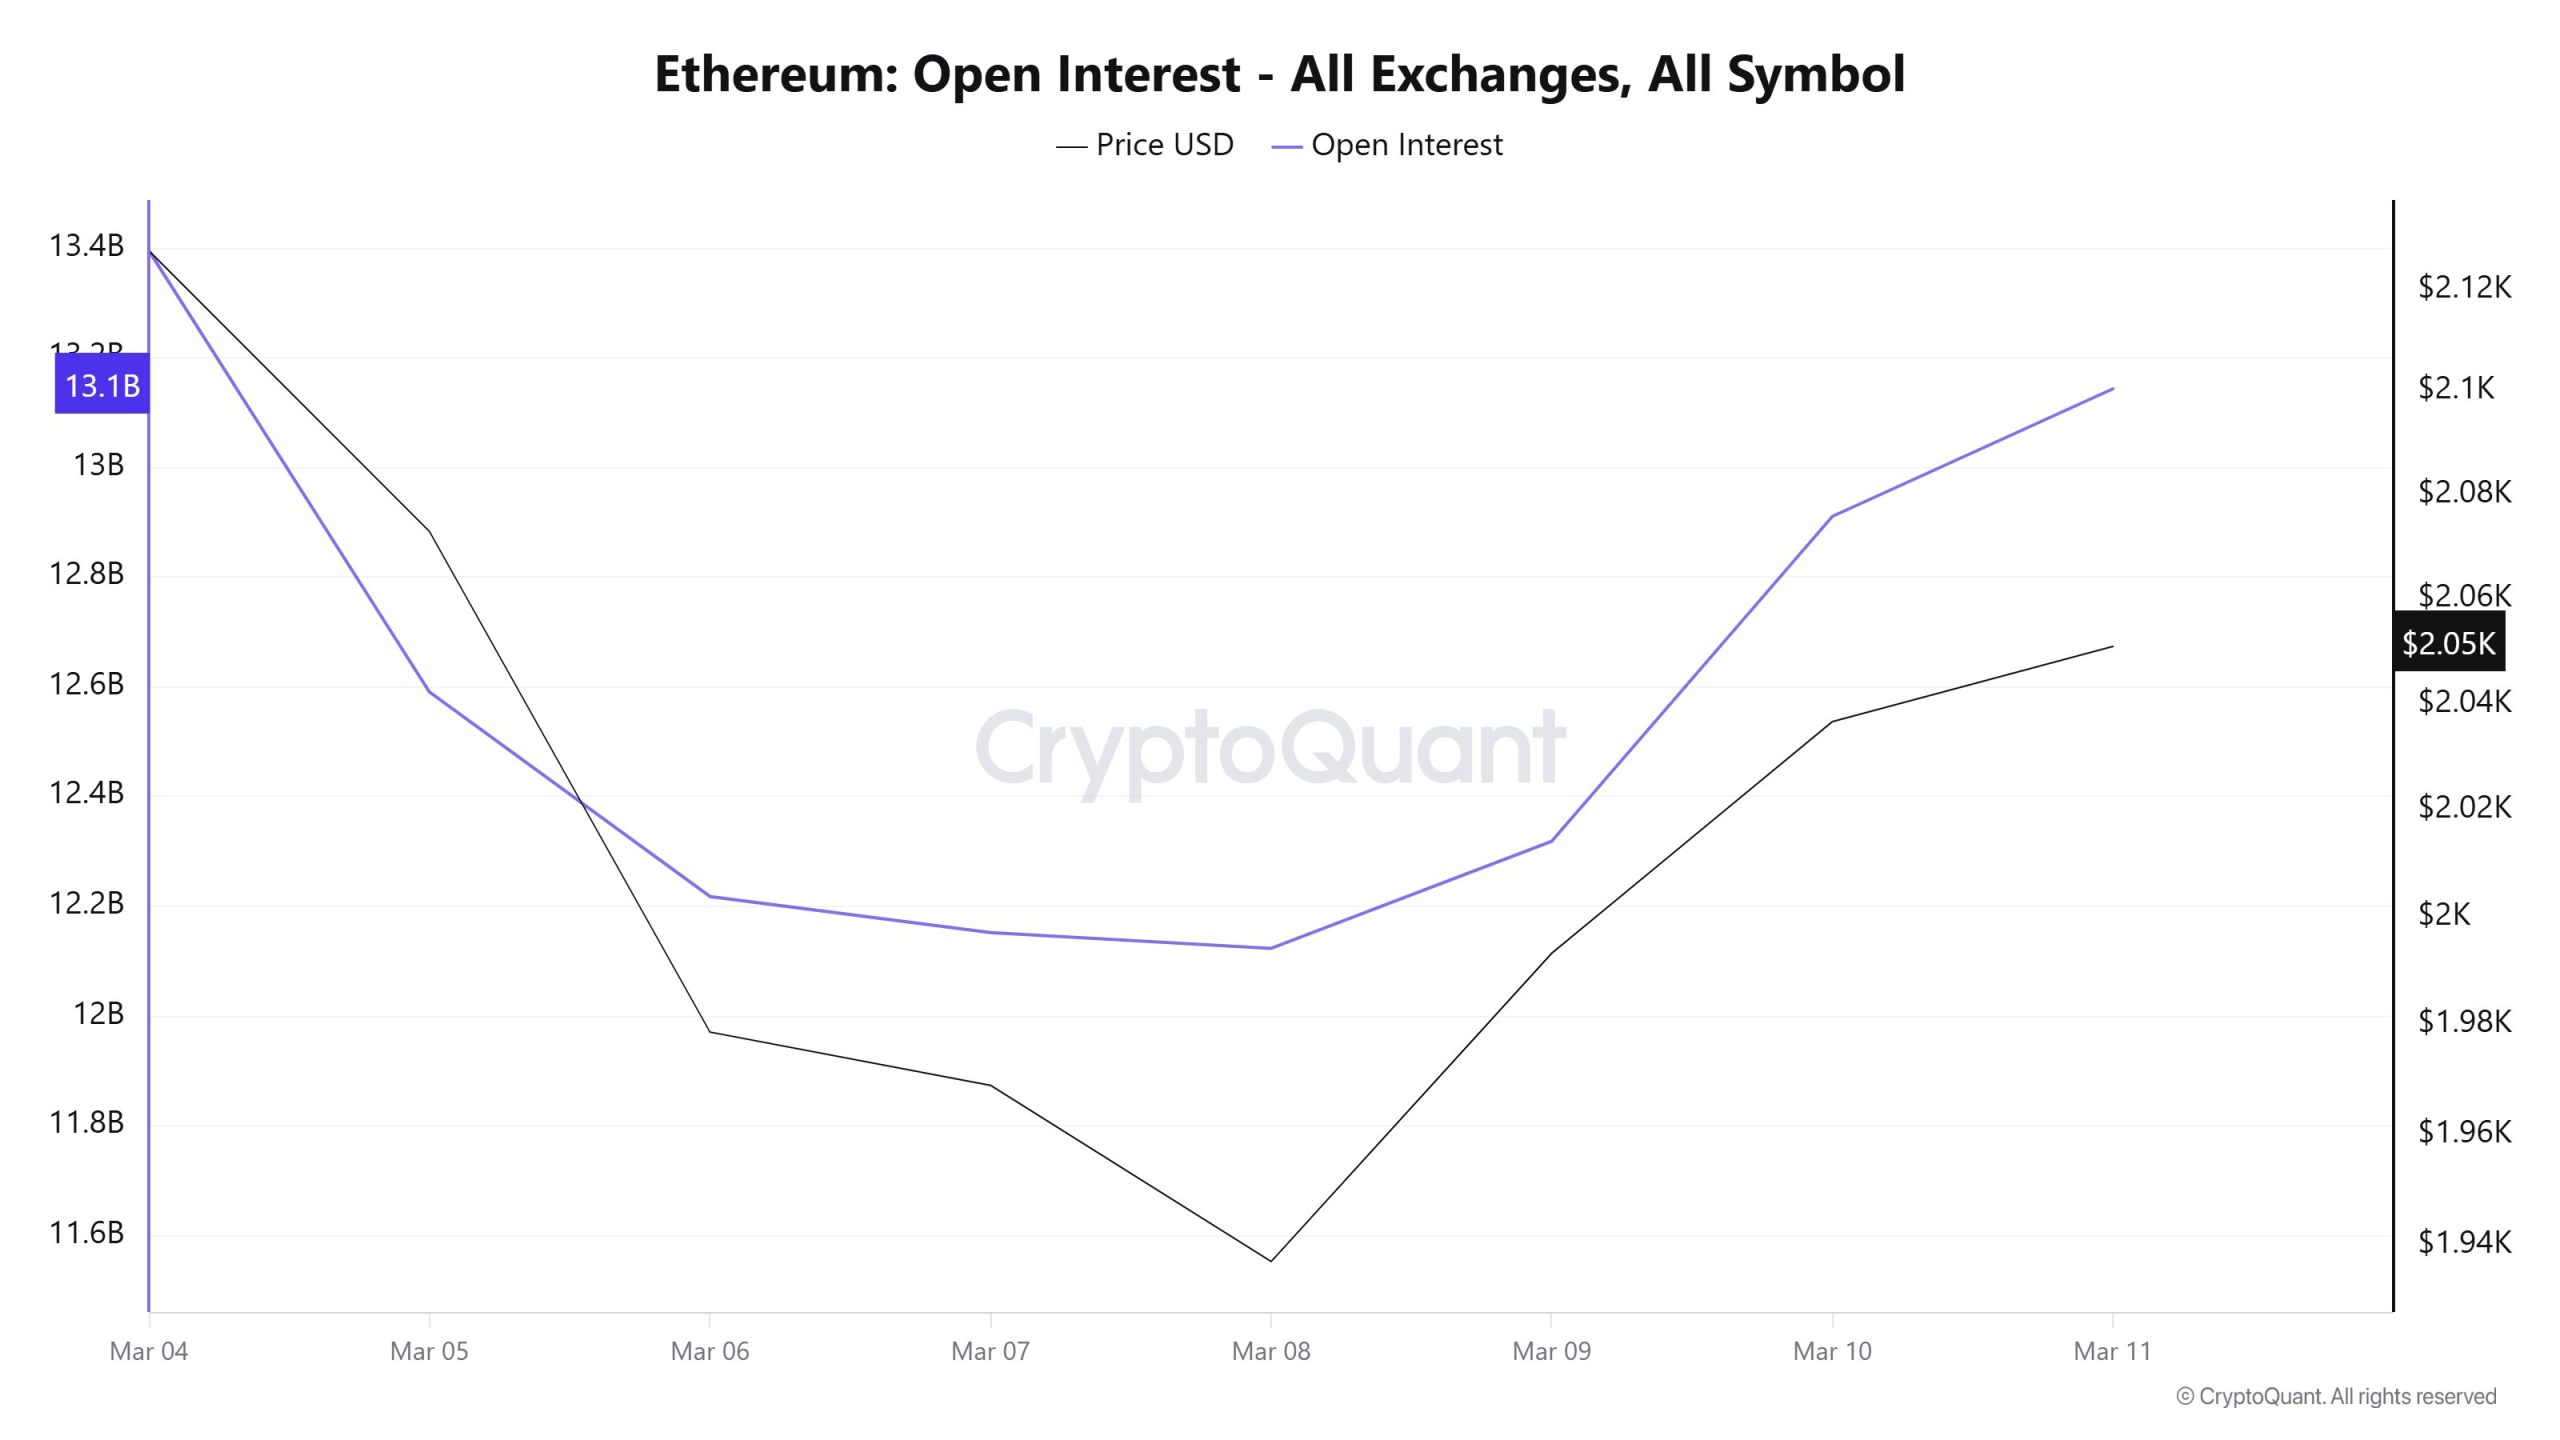
Ethereum Open Interest data showed a clear decline during the first half of the week before recovering strongly afterward. The metric started above $13.4 billion on March 4 and gradually fell to around $12.1 billion by March 8 as the market experienced a correction. However, a strong rebound followed, with Open Interest rising again to nearly $13.1 billion by March 11. This recovery suggests that traders began opening new positions again as the price recovered.
Funding Rate
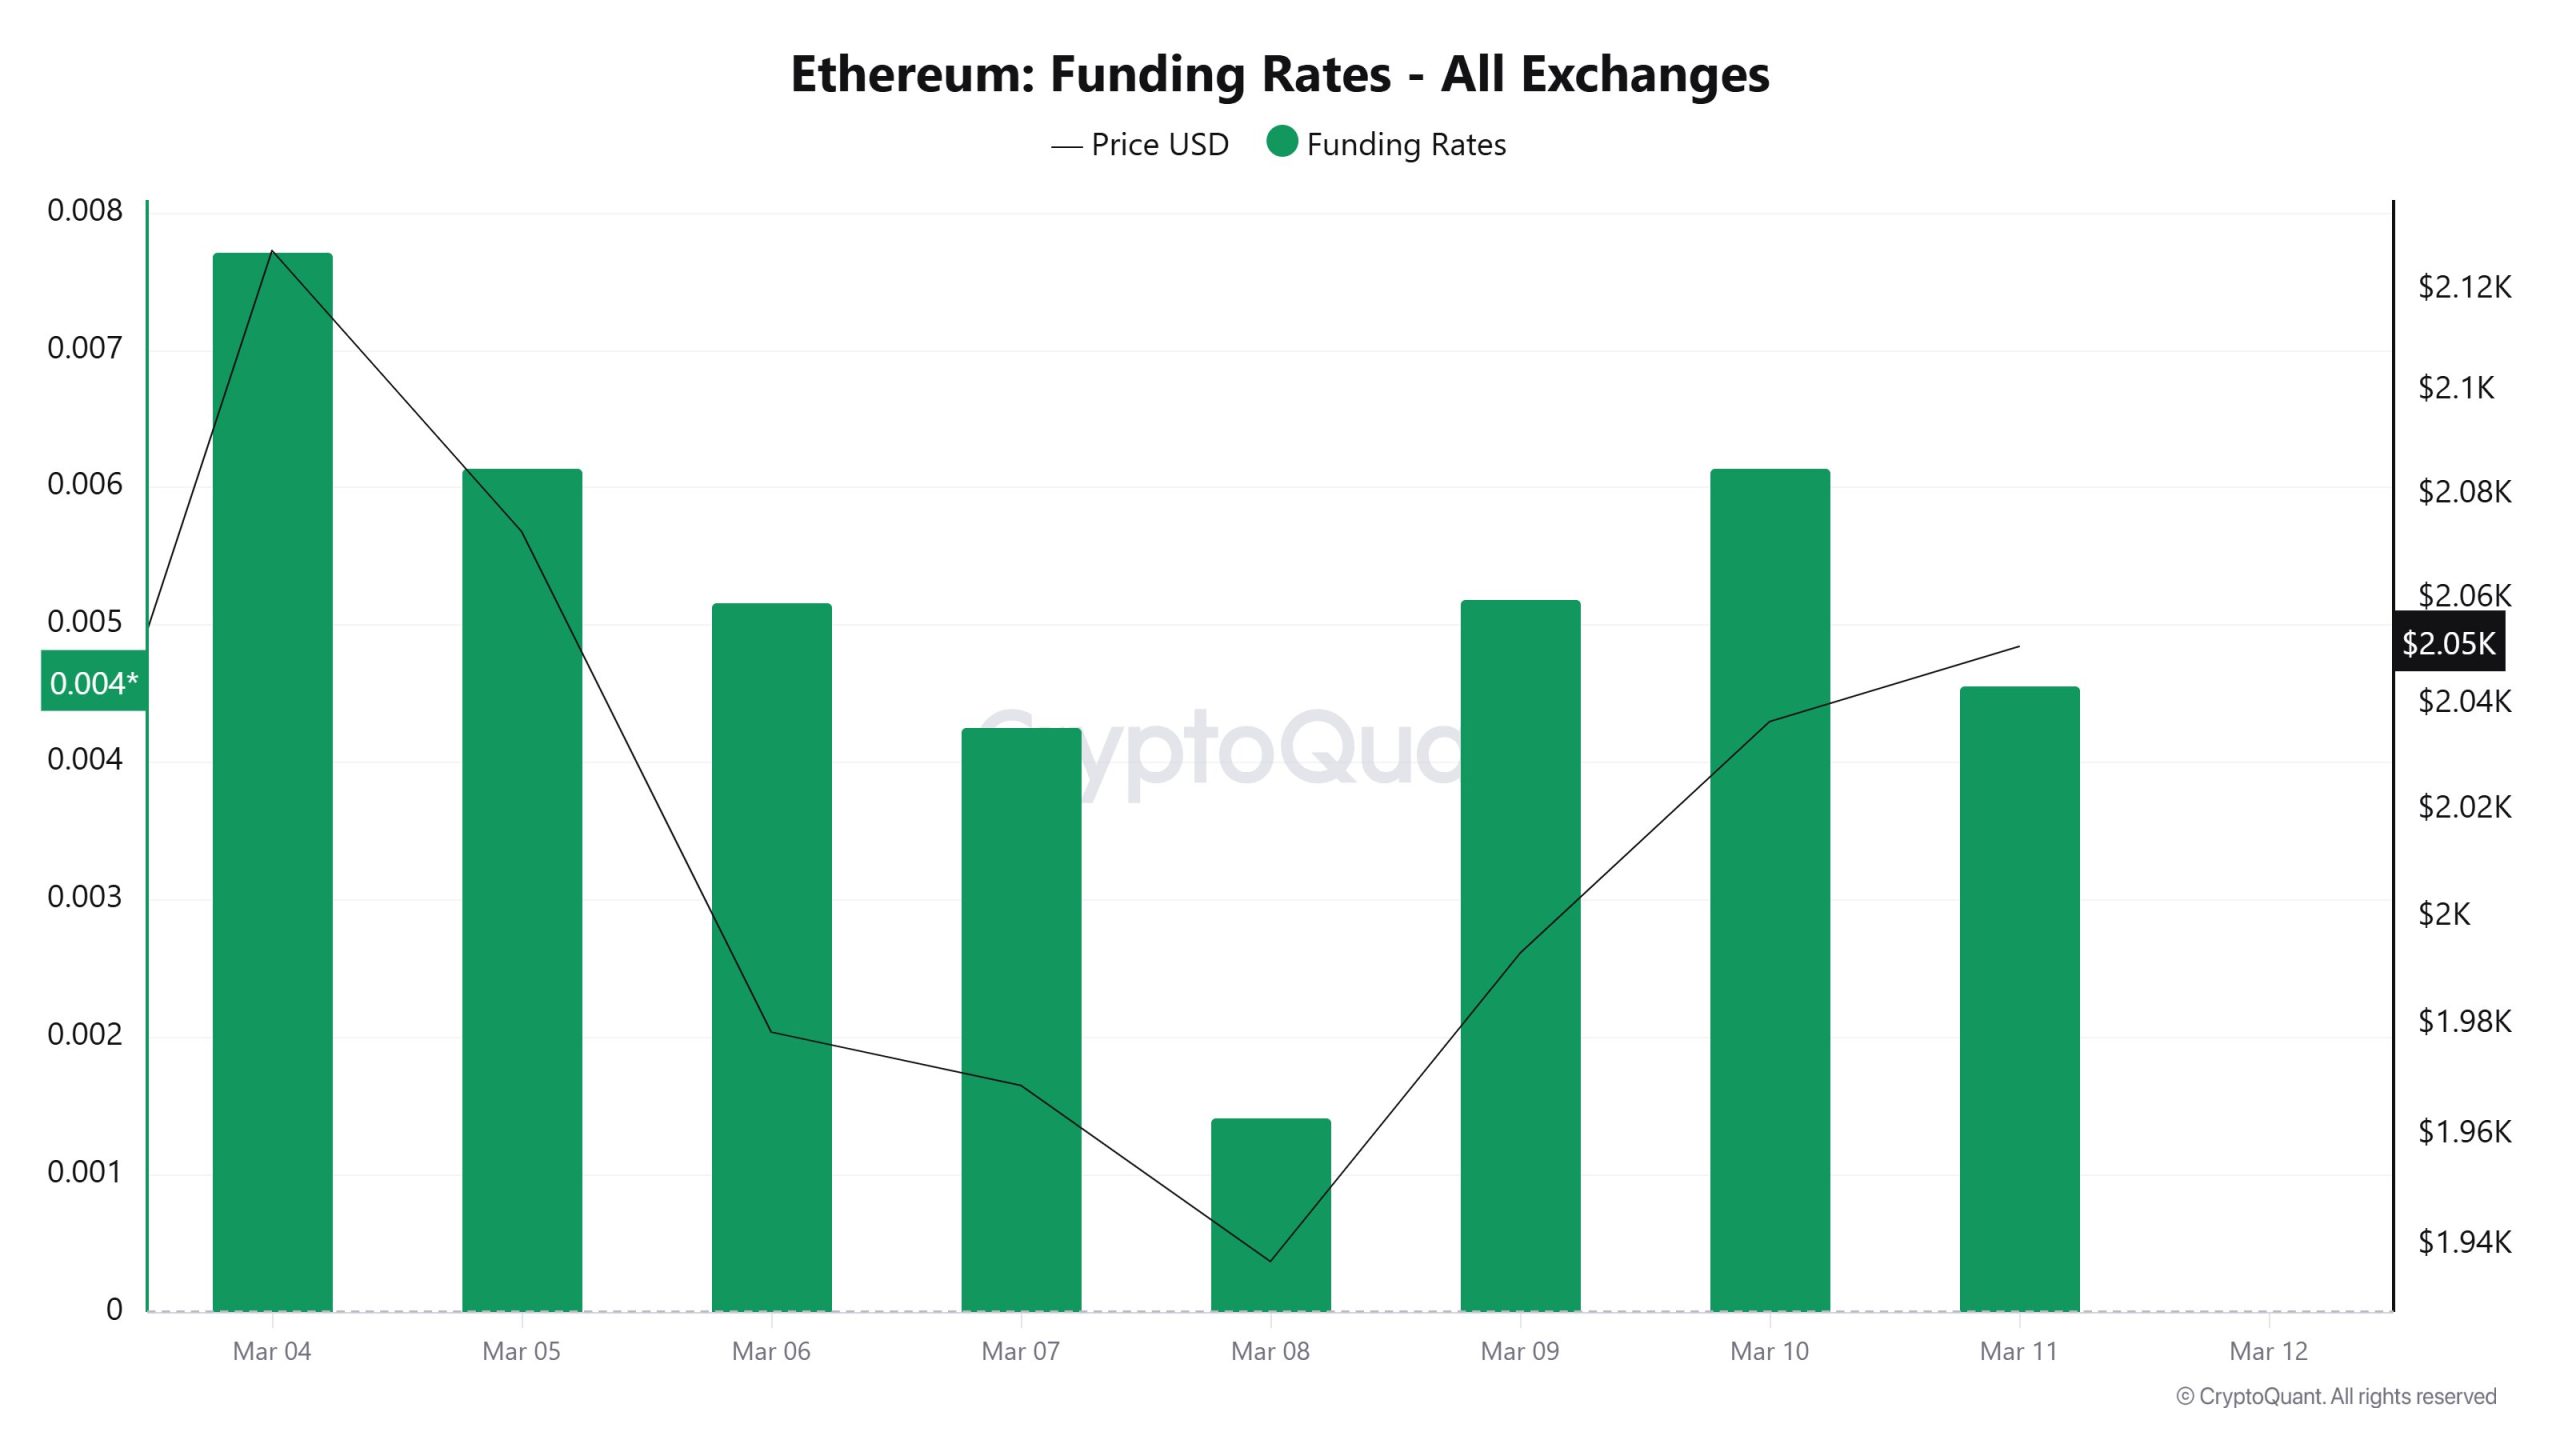
Ethereum funding rates remained in positive territory throughout most of the week, indicating a general dominance of long positions in the derivatives market. The funding rate started near 0.004 and briefly climbed to around 0.007 early in the week. Although the metric weakened to nearly 0.001 during the market pullback around March 8, it recovered again afterward and fluctuated between 0.004 and 0.006 toward the end of the period. This pattern shows that bullish positioning in the derivatives market remained relatively strong despite short-term volatility.
Long & Short Liquidations
ETH prices fluctuated between $2,200 and $1,917 last week, with $304 million in long positions and $342 million in short positions being liquidated.
| Date | Long Amount (Million $) | Short Amount (Million $) |
|---|---|---|
| March 4 | 35.12 | 127.75 |
| March 5 | 62.98 | 32.66 |
| March 6 | 82.35 | 11.19 |
| March 7 | 18.24 | 5.93 |
| March 8 | 42.96 | 20.08 |
| March 9 | 24.94 | 90.37 |
| March 10 | 37.99 | 54.57 |
| Total | 304.58 | 342.55 |
ETH On-Chain Total
| Metric | Positive 📈 | Negative 📉 | Neutral ➖ |
|---|---|---|---|
| Active Addresses | ✓ | ||
| Total Value Staked | ✓ | ||
| Derivatives | ✓ | ||
| Staking Inflows | ✓ |
*The metrics and guidance provided in the table do not alone explain or imply any expectation regarding future price changes in any asset. Digital asset prices can fluctuate based on numerous variables. The on-chain analysis and related guidance are intended to assist investors in their decision-making process, and basing financial investments solely on the results of this analysis may lead to unfavorable outcomes. Even if all metrics produce positive, negative, or neutral results simultaneously, the expected outcomes may not materialize depending on market conditions. It would be beneficial for investors reviewing the report to take these warnings into consideration.
Legal Notice
The investment information, comments, and recommendations contained in this document do not constitute investment advisory services. Investment advisory services are provided by authorized institutions on a personal basis, taking into account the risk and return preferences of individuals. The comments and recommendations contained in this document are of a general nature. These recommendations may not be suitable for your financial situation and risk and return preferences. Therefore, making an investment decision based solely on the information contained in this document may not result in outcomes that align with your expectations.
NOTE: All data used in Ethereum on-chain analysis is based on CryptoQuant.
