
Fear & Greed Index

Source: Alternative.me
- Change in Fear and Greed Level: -3
- Last Week’s Level: 18
- This Week’s Level: 15
The Fear and Greed Index fell from 18 last week to 15 this week, signaling a slight weakening in investor sentiment. Although the index has shown a decline, market sentiment remains in the “extreme fear” zone. Looking at the data, the index was at 18 yesterday as well, and over the past month, it has fallen as low as 11, indicating that investor psychology has been in the extreme fear zone for quite some time.
It is noteworthy that there has been a parallel movement between the Bitcoin price and the Fear and Greed Index during certain periods. Although there have been occasional inflows of funds from the institutional side, the current sentiment level indicates that Bitcoin’s safe-haven perception has not yet fully solidified and that the market’s maturation process is ongoing.
In the coming period, a rise in the index above the 20 level could cause market sentiment to move out of the extreme fear zone and into the “fear” phase. Such a scenario could signal a strengthening of a gradual recovery trend in the Bitcoin price.
Fund Flows

Source: Coinshares
Overview:
Positive fund flows continued this week in crypto asset investment products. According to CoinShares data, the recovery trend in the markets was reflected in institutional fund inflows, with Bitcoin and Ethereum funds standing out in particular. However, limited outflows in some altcoins also drew attention.
- Weekly total inflows: $619 million
- MTD (Month-to-date): +$619 million
- YTD (Year-to-date): +$45 million
The majority of weekly fund inflows once again flowed into Bitcoin.
- Bitcoin weekly inflows: $521M – It appears that institutional investors continue to prefer Bitcoin during periods of risk aversion. Total inflows year-to-date stand at $117M.
- Ethereum weekly inflow: $88.5M – While a strong recovery is visible on a weekly basis, the YTD figure of -$340M indicates that institutional outflows from Ethereum funds have continued throughout the year.
- Solana weekly inflow: $14.6M – Solana continues to see positive inflows among altcoins. With a year-to-date total of $170M, strong institutional demand persists.
- XRP weekly flow: -$30.3M – There was a significant institutional outflow on the XRP side this week.
Other assets:
- Short Bitcoin: +$11.4M
- Chainlink: +$1.4M
- Sui: +$0.3M
- Litecoin: -$0.3M
The overall picture shows that institutional capital is primarily flowing into Bitcoin, while the flow into altcoins is more selective.
Total Market Cap

Source: TradingView
- Market Value Last Week: $2.31 Trillion
- Market Value This Week: $2.41 Trillion
This week, the cryptocurrency market rose by approximately 10 billion USD, an increase of 1.21%, and the total market cap is currently hovering around 2.41 trillion USD. The weekly high was recorded at 2.41 trillion USD, while the low was 2.25 trillion USD.
Total 2
The Total 2 index, which began the week with a market capitalization of 943.56 billion USD, rose by 1.52% over the course of the week. The weekly high was recorded at 981 billion USD, while the low was 928 billion USD. The index’s fluctuation within a 53 billion USD range corresponds to a volatility rate of approximately 1.44% for the period.
Total 3
The Total 3 index, which began the week with a total market capitalization of 704 billion USD, rose by approximately 1.46% over the course of the week and is currently at 726.66 billion USD.
The fact that the indices’ volatility-based ranking is “Total 3 > Total 2 > Total 1” indicates that volatility is increasing among altcoins.
Bitcoin Dominance
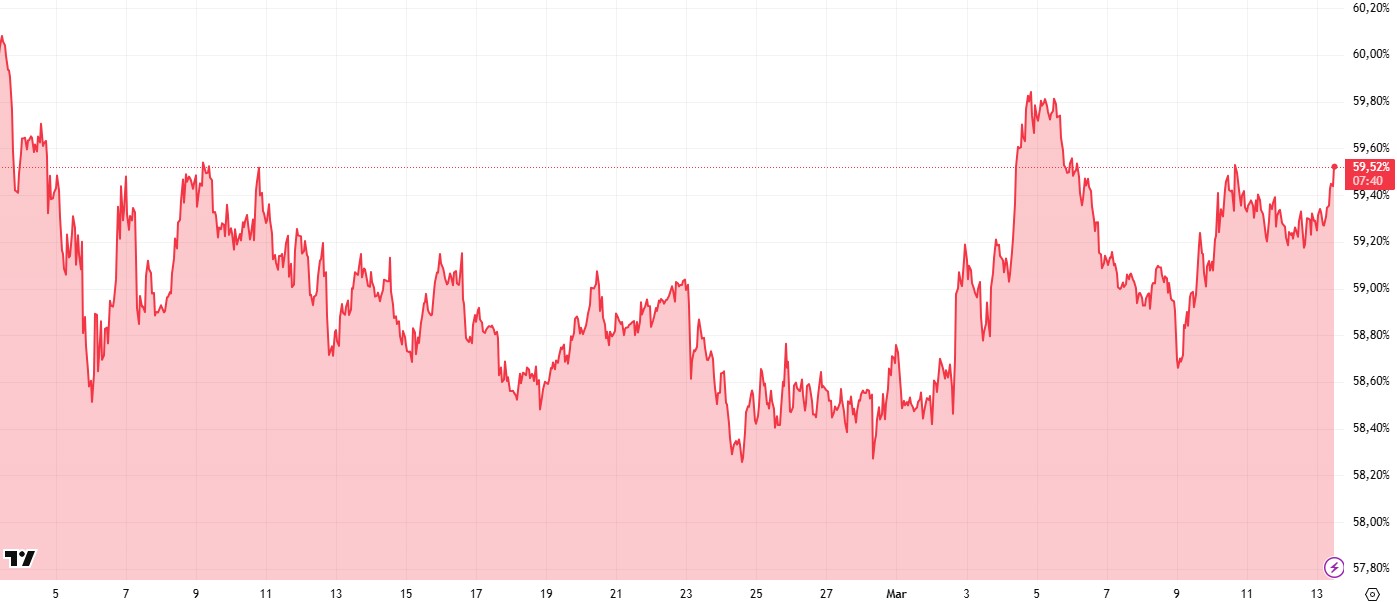
Source: Tradingview
Weekly Change
- Last Week’s Level: 59.36%
- This Week’s Level: 59.52%
Bitcoin dominance started the week in the approximately 59.30%–59.40% range. In the first part of the week, a gradual pullback in dominance was observed, with the ratio retreating to the 58.30%–58.40% range. Although altcoins experienced a brief recovery during this decline, the fact that dominance could not sustain a drop below the 58.30% level indicated that selling pressure remained limited.
As Bitcoin regained strength toward the second half of the week, market dominance responded with an upward move. Particularly with the acceleration in activity starting from mid-week, dominance rose above the 59% level again and briefly climbed as high as 59.80%, testing the week’s highest range. Although a limited pullback occurred following this rise, dominance rebounded again in the final stretch of the week and currently stands at approximately 59.50%.
On the institutional side, the presence of companies continuing their Bitcoin accumulation strategy, as seen in previous weeks, continues to draw attention. However, it appears that broader new treasury purchases have not yet gained momentum, and institutional investors are adopting a cautious approach at current price levels.
When evaluating the overall picture, Bitcoin dominance rebounded strongly from the 58% range during the week to approach the 59.50% level again, indicating that a significant portion of market liquidity remains in Bitcoin. In the altcoin market, while occasional recovery attempts are observed, it is notable that these movements are not yet strong enough to pull dominance down. Technically, the 58% level maintains its position as a key support, while the 60%–61% range continues to act as a strong resistance zone. If the current structure holds, Bitcoin dominance is expected to continue fluctuating within the 58%–61% range in the short term.
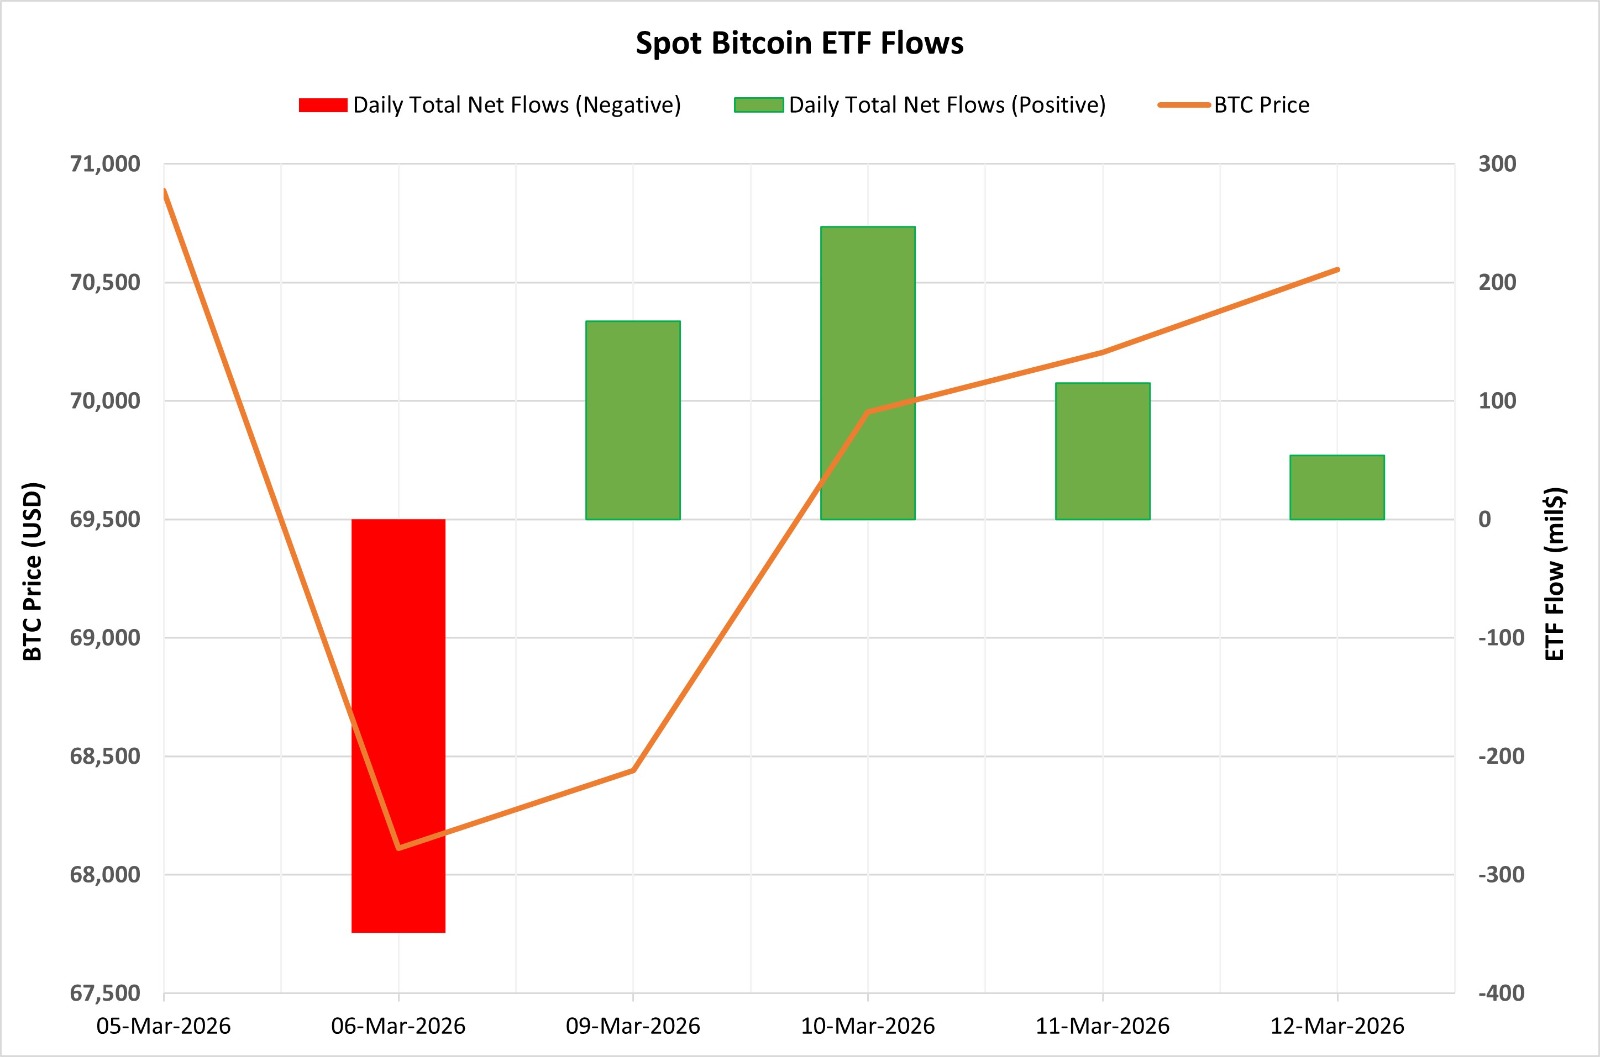
Bitcoin Spot ETF
Source: Darkex Research Department
Between March 6–12, 2026, Spot Bitcoin ETFs saw a total net inflow of $234.1 million. Despite a strong net outflow of $348.9 million on the first trading day of the week, consecutive inflows over the following four trading days turned the total flow positive. Looking at the funds individually, BlackRock IBIT stood out with a net inflow of $313 million, while Fidelity FBTC saw a net outflow of $34.2 million. With these developments, the cumulative total net inflow of Spot Bitcoin ETFs rose to $55.93 billion by the end of the 541st trading day.
| Date | Coin | Price | ETF Flow (mil$) | ||
|---|---|---|---|---|---|
| Open | Close | Change % | |||
| March 6, 2026 | BTC | 70,887 | 68,111 | -3.92% | -348.9 |
| March 9, 2026 | 65,972 | 68,441 | 3.74% | 167.1 | |
| March 10, 2026 | 68,441 | 69,953 | 2.21% | 246.9 | |
| March 11, 2026 | 69,953 | 70,205 | 0.36% | 115.2 | |
| March 12, 2026 | 70,205 | 70,554 | 0.50% | 53.8 | |
| Total for Mar 6–12, 2026 | -0.47% | 234.10 | |||
On the price front, Bitcoin opened at $70,887 on March 6 and closed at $70,554 on March 12. During this period, the BTC price recorded a limited decline of 0.47%. The 3.92% drop seen on the first day of the week coincided with strong outflows from ETFs. However, a gradual recovery in price was observed in the following days alongside consecutive ETF inflows. Overall, this period revealed a scenario where ETF flows and price movements partially diverged. Nevertheless, the resumption of strong inflows into ETFs indicates that institutional demand has not completely weakened. If ETF inflows continue steadily in the coming days, upward momentum in the Bitcoin price could gain strength. Otherwise, if inflows weaken again, the price could remain volatile and fragile.
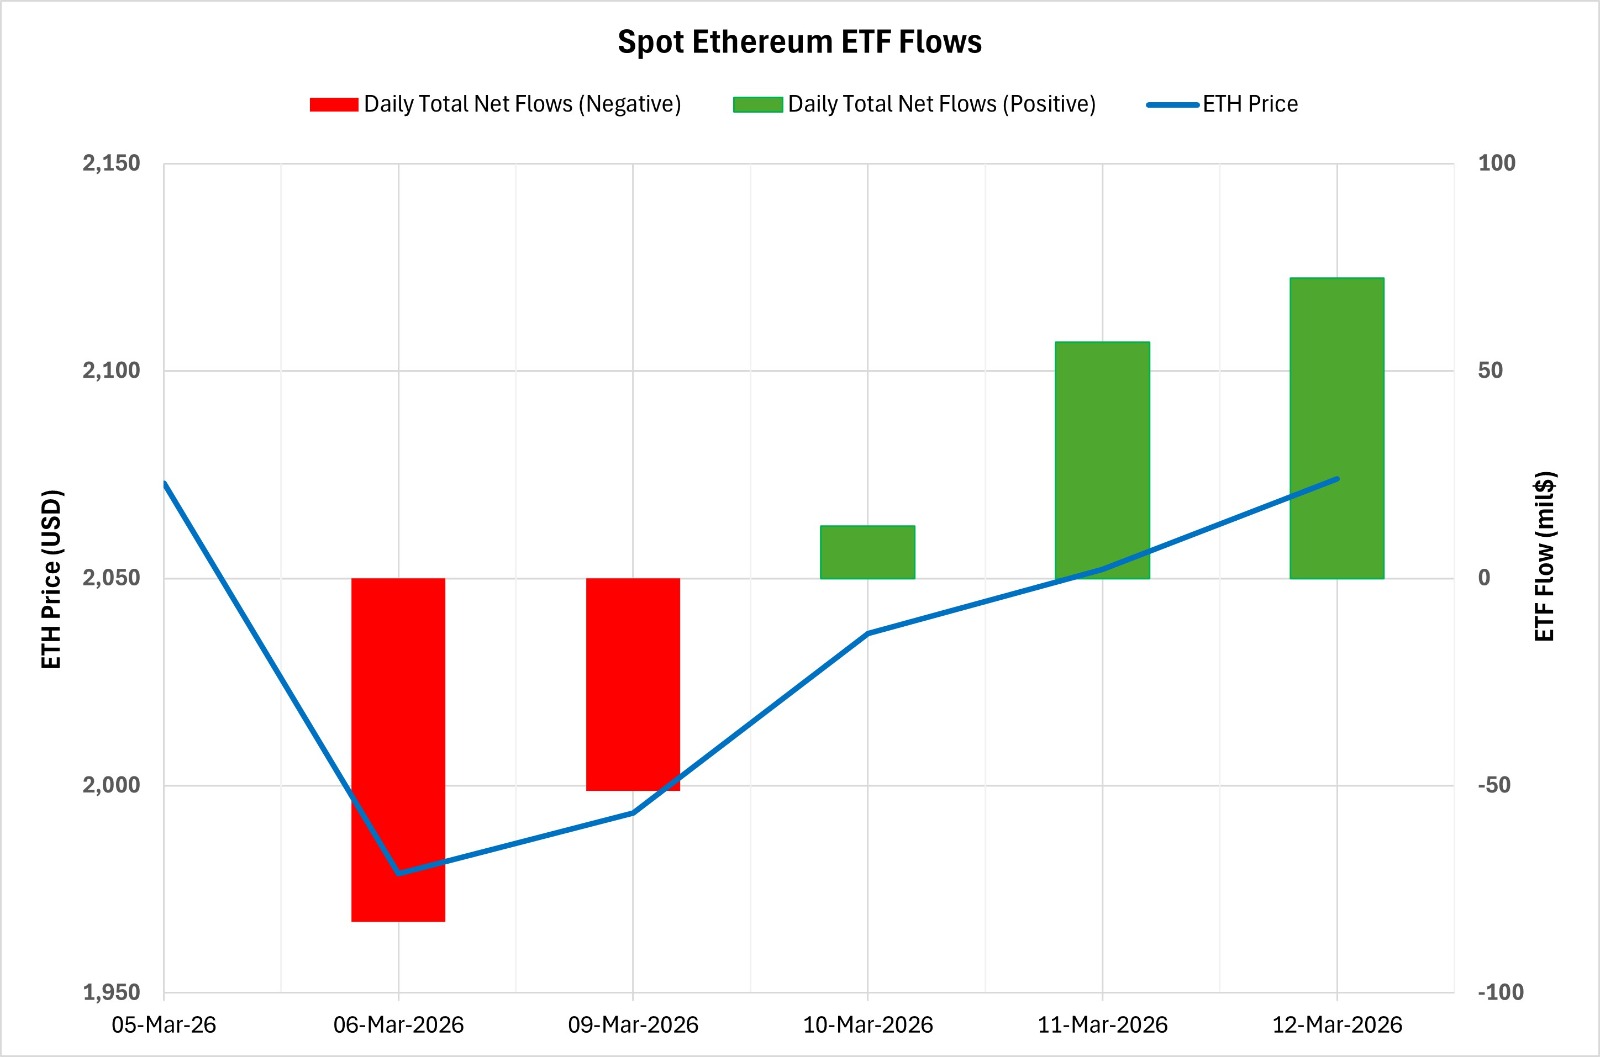
Spot Ethereum ETF
Source: Darkex Research Department
“Image titled ‘ETH ETF’ to be added”
Between March 6 and 12, 2026, Spot Ethereum ETFs saw a total of $7.8 million in net inflows. Although strong outflows of $82.9 million and $51.3 million were observed on the first two trading days of the week, gradual inflows over the next three trading days turned the total flow positive. Looking at individual funds, Fidelity’s FETH saw a net inflow of $30.4 million, while BlackRock’s ETHA recorded a net outflow of $22.4 million. With these developments, the cumulative total net inflow for Spot Ethereum ETFs rose to $11.74 billion by the end of the 411th trading day.
| Date | Coin | Open | Close | Change % | ETF Flow (Million $) |
|---|---|---|---|---|---|
| March 6, 2026 | ETH | 2,073 | 1,979 | -4.54% | -82.9 |
| March 9, 2026 | 1,937 | 1,993 | 2.91% | -51.3 | |
| March 10, 2026 | 1,993 | 2,037 | 2.17% | 12.6 | |
| March 11, 2026 | 2,037 | 2,052 | 0.76% | 57 | |
| March 12, 2026 | 2,052 | 2,074 | 1.06% | 72.4 | |
| Total for March 6–12, 2026 | 0.05% | 7.8 |
On the price front, Ethereum opened at $2,073 on March 6 and closed at $2,074 on March 12. During this period, the ETH price recorded a very limited increase of 0.05%. While the 4.54% drop seen on the first day of the week increased pressure on the price, the recovery movement observed in the second half of the week offset this loss. In particular, the fact that both the price and ETF inflows trended positively during the March 10–12 period generated a short-term recovery signal. Overall, this period presented a picture of directionless but balanced trends in ETF flows. If stronger and more stable inflows materialize on the ETF side, the recovery movement in the Ethereum price could gain a firmer footing. However, if flows turn negative again, recovery attempts on the price side may remain limited, and market volatility could persist.
Legal Notice
The investment information, comments, and recommendations contained in this document do not constitute investment advisory services. Investment advisory services are provided by authorized institutions on an individual basis, taking into account the risk and return preferences of each client. The comments and recommendations contained in this document are of a general nature. These recommendations may not be suitable for your financial situation and risk and return preferences. Therefore, making an investment decision based solely on the information contained in this document may not result in outcomes that align with your expectations.
