
Active Addresses
Active Receiving Addresses
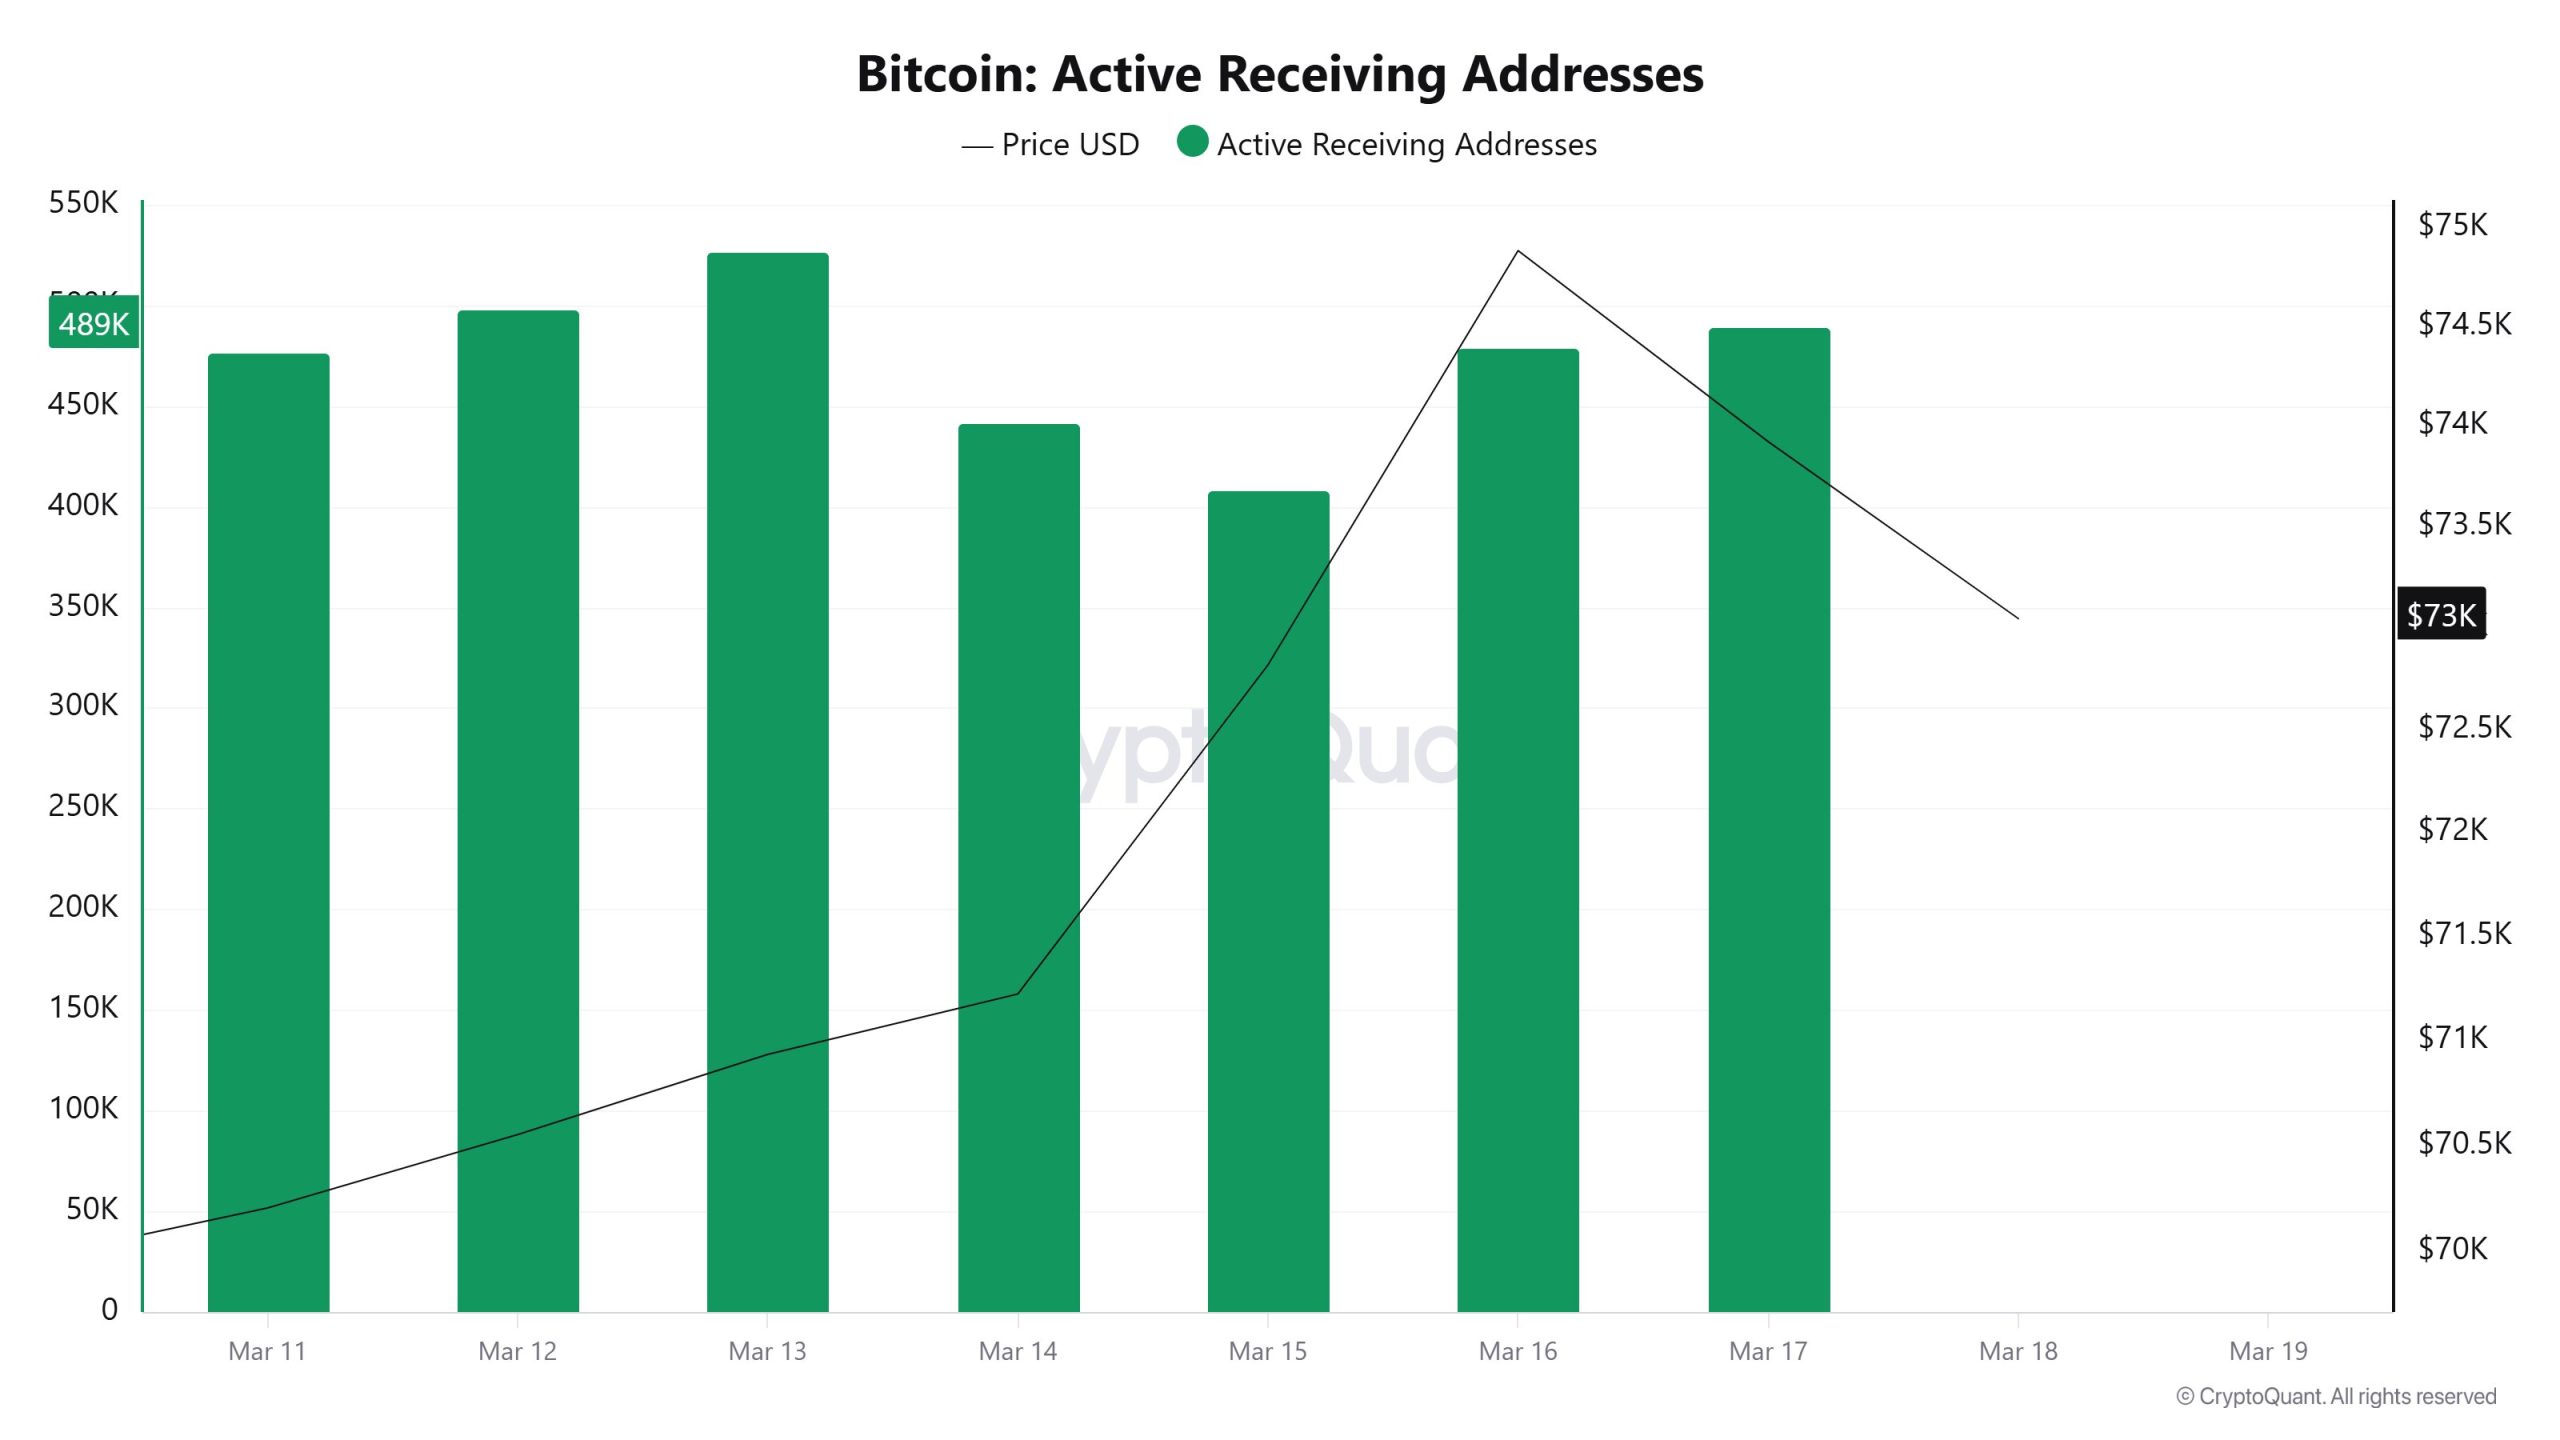
During the period from March 11 to March 17, the number of active receiving addresses on the Bitcoin network fluctuated throughout the week. The metric, which stood at approximately 470,000 at the start of the week, rose to 520,000 by March 13. A decline followed, and it fell to around 405,000 by March 15. Toward the end of the week, it rebounded, reaching the 480,000–490,000 range. This pattern indicates a temporary slowdown on the receiving side of the network midweek, followed by a resurgence in activity. Overall, there is no significant deterioration in demand.
Active Sending Addresses
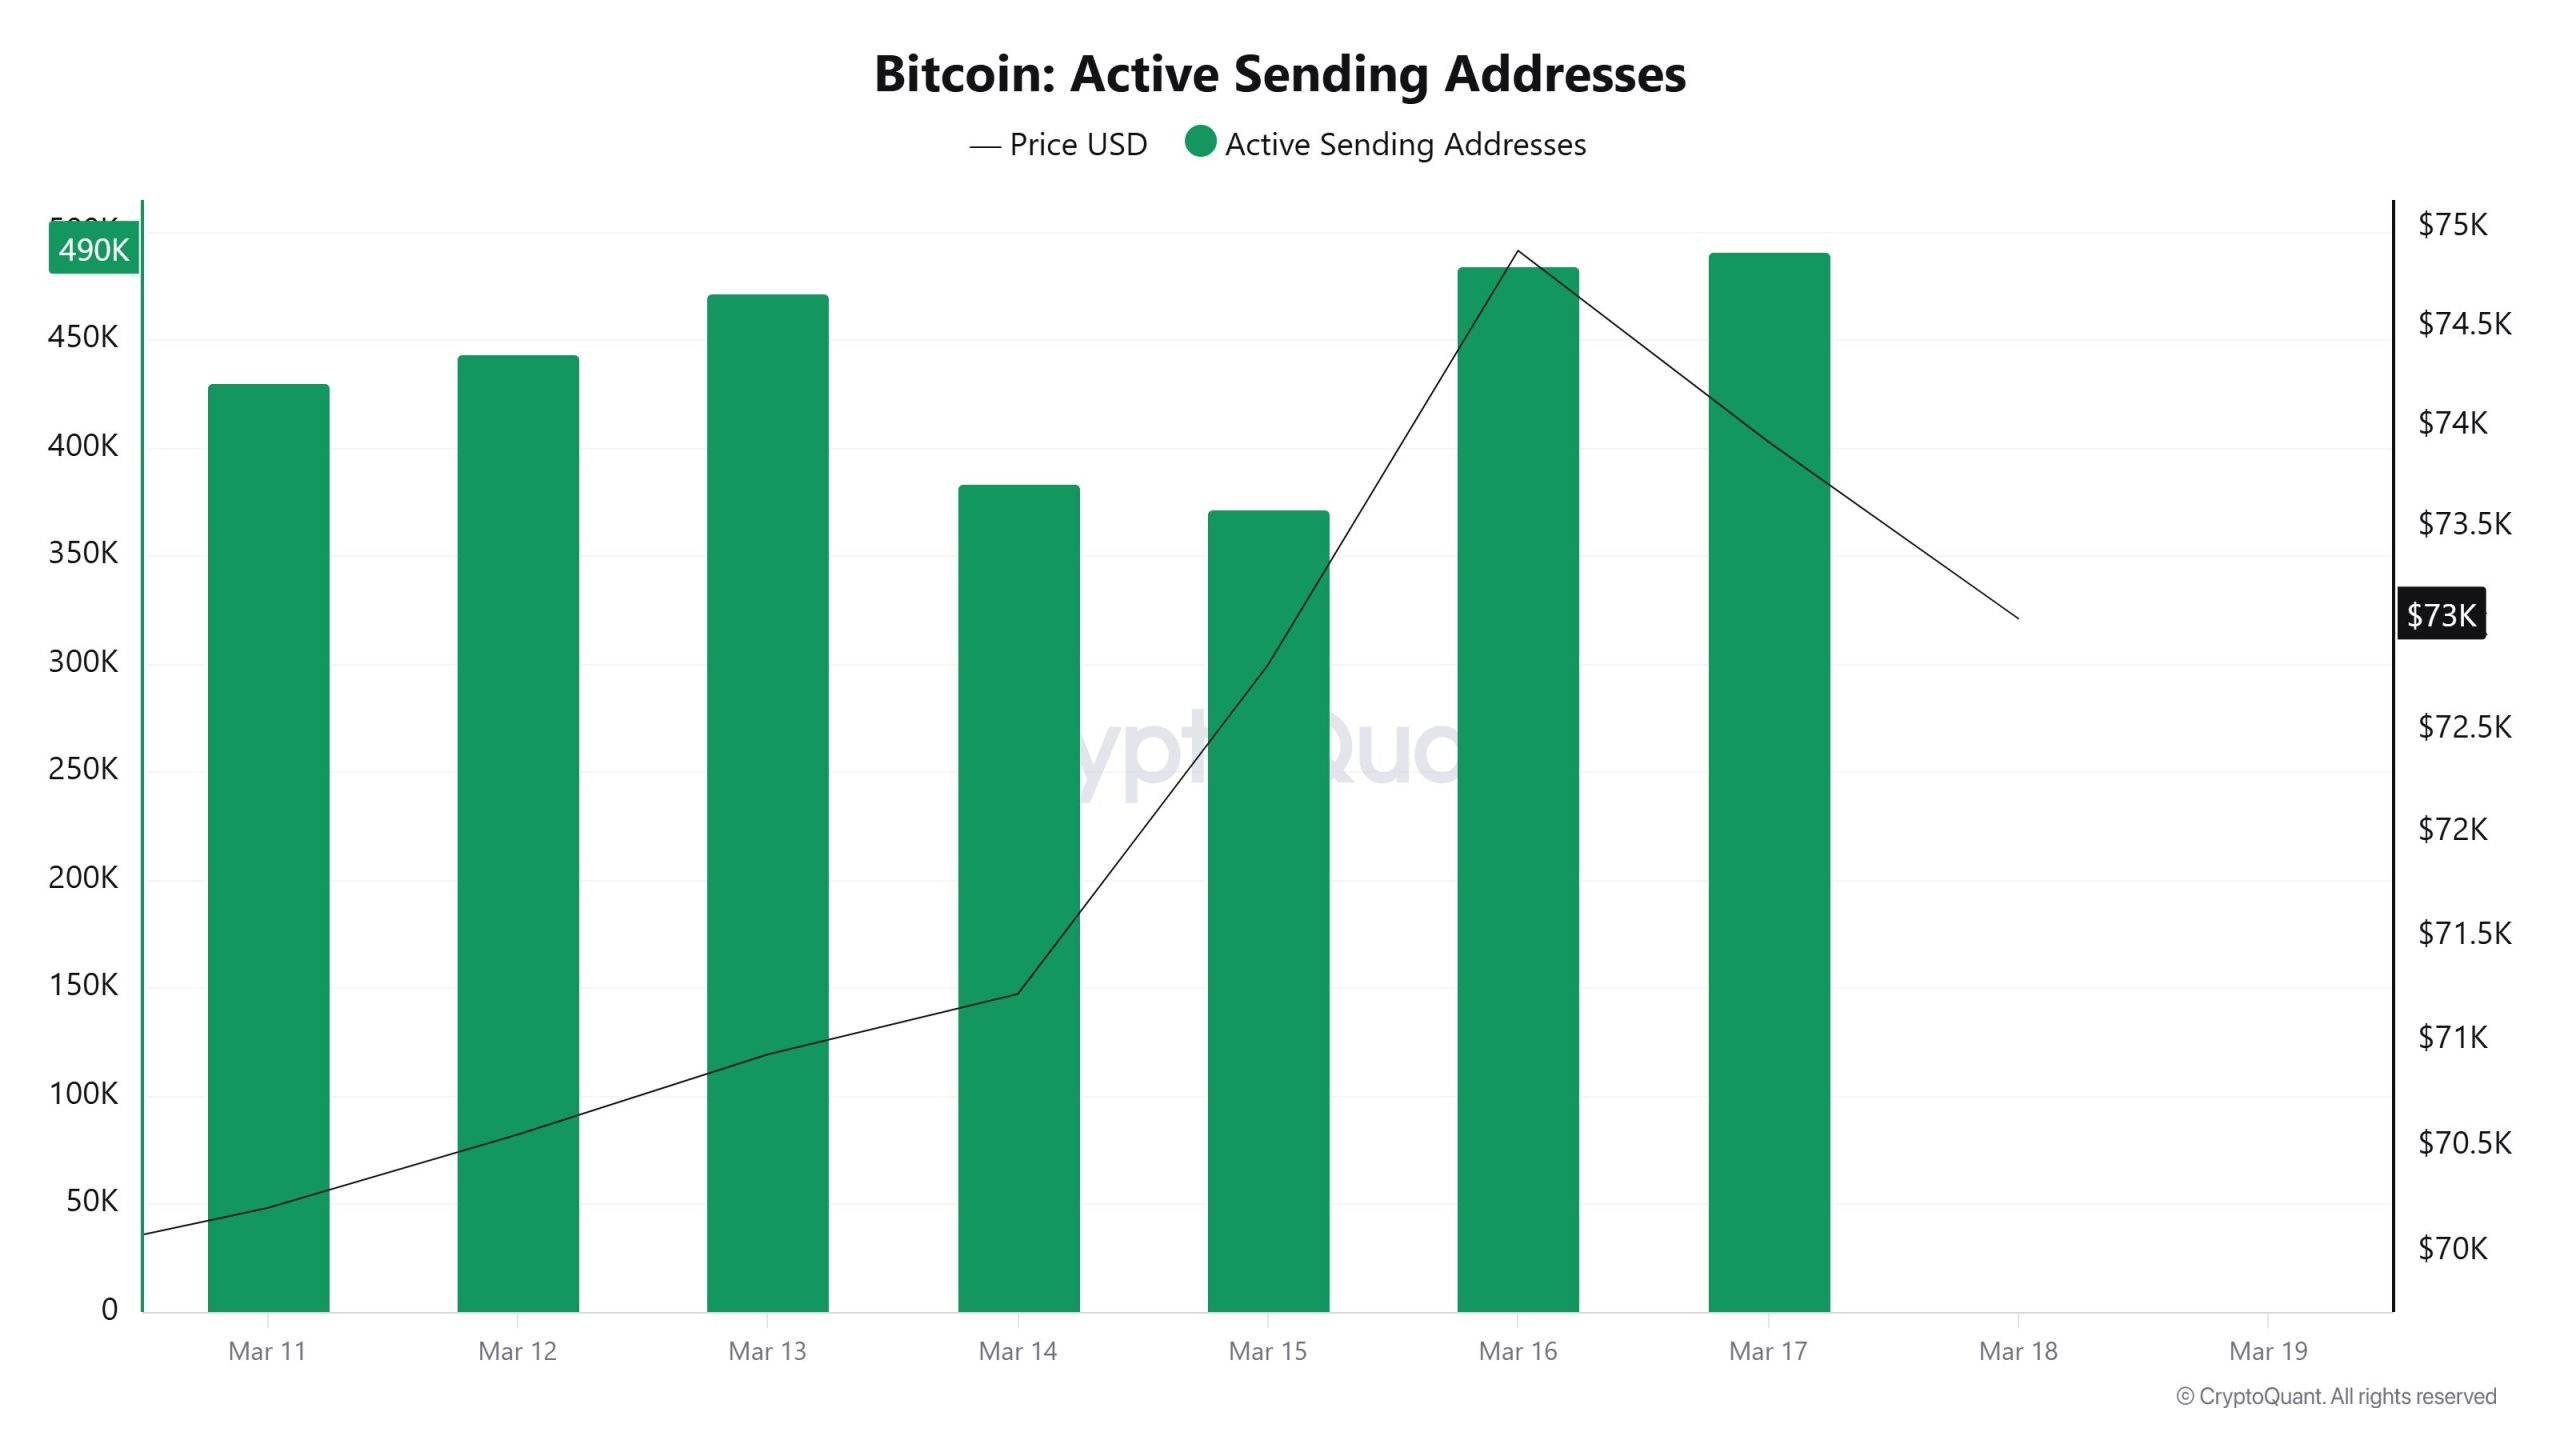
The number of active sending addresses followed a similar pattern throughout the week. The metric stood at approximately 425,000 at the start of the week. It rose to 470,000 on March 13, then dropped to the 370,000–380,000 range on March 14 and 15. In the following days, it regained strength, approaching the 490,000 level. This movement indicates that transfer and sales-oriented transactions on the network decreased in the middle of the week and then picked up again. In particular, the recovery seen in both sending and receiving data toward the end of the week suggests that network activity is picking up again.
Breakdowns
MVRV
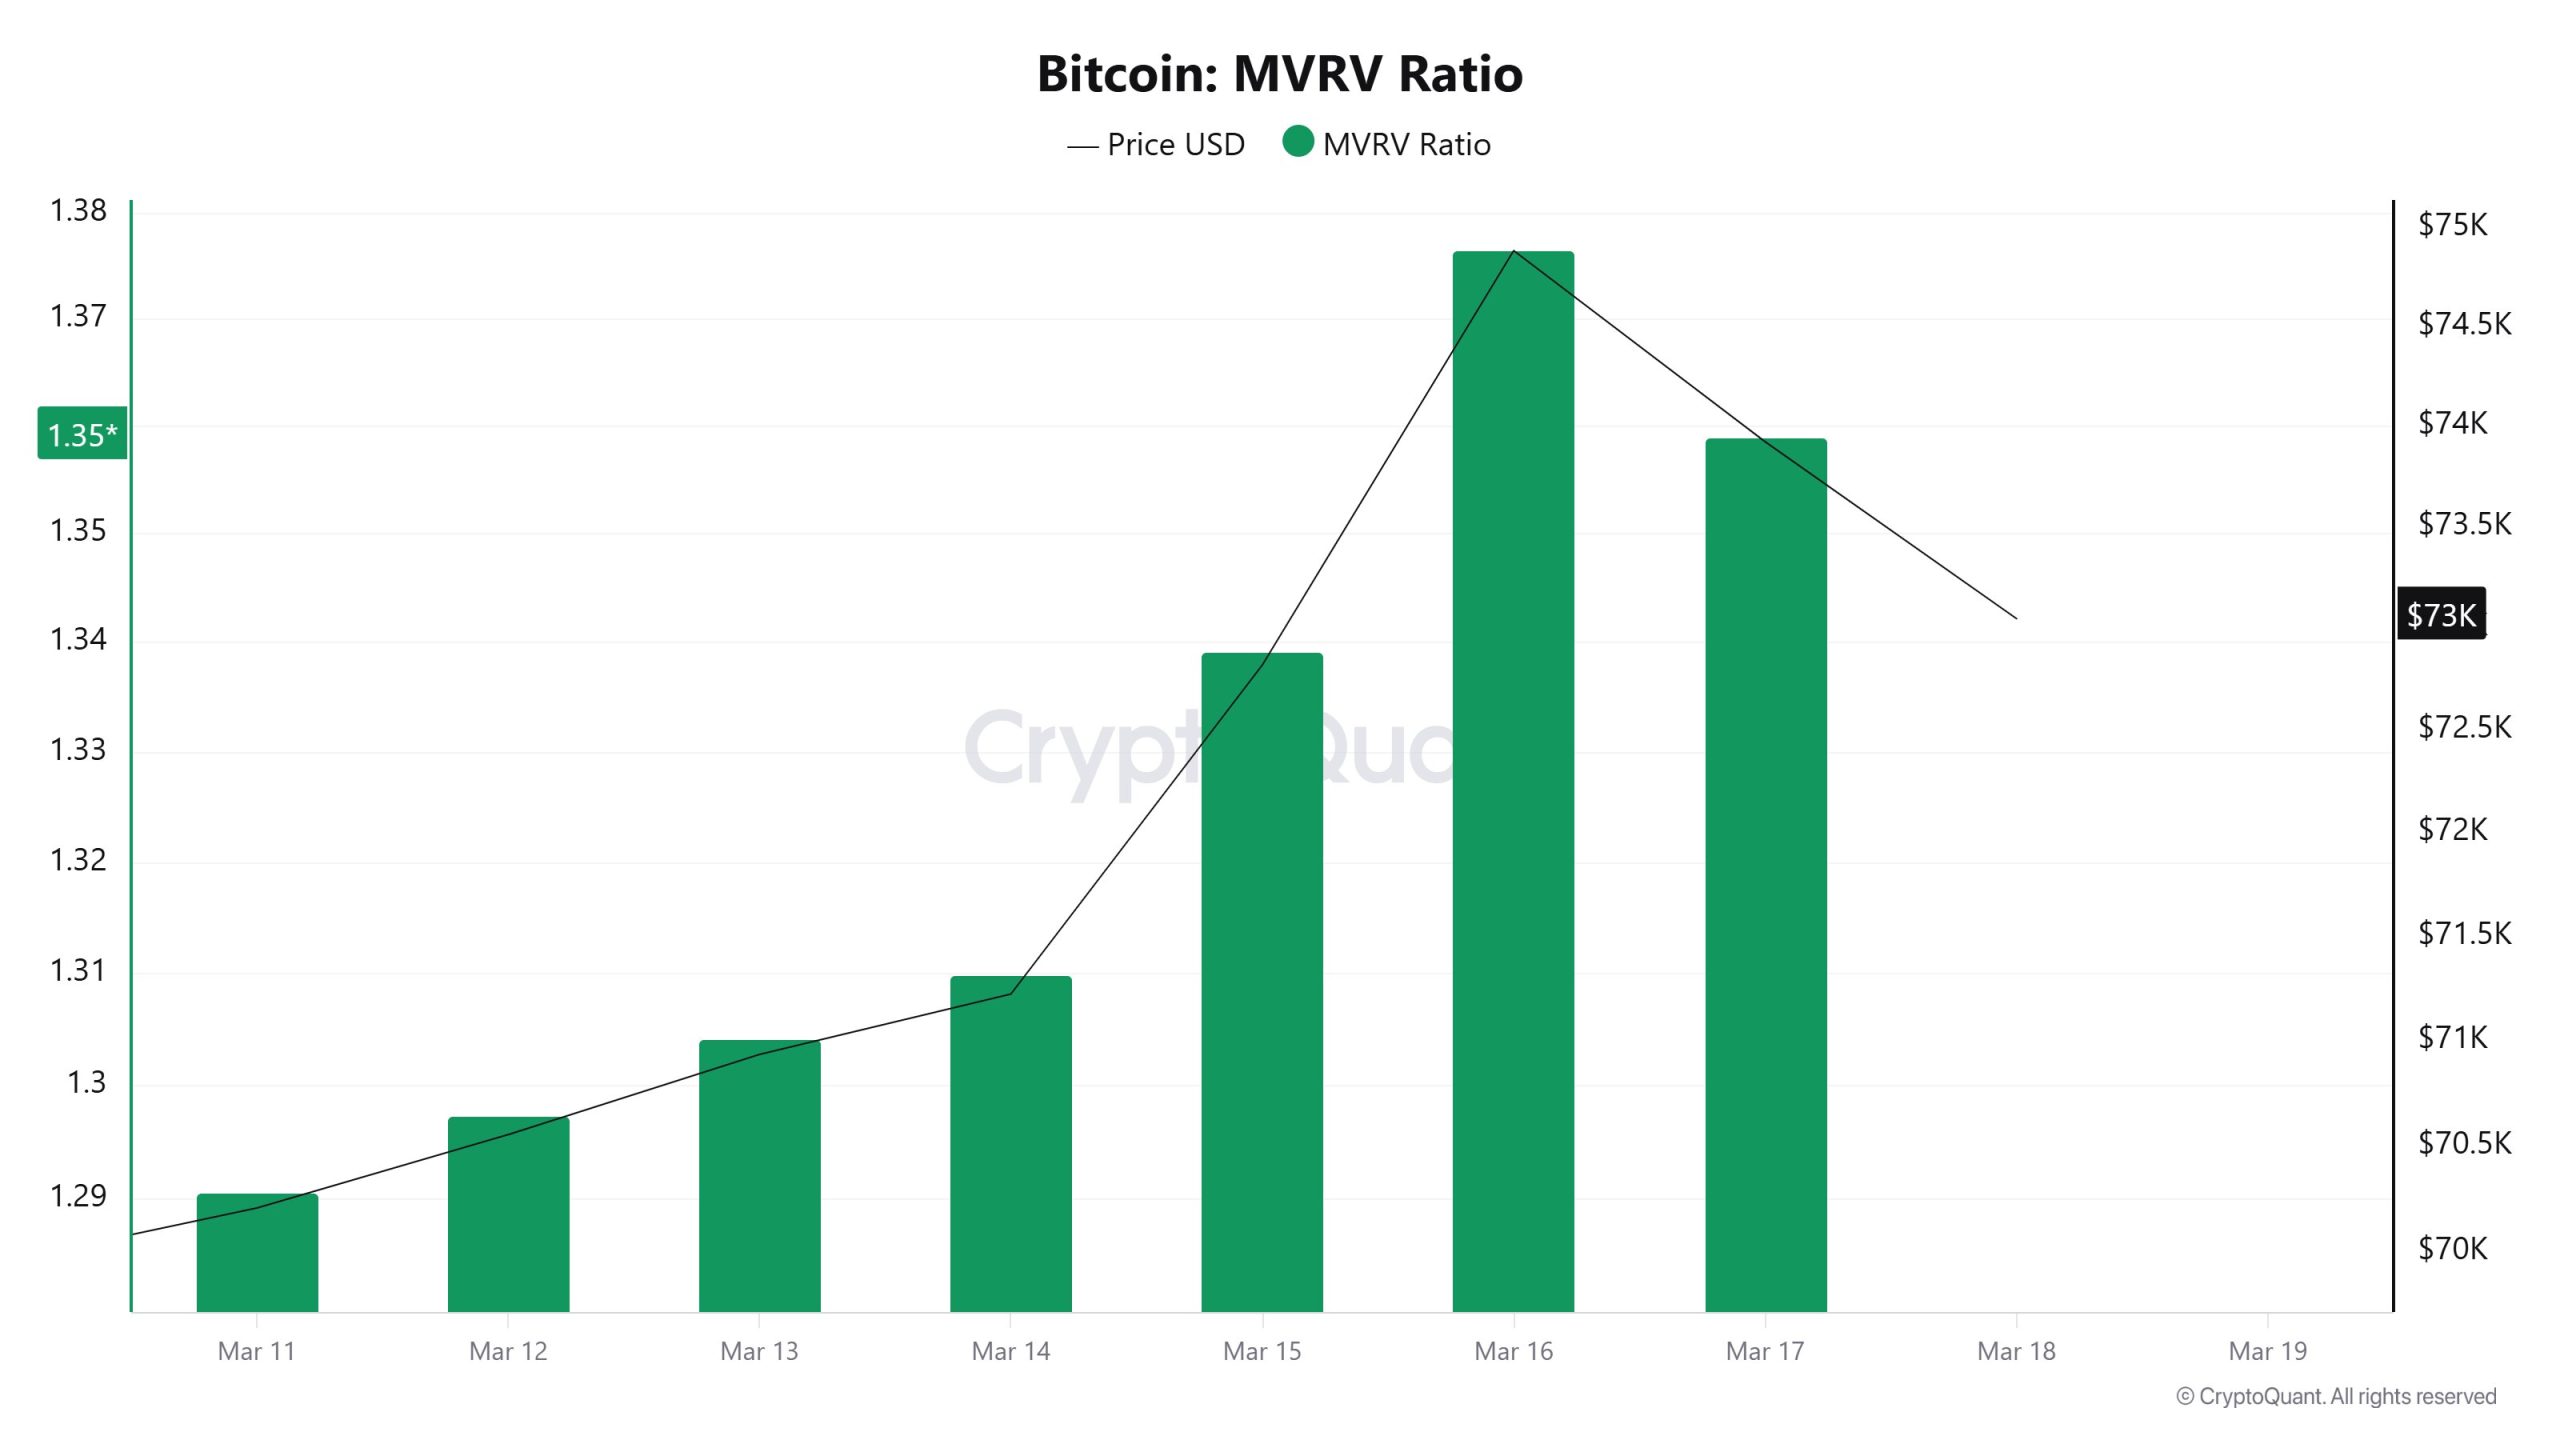
The MVRV Ratio followed an upward trend this week. The metric, which stood at approximately 1.29 at the start of the week, rose as the days progressed, reaching 1.37 by March 16. Although there was a slight pullback toward the end of the week, the indicator remained around 1.35. This suggests that, on average, investors are in profit. However, the current level does not yet signal an overly inflated market structure. In other words, while profitability has increased, the market does not yet appear to be overheated.
Spent Output Profit Ratio (SOPR)
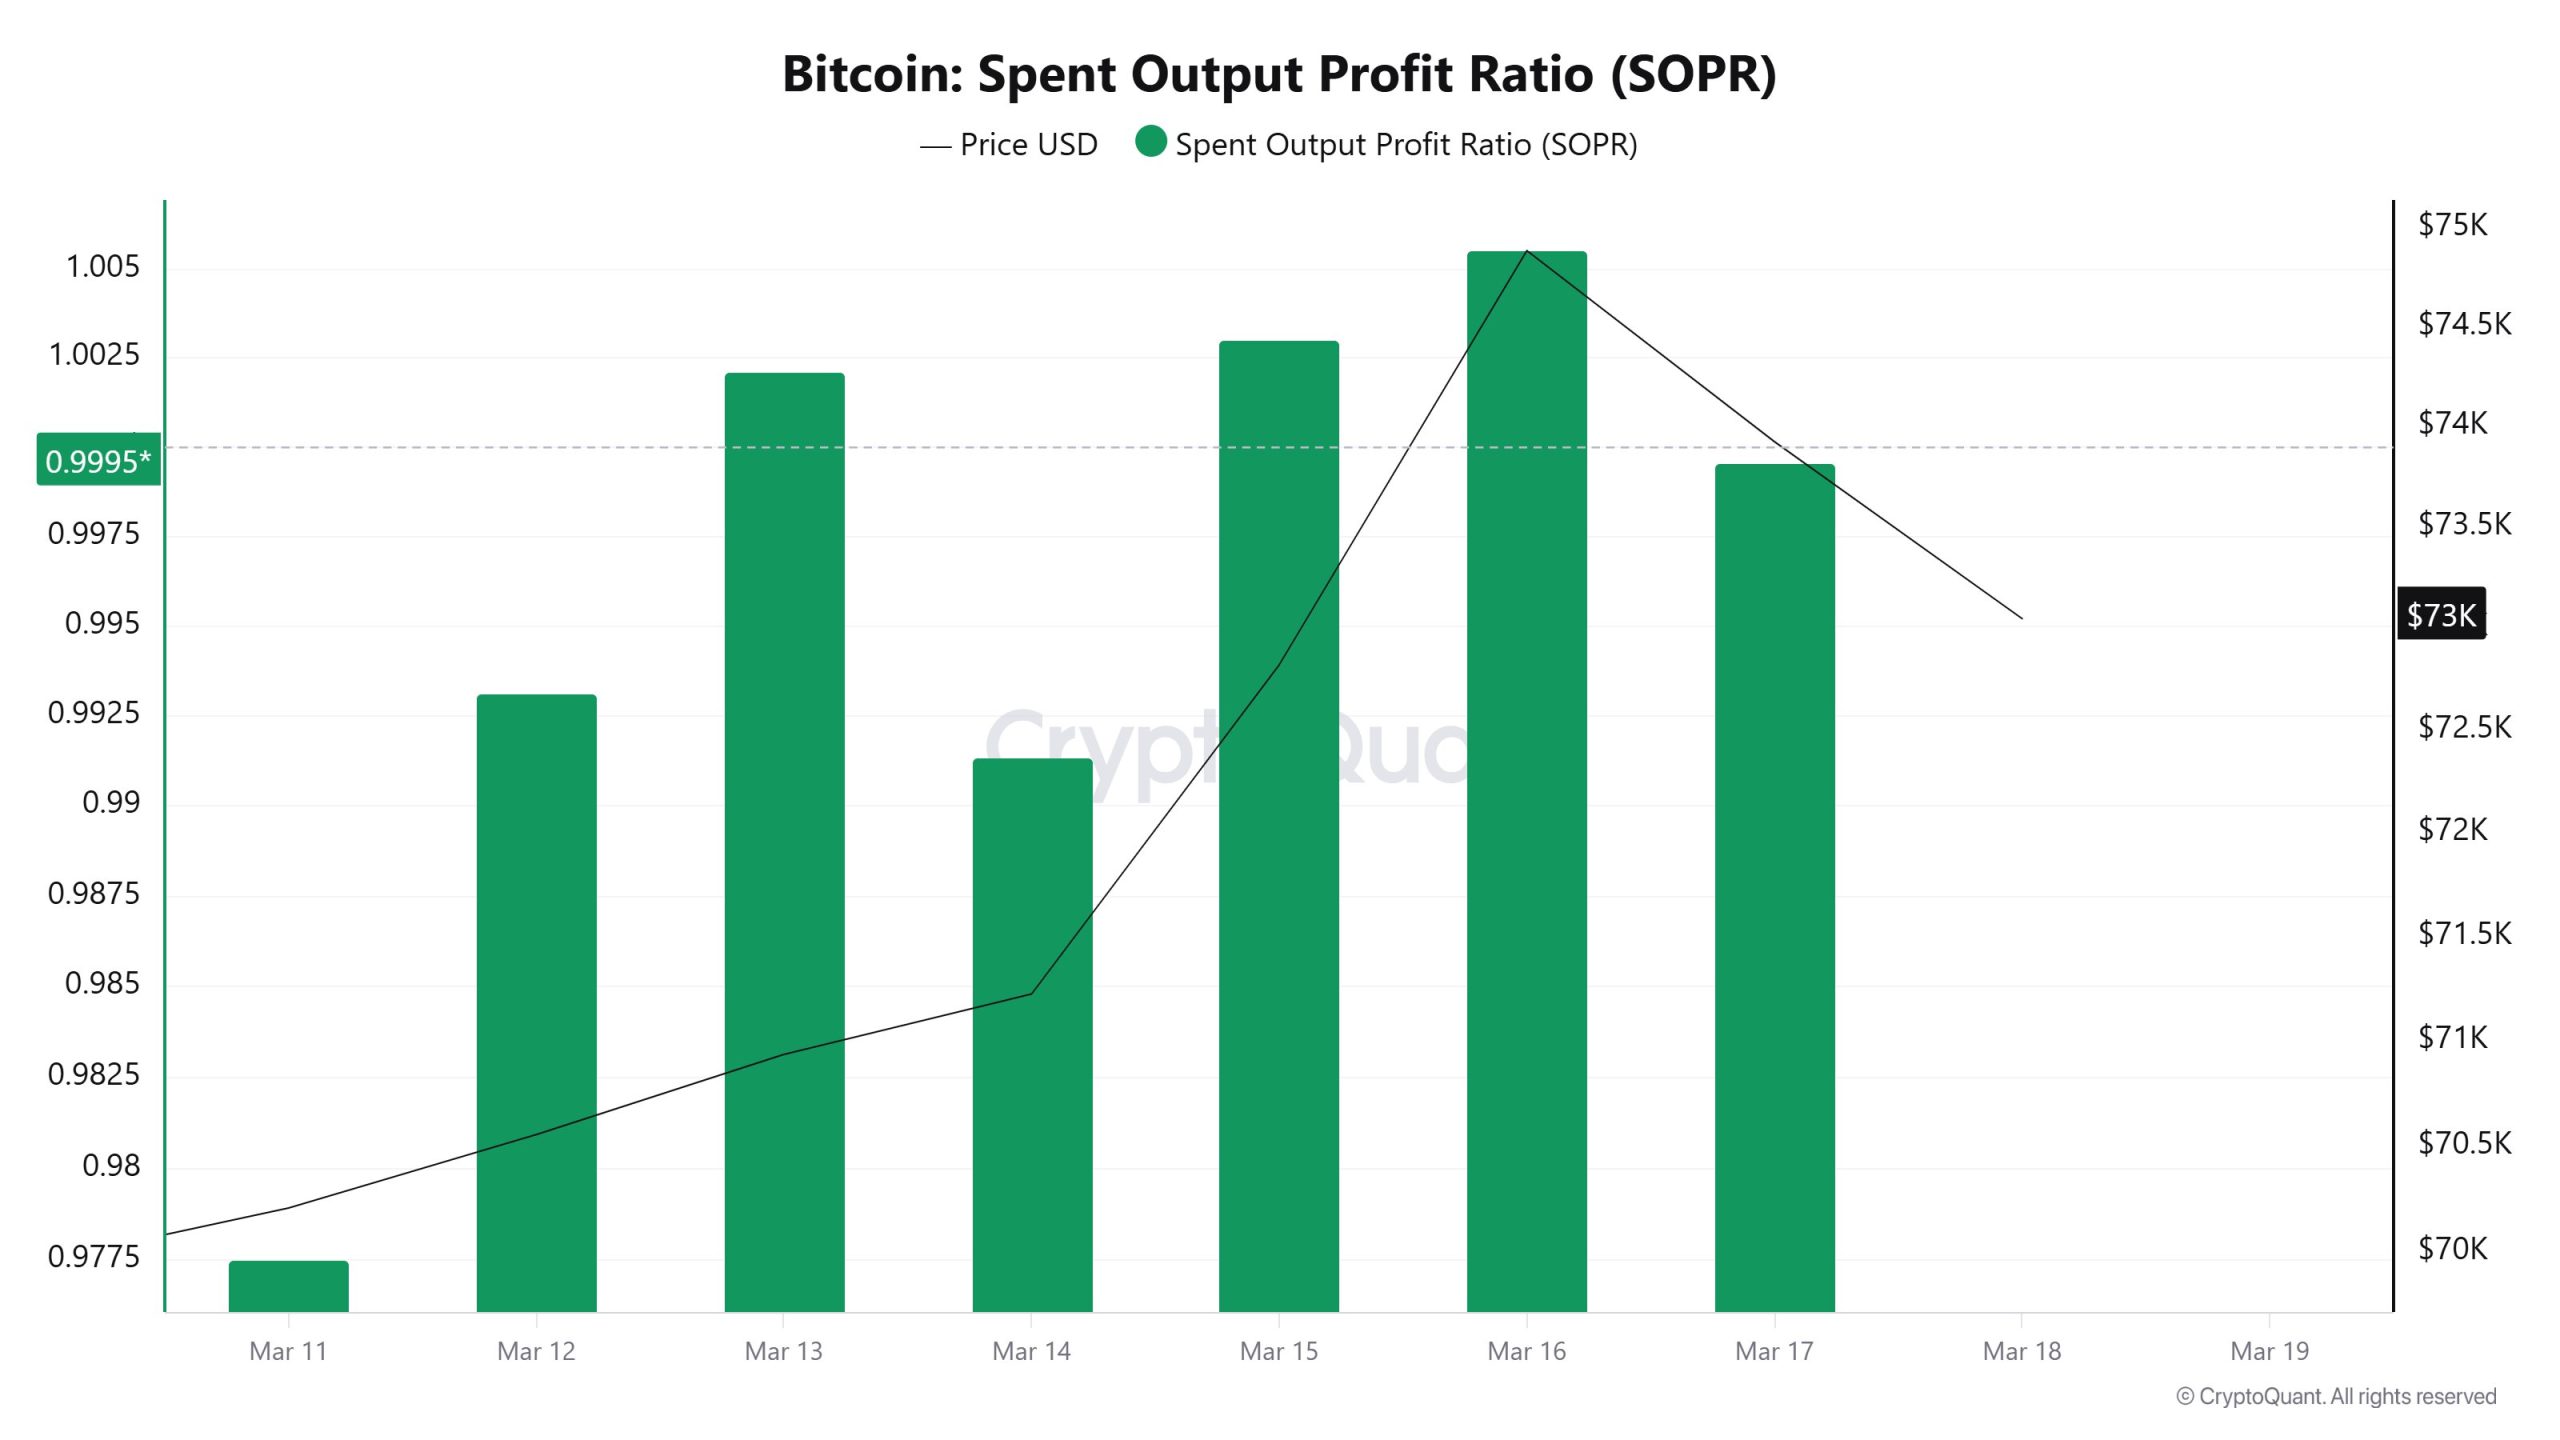
The SOPR data remained below the 1 level at the start of the week. The metric, which stood at approximately 0.977 on March 11, recovered in the following days and mostly approached or slightly exceeded the 1 level starting March 13. Its rise above the 1.005 level on March 16 was notable. By the end of the week, it was seen converging back toward the 1 level. This pattern suggests that loss-making transactions dominated the network at the start of the week, but as prices recovered, profitable transactions began to increase again. The fact that the SOPR stabilized around 1 toward the end of the week suggests that a more cautious yet healthier market structure is emerging.
Derivatives
Open Interest
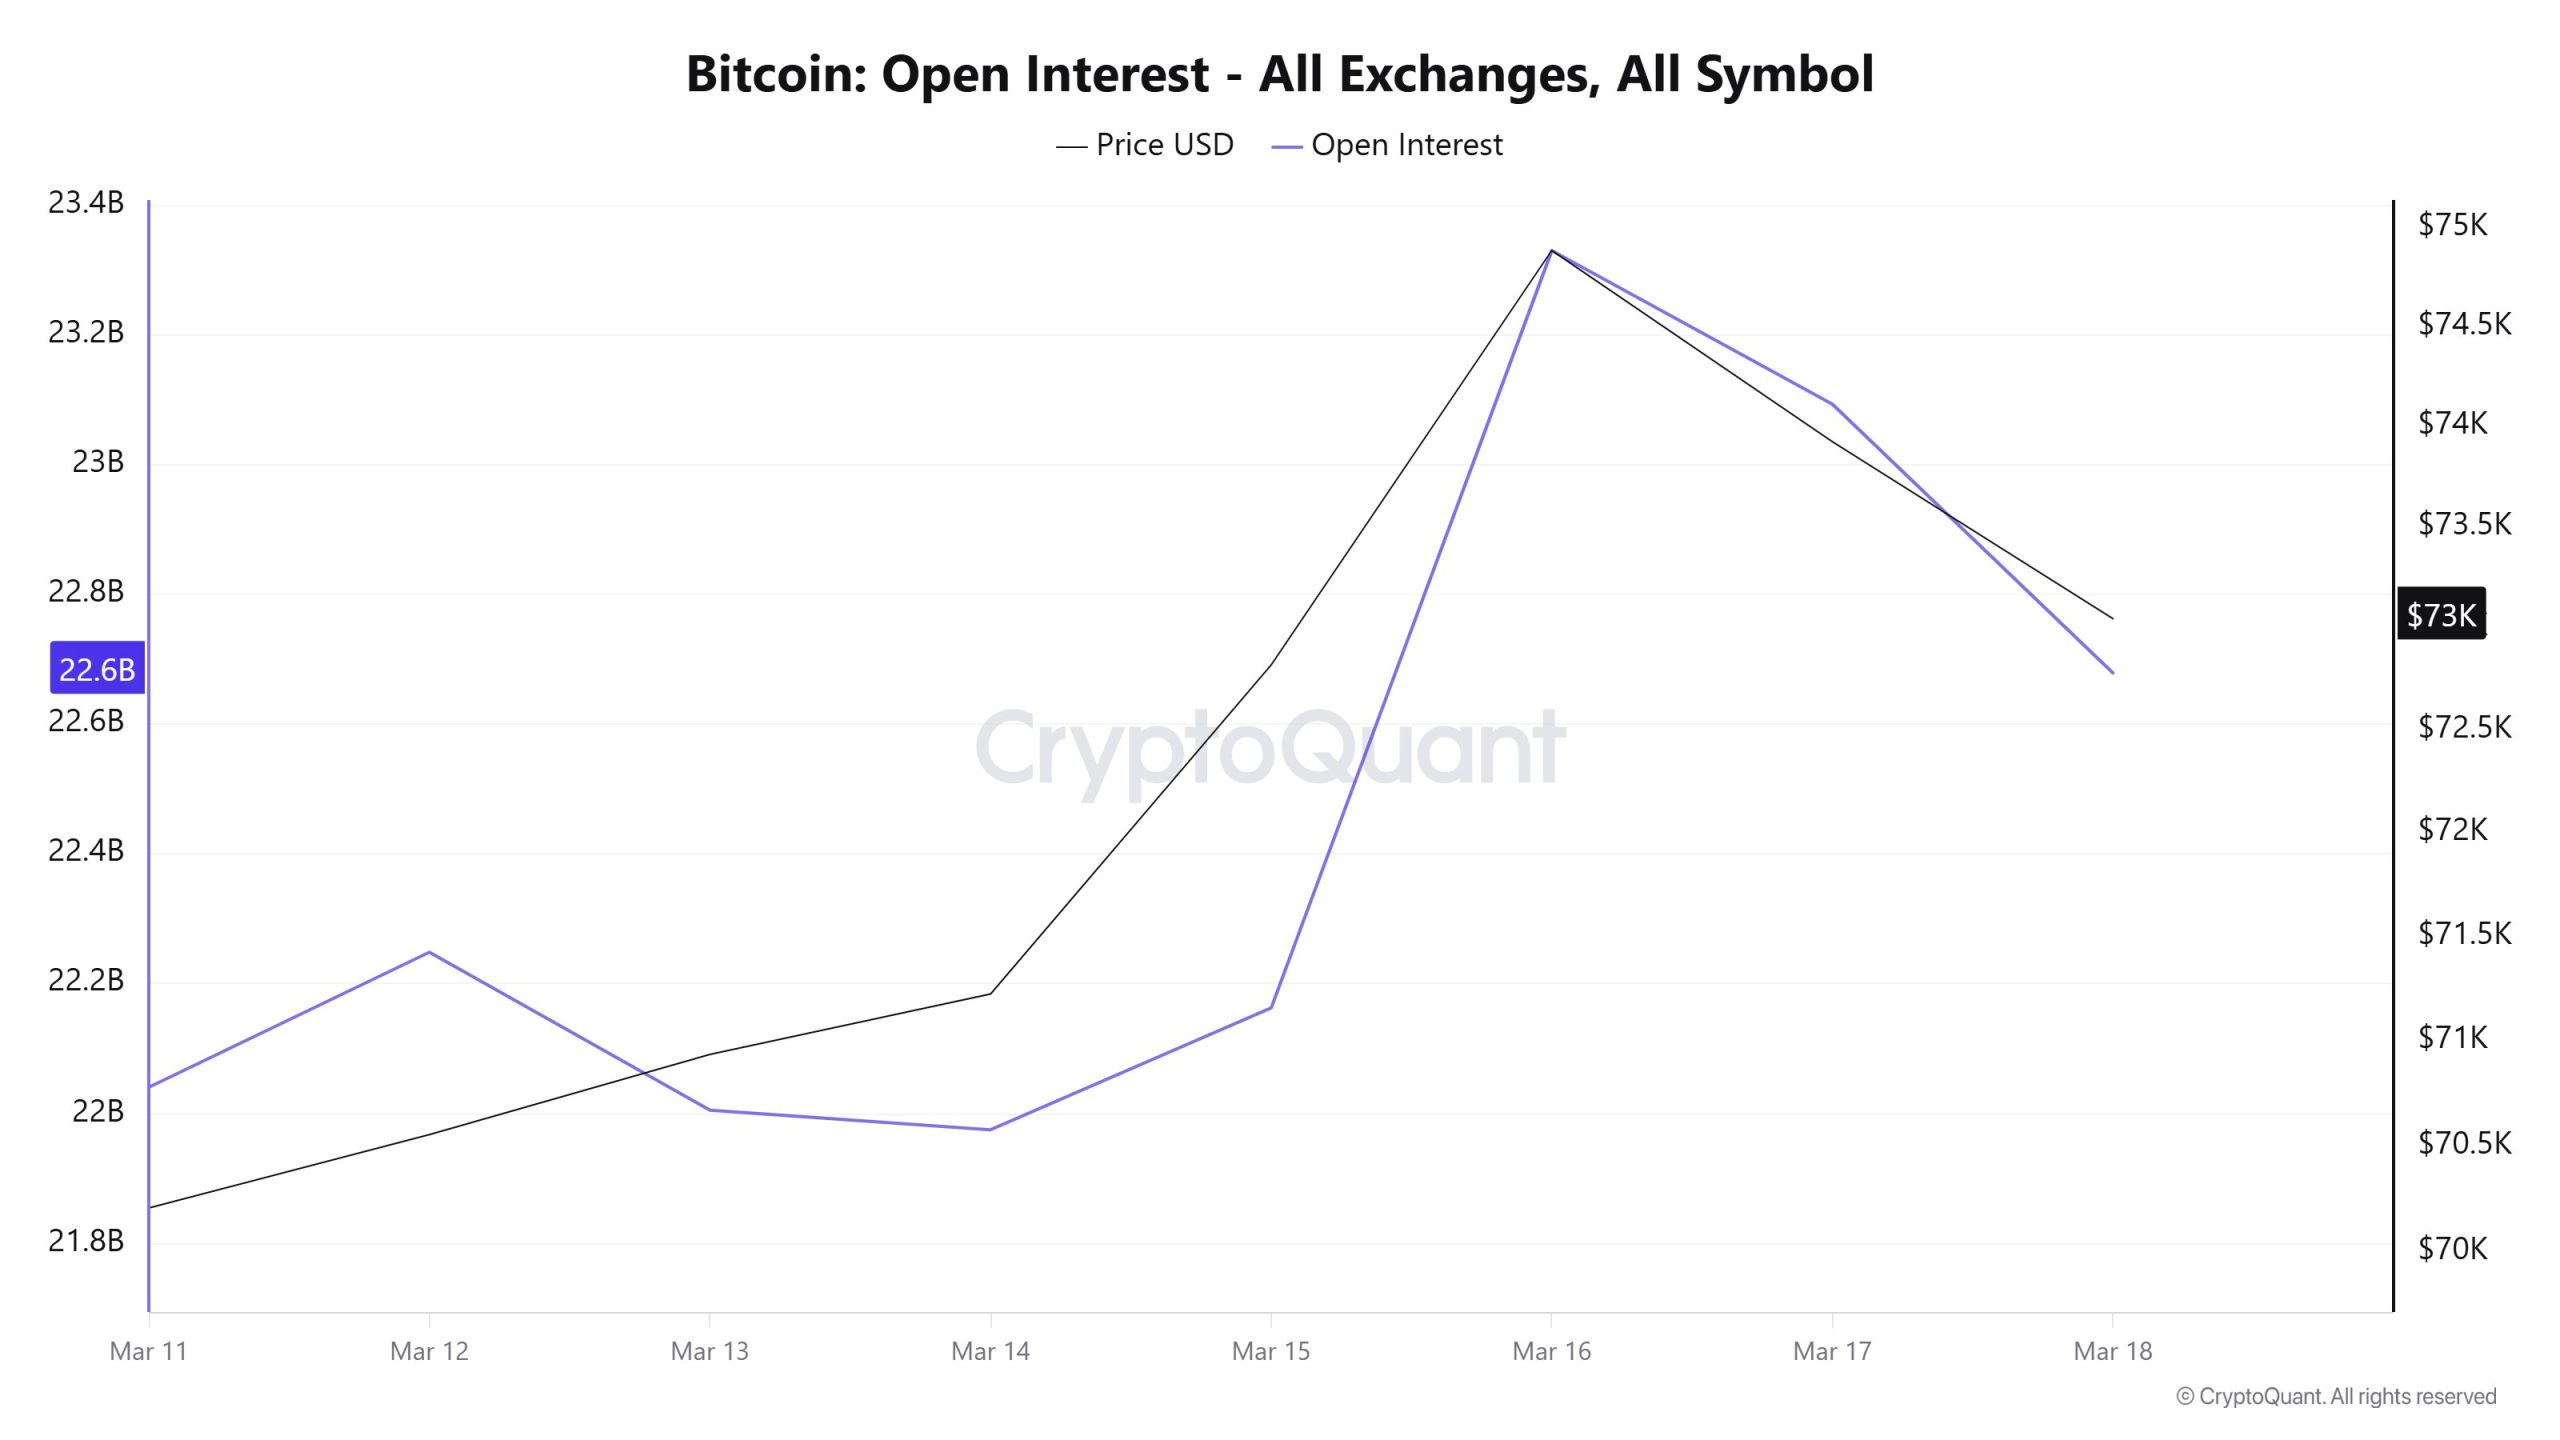
Open Interest data generally rose throughout the week. The metric, which stood at approximately $22.0 billion at the start of the week, reached around $23.3 billion on March 16. Although there was a slight pullback afterward, the open interest volume remained at the $22.6 billion level. This increase indicates that new positions continue to enter the futures markets as prices rise. While the pullback toward the end of the week suggests that some positions were closed, the fact that the overall level remains high demonstrates that interest in the derivatives market persists.
Funding Rate
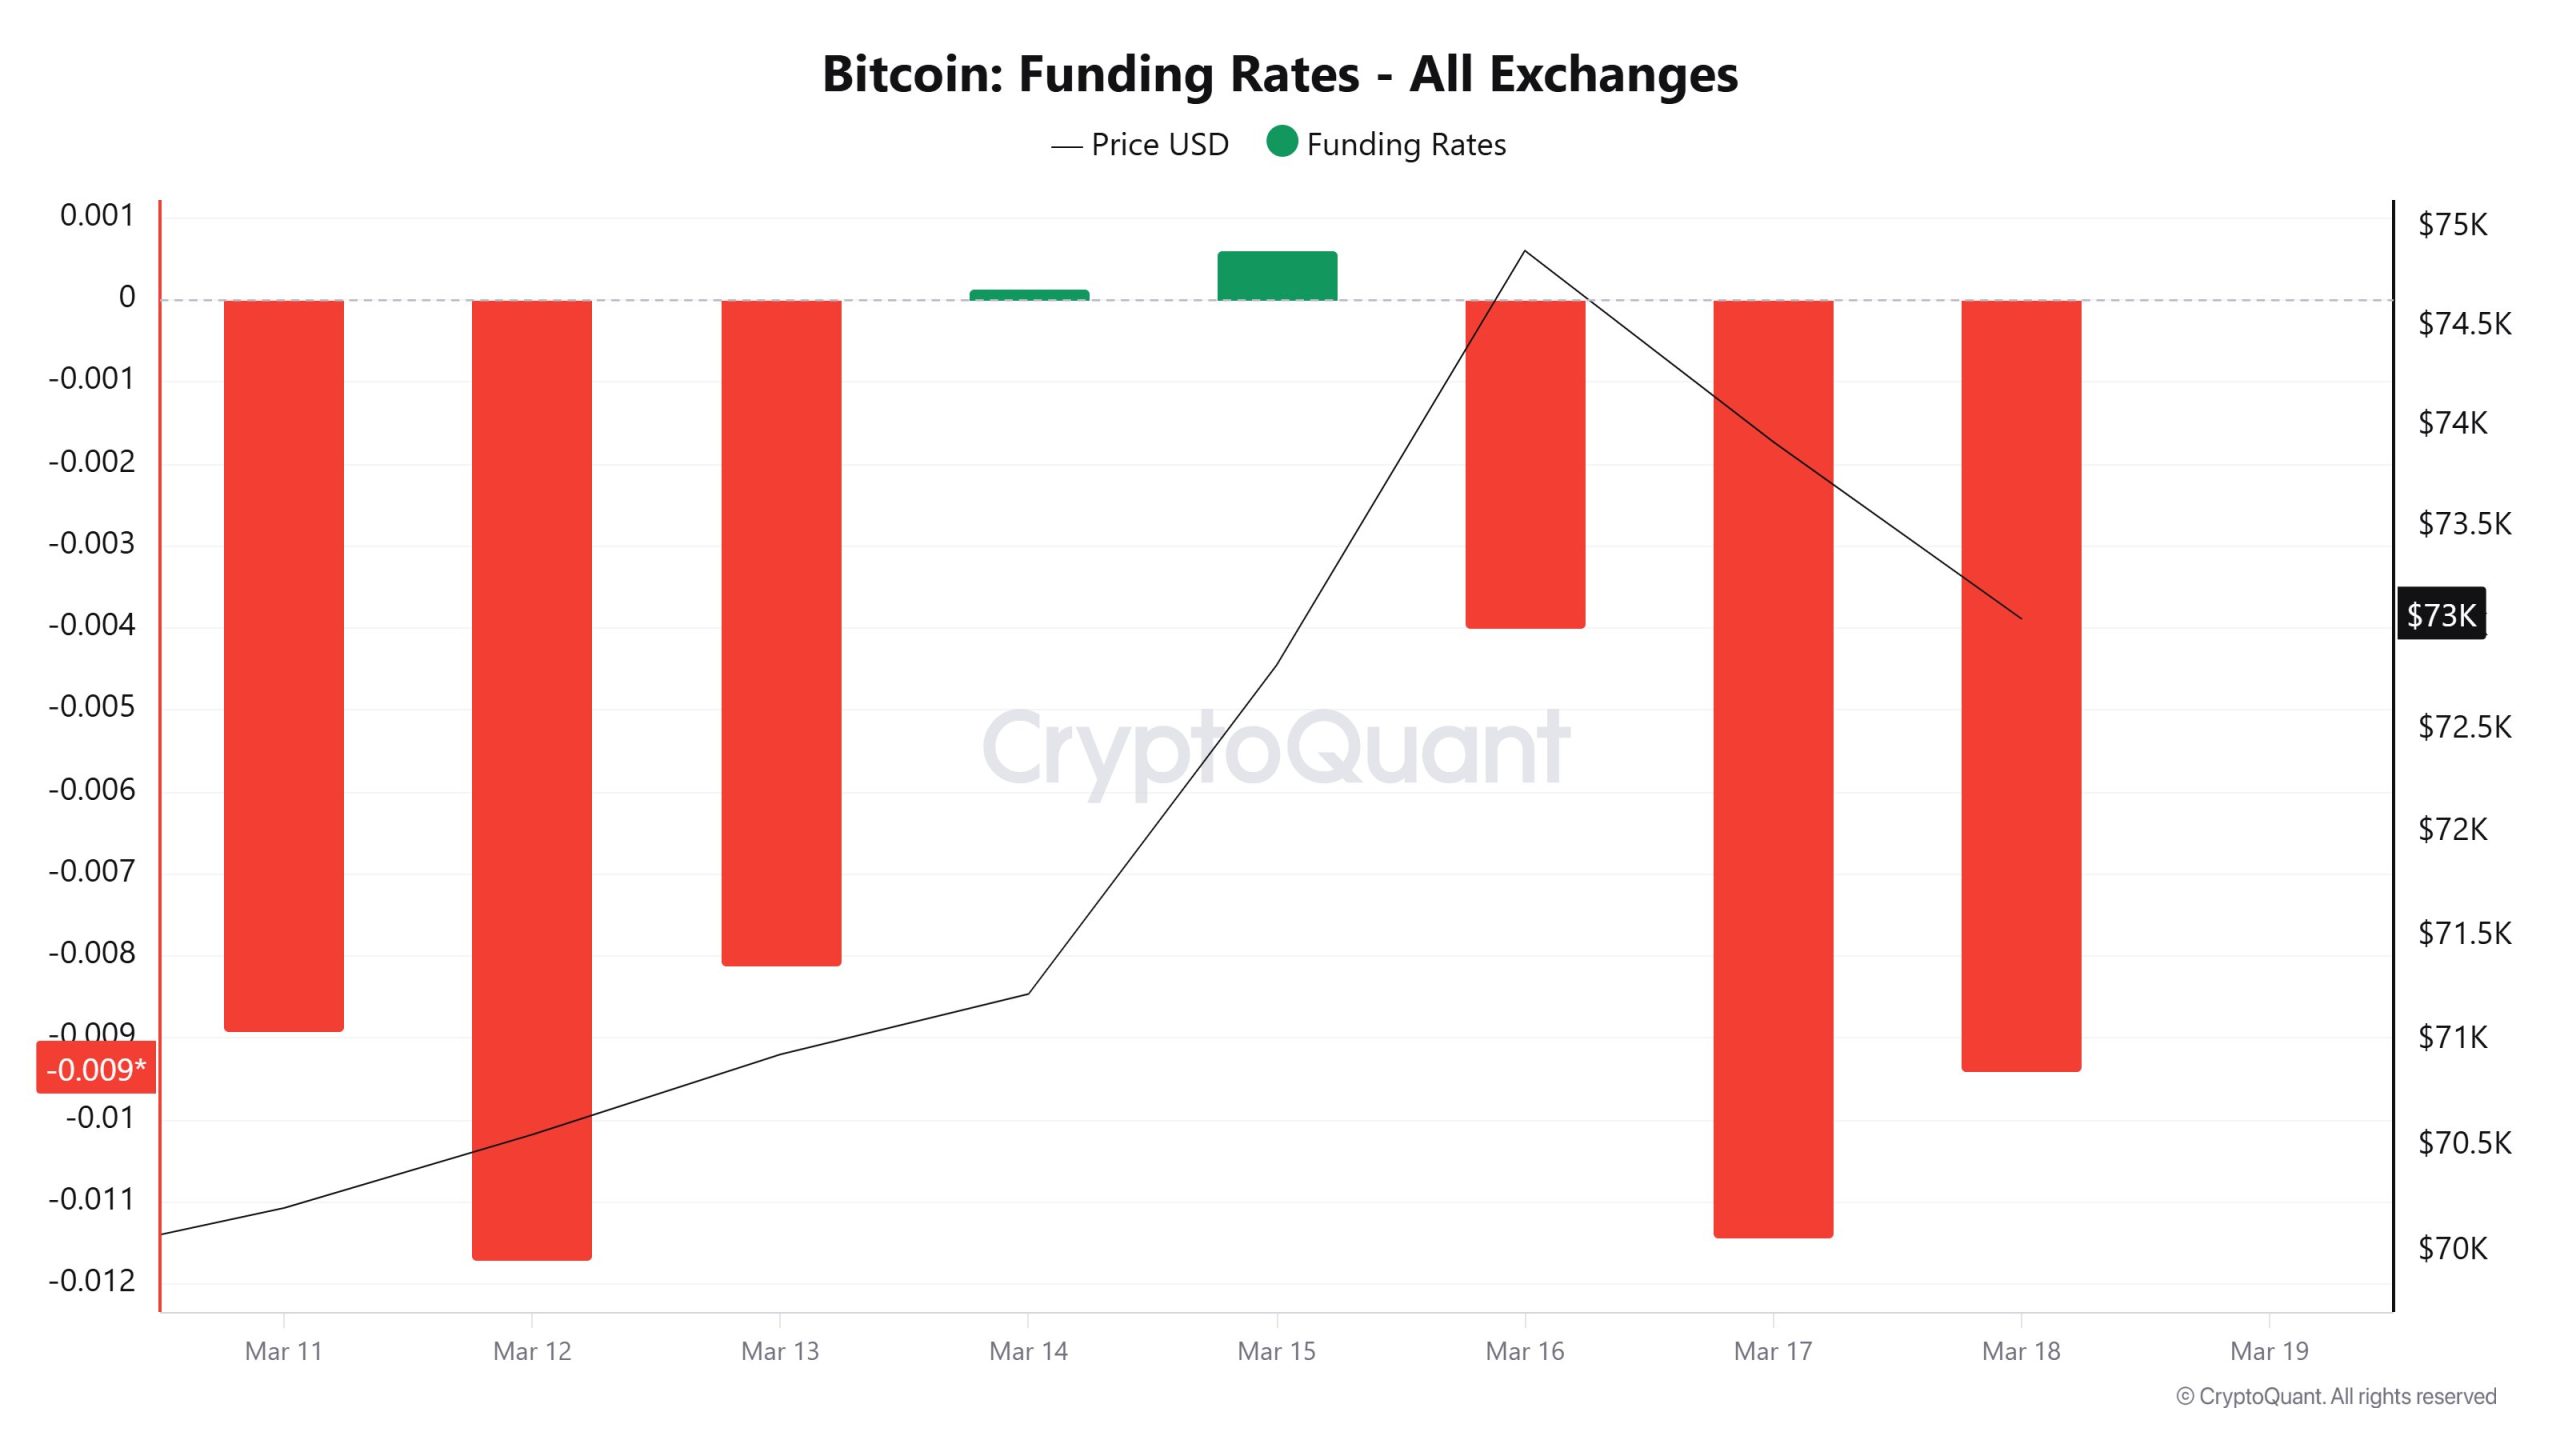
The funding rate remained mostly in negative territory throughout the week. On March 11 and 12, the negative rates were particularly deep. On March 14 and 15, a brief recovery brought the rate close to neutral and into slightly positive territory. However, this situation was not sustained; toward the end of the week, the funding rate turned negative again. This pattern indicates that short positions generally maintained their dominance in the derivatives market. The fact that the funding rate could not sustainably turn positive as prices rose suggests the market remains cautious. This structure also keeps the possibility of a short squeeze alive during upward price movements.
Long & Short Liquidations
As the BTC price rose from the $69,000 level to the $76,000 level, a total of $445 million in short positions were liquidated. At the same time, $352 million in long positions were also liquidated.
| Date | Long Amount (Million $) | Short Amount (Million $) |
|---|---|---|
| March 11 | 20.60 | 49.63 |
| March 12 | 21.07 | 25.05 |
| March 13 | 65.38 | 99.82 |
| March 14 | 6.24 | 30.97 |
| March 15 | 5.47 | 40.17 |
| March 16 | 206.14 | 98.21 |
| March 17 | 27.63 | 101.44 |
| Total | 352.53 | 445.29 |
Exchange Supply Ratio
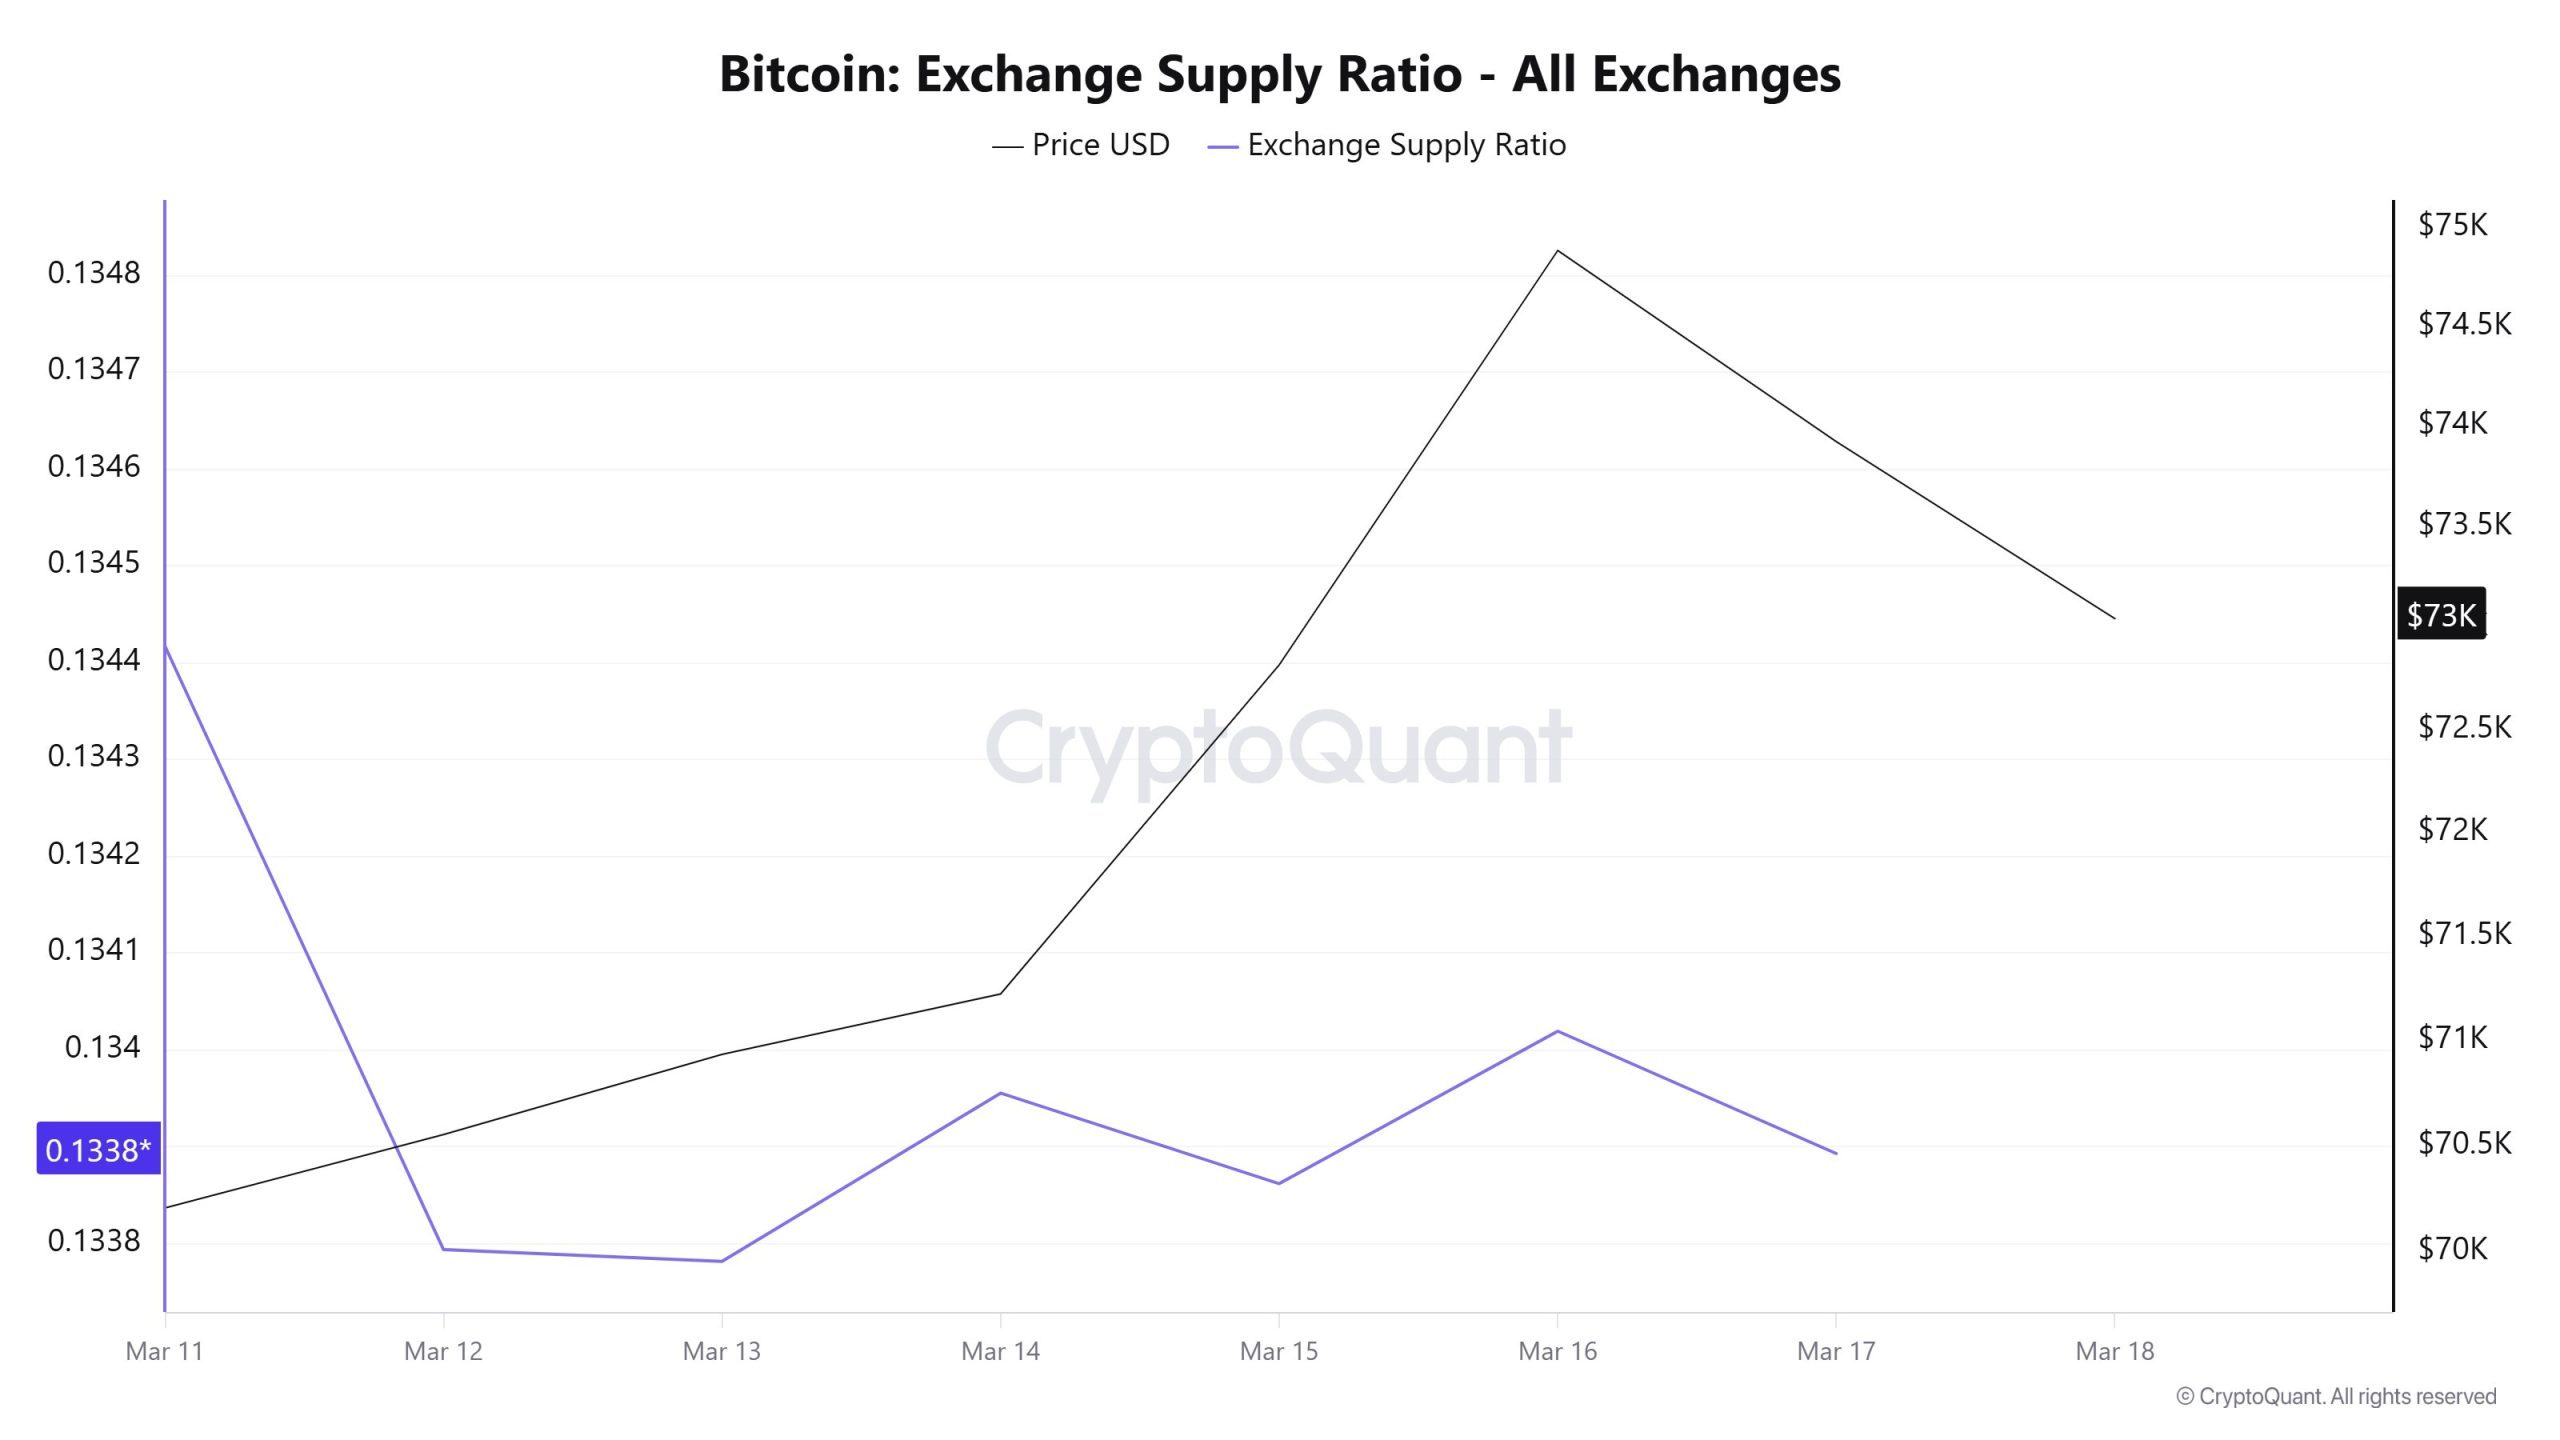
The Exchange Supply Ratio data moved within a narrow range throughout the week. The metric, which stood at approximately 0.1344 on March 11, retreated to around 0.1338 on March 12 and 13. Although a slight recovery was observed in the following days, the data generally remained within the 0.1338–0.1340 range. This pattern indicates that Bitcoin supply on exchanges has not increased significantly. In other words, there is no indication that investors are moving their coins to exchanges on a large scale. This suggests that selling pressure remains limited in the short term.
BTC On-Chain Overview
| Metric | Positive 📈 | Negative 📉 | Neutral ➖ |
|---|---|---|---|
| Active Addresses | ✓ | ||
| Breakdowns | ✓ | ||
| Derivatives | ✓ | ||
| Exchange Supply Ratio | ✓ |
The metrics and guidance provided in the table do not alone explain or imply any expectation of future price changes for any asset. Digital asset prices can fluctuate based on many different variables. The on-chain analysis and related guidance are intended to assist investors in their decision-making process; however, basing financial investments solely on the results of this analysis may lead to unfavorable outcomes. Even if all metrics produce positive, negative, or neutral results simultaneously, the expected outcomes may not materialize depending on market conditions. Investors reviewing the report should take these warnings into consideration.
Legal Notice
The investment information, comments, and recommendations contained in this document do not constitute investment advisory services. Investment advisory services are provided by authorized institutions on a personalized basis, taking into account the risk and return preferences of individuals. The comments and recommendations contained in this document are of a general nature. These recommendations may not be suitable for your financial situation and risk and return preferences. Therefore, making an investment decision based solely on the information contained in this document may not result in outcomes that align with your expectations.
NOTE: All data used in Bitcoin on-chain analysis is based on CryptoQuant.
