
Fear & Greed Index
Source: Alternative.me
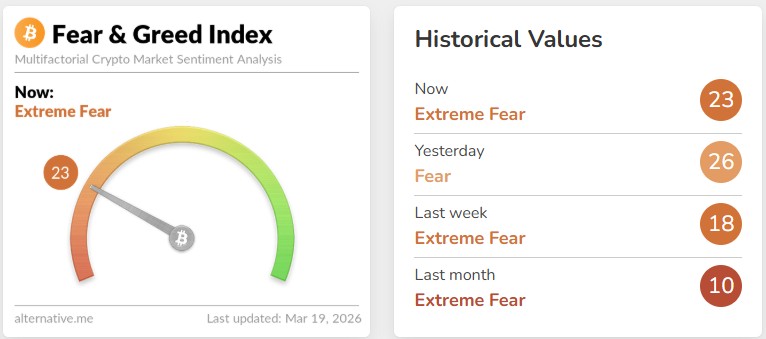
- Change in Fear and Greed Level: +8
- Last Week’s Level: 15
- This Week’s Level: 23
The Fear and Greed Index rose from 15 last week to 23 this week, signaling a recovery in investor sentiment. Although the index is moving upward, the market remains in the “fear” zone. However, compared to previous weeks, the pressure of extreme fear has eased, and investors appear to be shifting toward a more balanced mindset. When examining data from the past month, considering that the index had dropped as low as 11, the current rise indicates a short-term improvement in market sentiment.
The relationship between the Bitcoin price and the Fear and Greed Index has become more clearly evident during this period. The rise in the index indicates that buying activity from the price’s bottom regions has increased and selling pressure has weakened compared to the previous period. While occasional fund inflows from the institutional side support this recovery, the current level suggests the market has not yet entered a phase of strong optimism.
In the coming period, a move by the index toward the 25–30 range could signal that the recovery in market sentiment is gaining strength. Such a scenario could pave the way for a more pronounced and sustainable upward trend in the Bitcoin price. Conversely, if the index dips back below the 20 level, a cautious outlook on the market is expected to persist.
Fund Flows
Source: Coinshares
Overview:
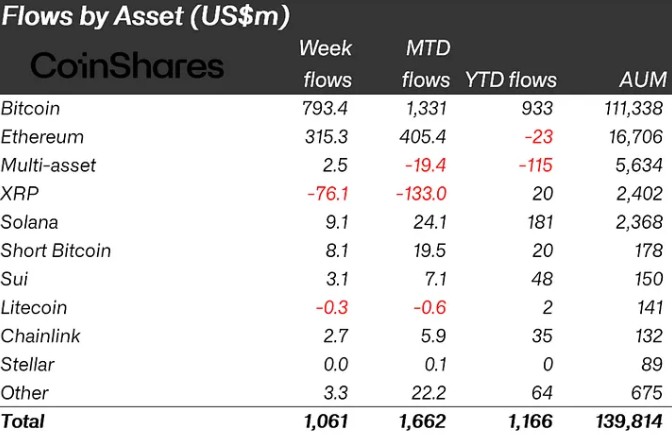
Strong fund inflows into crypto asset investment products stood out this week. According to Coin Shares data, while a noticeable recovery in risk appetite was observed on the institutional side, the week saw a significant increase in total inflows. Bitcoin and Ethereum funds were particularly instrumental in this flow. Conversely, outflows continue in some altcoins.
Weekly total inflows: $1.061 billion
MTD (Month-to-date): +$1.662 billion
YTD (Year-to-date): +$1.166 billion
The majority of weekly fund inflows once again flowed into Bitcoin.
Bitcoin weekly inflows: $793.4M – Institutional demand remains strong. Total inflows since the start of the year have reached $933M.
Ethereum weekly inflow: $315.3M – There is a noticeable recovery on the Ethereum side. Although the YTD figure remains in a limited negative range at -$23M, the recovery is noteworthy.
Solana weekly inflow: $9.1M – While the inflow is more limited, the positive trend persists. The strong outlook continues with a year-to-date total of $181M.
XRP weekly flow: -$76.1M – The most notable outflow this week occurred on the XRP side. The MTD figure of -$133M indicates that selling pressure persists.
Other assets:
- Short Bitcoin: +$8.1M
- Sui: +$3.1M
- Chainlink: +$2.7M
- Litecoin: -$0.3M
The overall picture indicates that institutional capital is shifting back toward Bitcoin and Ethereum-heavy positions, while a selective and more cautious approach continues on the altcoin side.
Total Market Cap
Source: Trading View
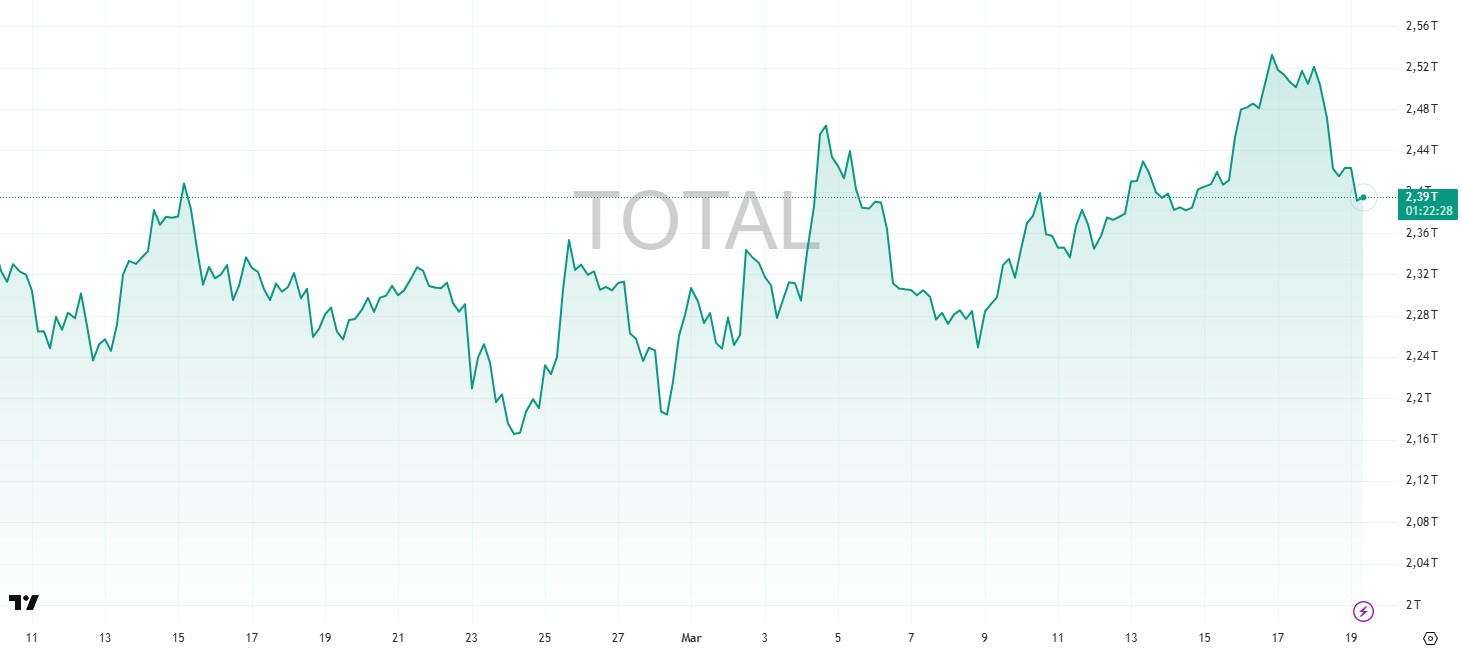
- Market Capitalization Last Week: $2.41 Trillion
- Market Capitalization This Week: $2.39 Trillion
Although the overall upward trend in the cryptocurrency market was maintained this week, some of the gains were given back due to selling pressure toward the end of the week. Although the total market value surged above the 2.50 trillion USD level during the week, it retreated toward the close, stabilizing at approximately 2.39 trillion USD. The weekly high was around 2.52 trillion USD, while the low was approximately 2.28 trillion USD.
Total 2
The Total 2 index, which started the week at approximately $950 billion, showed a gradual rise through the middle of the week, approaching the $1 trillion mark. It gained strong momentum, particularly in the second half of the week, driven by buying activity in altcoins. However, the index retreated amid selling pressure toward the end of the week and currently stands at 989 billion USD. The weekly low was recorded at approximately 930 billion USD, while the high reached 1.03 trillion USD. This pattern indicates that while altcoins continue to attempt rallies, selling pressure persists at higher levels.
Total 3
The Total 3 index started the week at approximately $705 billion and showed a more pronounced upward trend throughout the week. Driven by activity in mid-tier altcoins, the index rose as high as 750 billion USD. However, a pullback occurred toward the end of the week due to selling pressure, and it currently stands at 726 billion USD. While the weekly low was approximately 690 billion USD, volatility remained higher compared to the Total 2 index.
Looking at the overall picture, although altcoins showed strength for most of the week, the selling pressure toward the close indicates that the market has not yet entered a strong and sustained uptrend. The fact that the volatility ranking remains “Total 3 > Total 2 > Total” suggests that risk appetite remains higher for altcoins, but volatility in this segment also continues to be pronounced.
Bitcoin Dominance
Source: Tradingview
Weekly Change
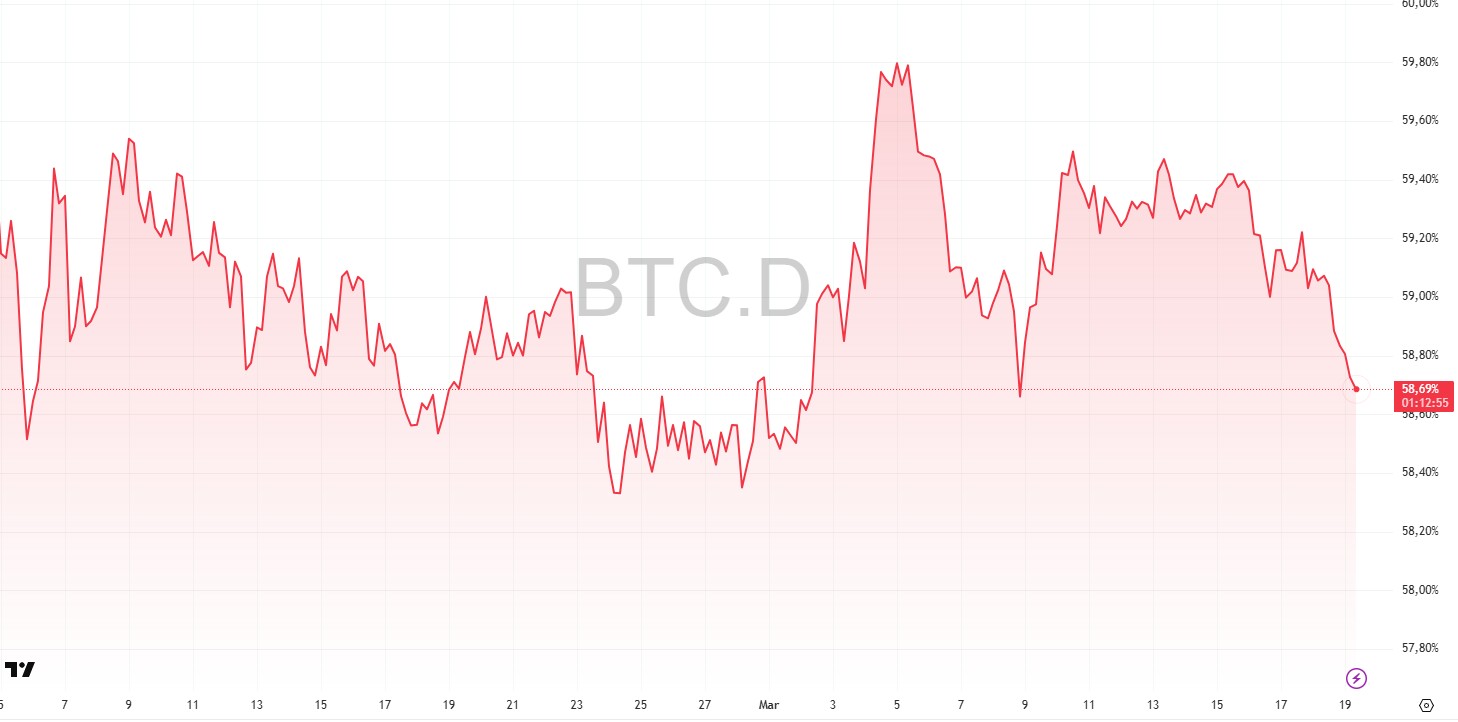
- Last Week’s Level: 59.52%
- This Week’s Level: 58.70%
Bitcoin dominance began the week in the range of approximately 59.20%–59.30%. After fluctuating in the first part of the week, dominance gradually retreated, falling to the 58.40%–58.50% range. Although a limited recovery was observed in altcoins during this period, the fact that dominance could not sustain a drop below the 58.40% level demonstrated that Bitcoin maintained its market influence.
As Bitcoin regained strength toward the middle of the week, its dominance saw a sharp upward surge. With this move, the ratio quickly rose to 59.80%, testing the week’s highest point . However, this level proved unsustainable, and a gradual pullback began. As selling pressure increased toward the end of the week, dominance continued its downward trend and is currently hovering around 58.69%. This pattern indicates that Bitcoin’s dominance increased during the first half of the week but that altcoins regained relative strength in the latter part.
Although institutional interest in Bitcoin continues, the decline in its dominance suggests that risk appetite across the market is beginning to shift partially toward altcoins. However, it is too early to say that this shift has turned into a strong and sustained trend.
Technically, the 58.40%–58.50% range stands out as short-term support, while the 59.50%–60% range above continues to act as a strong resistance zone. If the current structure holds, Bitcoin dominance is expected to continue fluctuating within the 58.40%–60% range in the short term.
Bitcoin Spot ETF
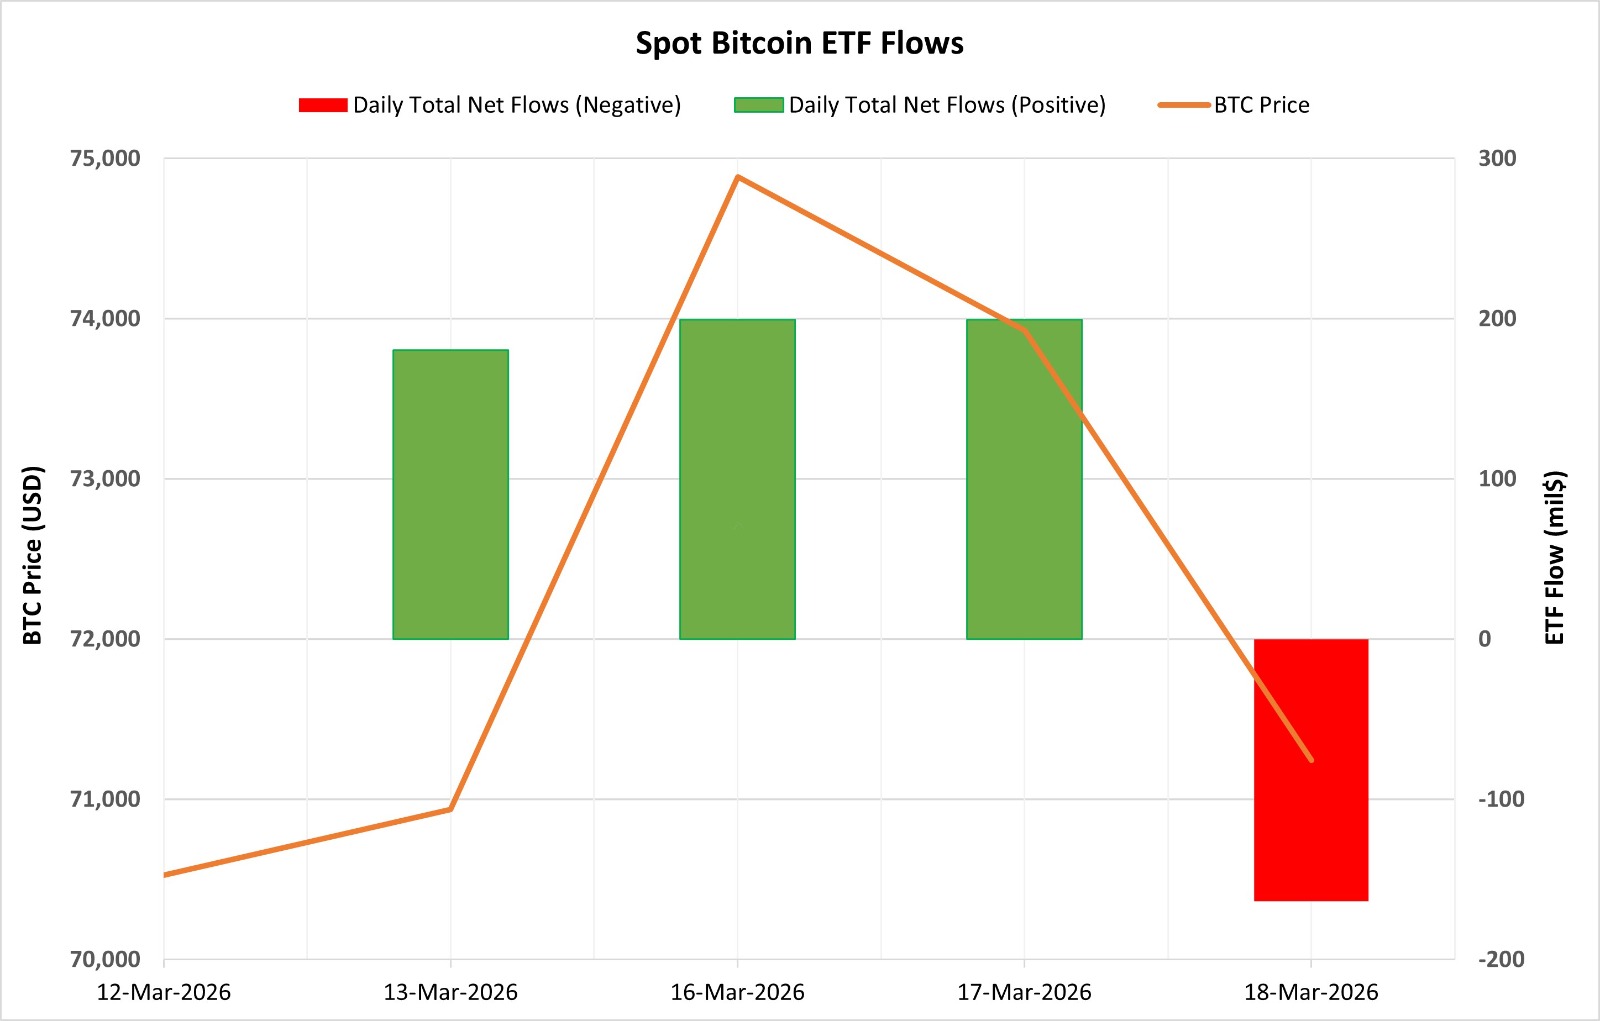
Source: Darkex Research Department
Between March 13 and 18, 2026, Spot Bitcoin ETFs saw a total of $415.7 million in net inflows. While the first three trading days saw strong and steady inflows, the seven-day streak of positive inflows came to an end on March 18 with a net outflow of $163.5 million. When analyzed by fund, BlackRock IBIT was the fund that contributed the most during this period, with $418.4 million in net inflows. With these developments, the cumulative total net inflow of Spot Bitcoin ETFs rose to $56.35 billion at the end of the 545th trading day.
| Date | Coin | Price | ETF Flow (mil$) | ||
|---|---|---|---|---|---|
| Open | Close | Change % | |||
| March 13, 2026 | BTC | 70,526 | 70,936 | 0.58% | 180.4 |
| March 16, 2026 | BTC | 72,827 | 74,883 | 2.82% | 199.4 |
| March 17, 2026 | BTC | 74,883 | 73,925 | -1.28% | 199.4 |
| March 18, 2026 | BTC | 73,925 | 71,244 | -3.63% | -163.5 |
| Total (March 13–18, 2026) | — | — | — | 1.02% | 415.70 |
On the price front, Bitcoin opened at $70,526 on March 13 and closed at $71,244 on March 18. During this period, the BTC price rose by 1.02%. While the first two trading days saw a strong price rally in line with ETF inflows, the final two days featured a noticeable weakening alongside outflows. In particular, the 3.63% price drop on March 18, coinciding with ETF outflows, indicated that the correlation between ETF flows and price movements has strengthened again in the short term. If ETF flows turn positive again, upward momentum in the Bitcoin price could gain strength. Conversely, if outflows continue, short-term downward pressure and increased volatility on the price side appear likely.
Spot Ethereum ETF
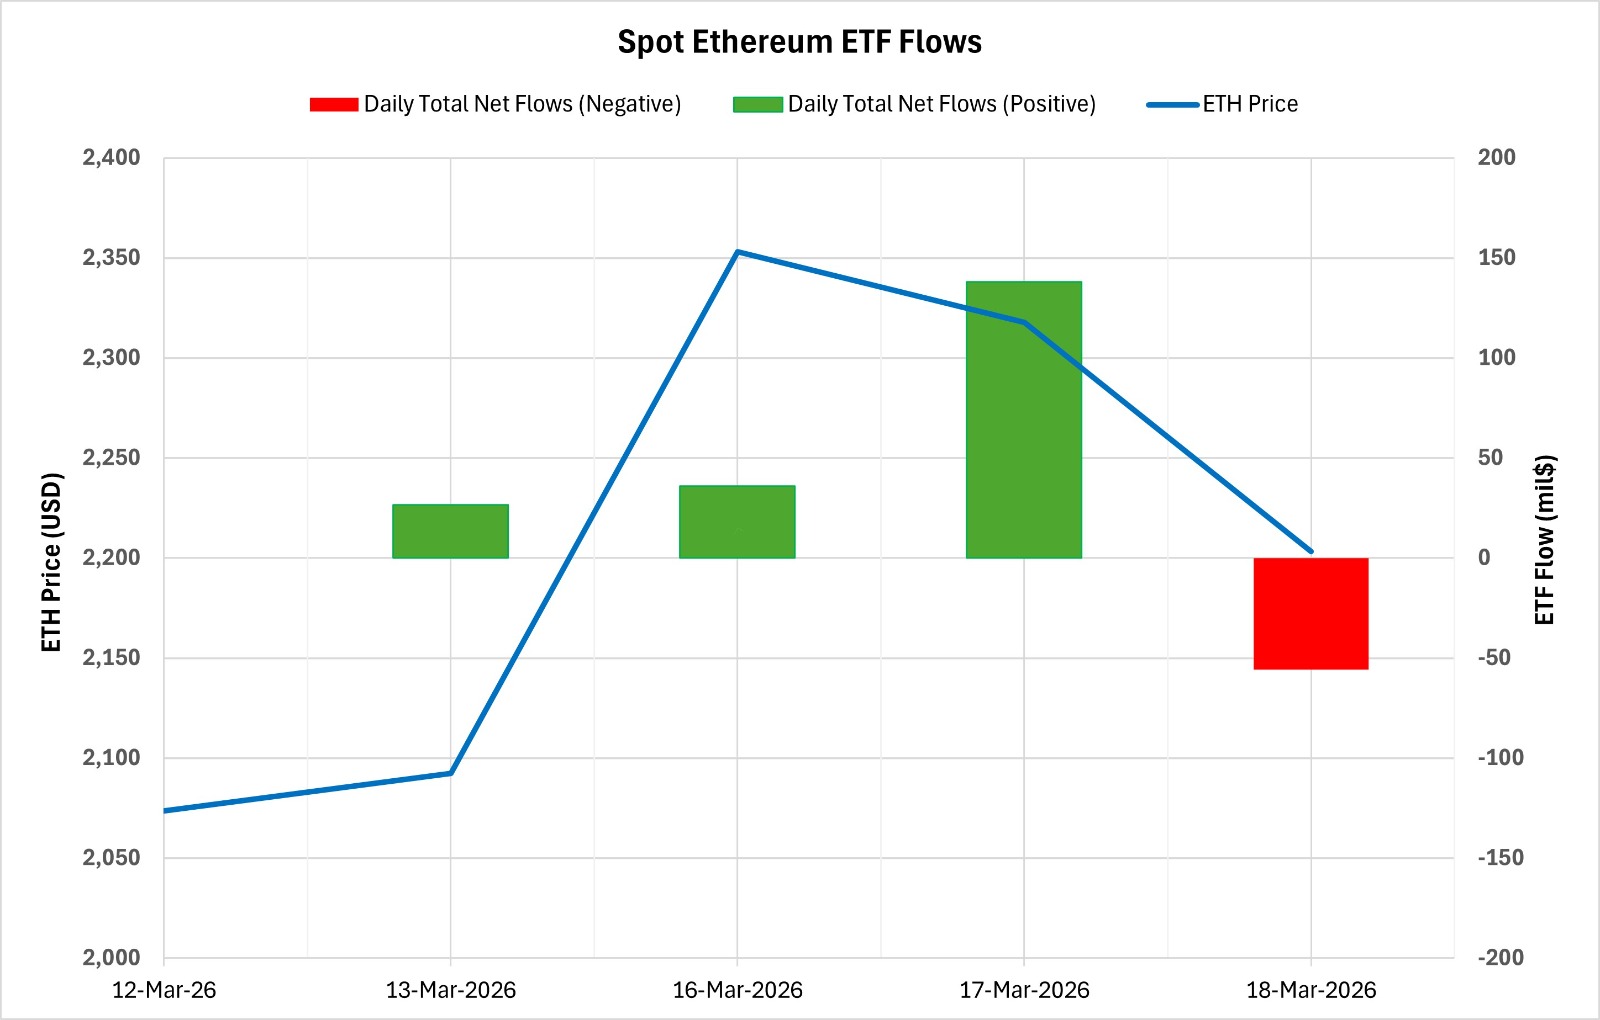
Source: Darkex Research Department
Between March 13 and 18, 2026, Spot Ethereum ETFs saw a total of $145.1 million in net inflows. While inflows increased over the first three trading days of this period, the six-day streak of positive flows ended on March 18 with a net outflow of $55.7 million. By fund, Fidelity FETH contributed the most to this trend with a total of $102.9 million in net inflows, while BlackRock ETHA stood out with $96.6 million in net inflows from ” .” With these developments, the cumulative total net inflow of Spot Ethereum ETFs rose to $11.94 billion by the end of the 415th trading day.
| Date | Coin | Price | ETF Flow (mil$) | ||
|---|---|---|---|---|---|
| Open | Close | Change % | |||
| March 13, 2026 | ETH | 2,074 | 2,093 | 0.92% | 26.7 |
| March 16, 2026 | ETH | 2,179 | 2,353 | 8.01% | 35.9 |
| March 17, 2026 | ETH | 2,353 | 2,318 | -1.49% | 138.2 |
| March 18, 2026 | ETH | 2,318 | 2,203 | -4.94% | -55.7 |
| Total (March 13–18, 2026) | — | — | — | 6.26% | 145.1 |
On the price front, Ethereum opened at $2,074 on March 13 and closed at $2,203 on March 18. During this period, the ETH price rose by 6.26%. In particular, the sharp 8.01% surge seen on March 16 created strong momentum supported by ETF inflows. Over the last two trading days, both a weakening in ETF inflows and a pullback in price were notable. Overall, this period indicates that strong institutional demand for Ethereum continues, but the outflow seen on the last trading day signals a weakening in short-term risk appetite. If ETF inflows turn positive again, an upward trend in the Ethereum price appears likely to continue. However, if outflows persist, a corrective trend in prices and increased volatility may remain in the foreground.
Legal Notice
The investment information, comments, and recommendations contained in this document do not constitute investment advisory services. Investment advisory services are provided by authorized institutions on an individual basis, taking into account each person’s risk and return preferences. The comments and recommendations contained in this document are of a general nature. These recommendations may not be suitable for your financial situation or your risk and return preferences. Therefore, making an investment decision based solely on the information contained in this document may not result in outcomes that align with your expectations.
