
Active Addresses
Active Receiving Addresses
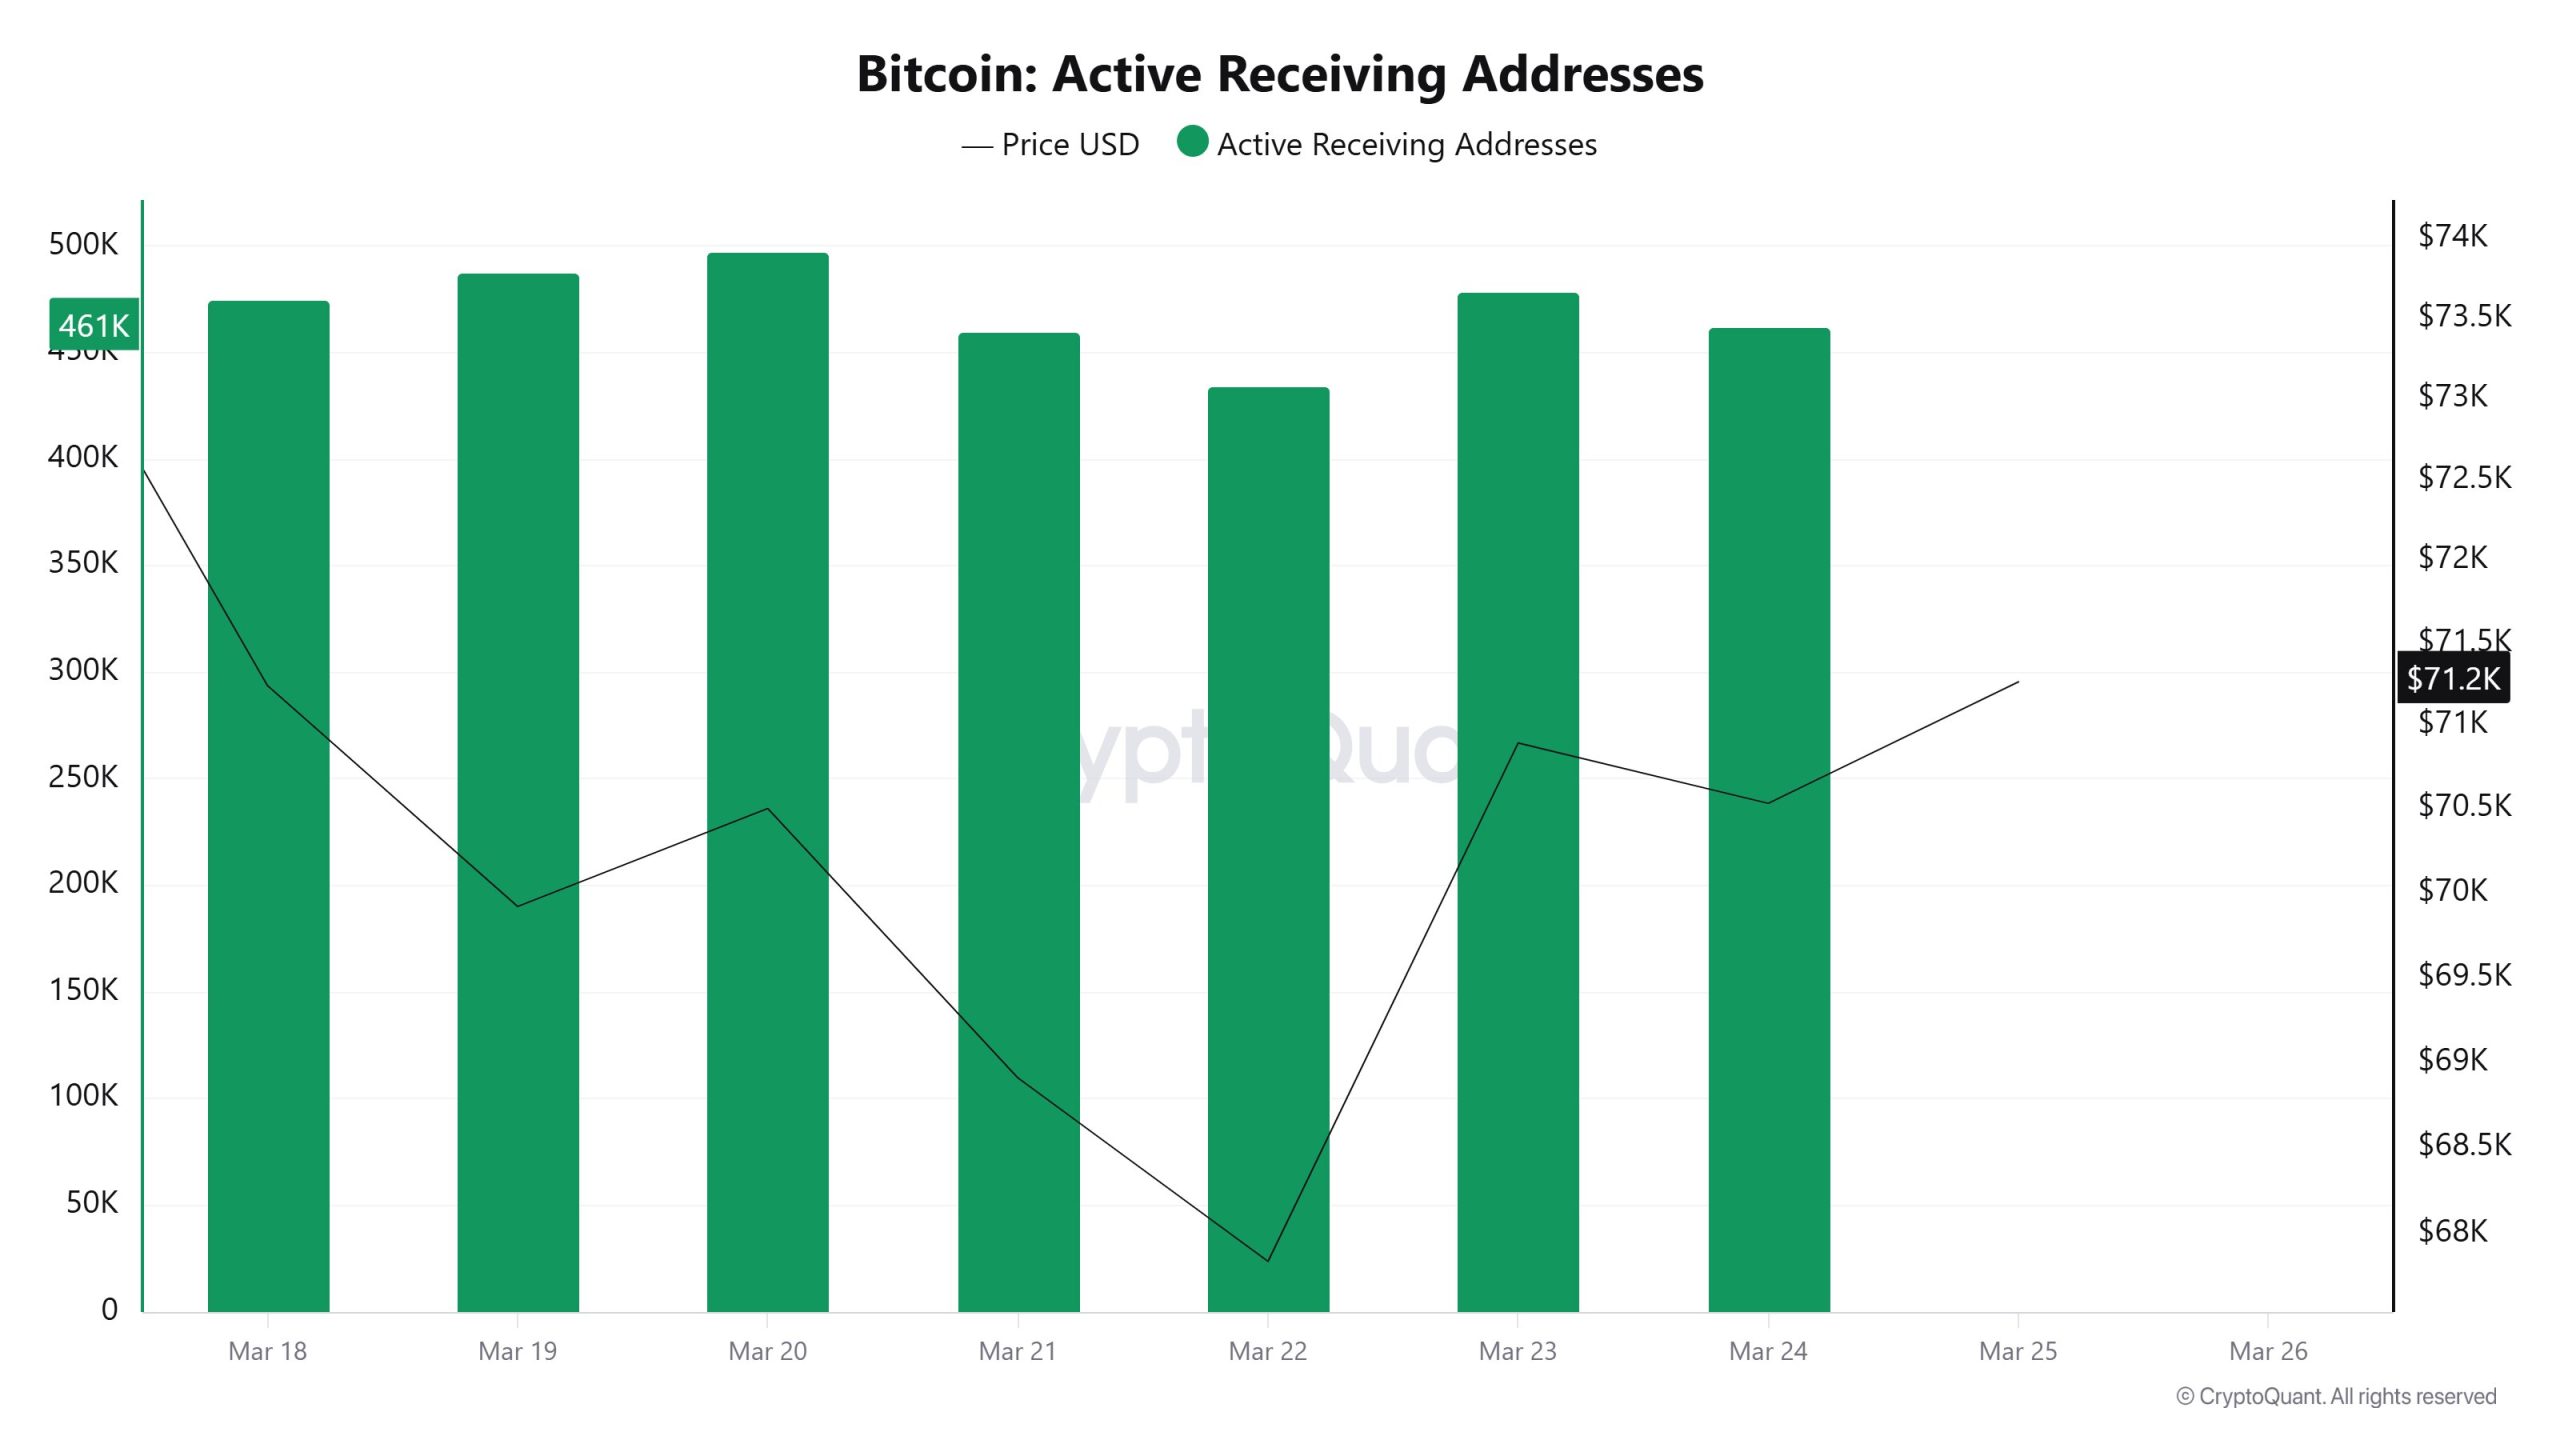
The number of receiving addresses remained generally high during the March 18–24 period, though short-term fluctuations were notable. The figure, which stood at around 460K at the start of the week, rose to 490K by March 20. It retreated to around 430K on March 22, then rebounded to the 470K range. This movement indicates a slowdown on the buying side midweek, but it was not sustained. The resurgence toward the end of the week suggests that demand on the network continues.
Active Sending Addresses
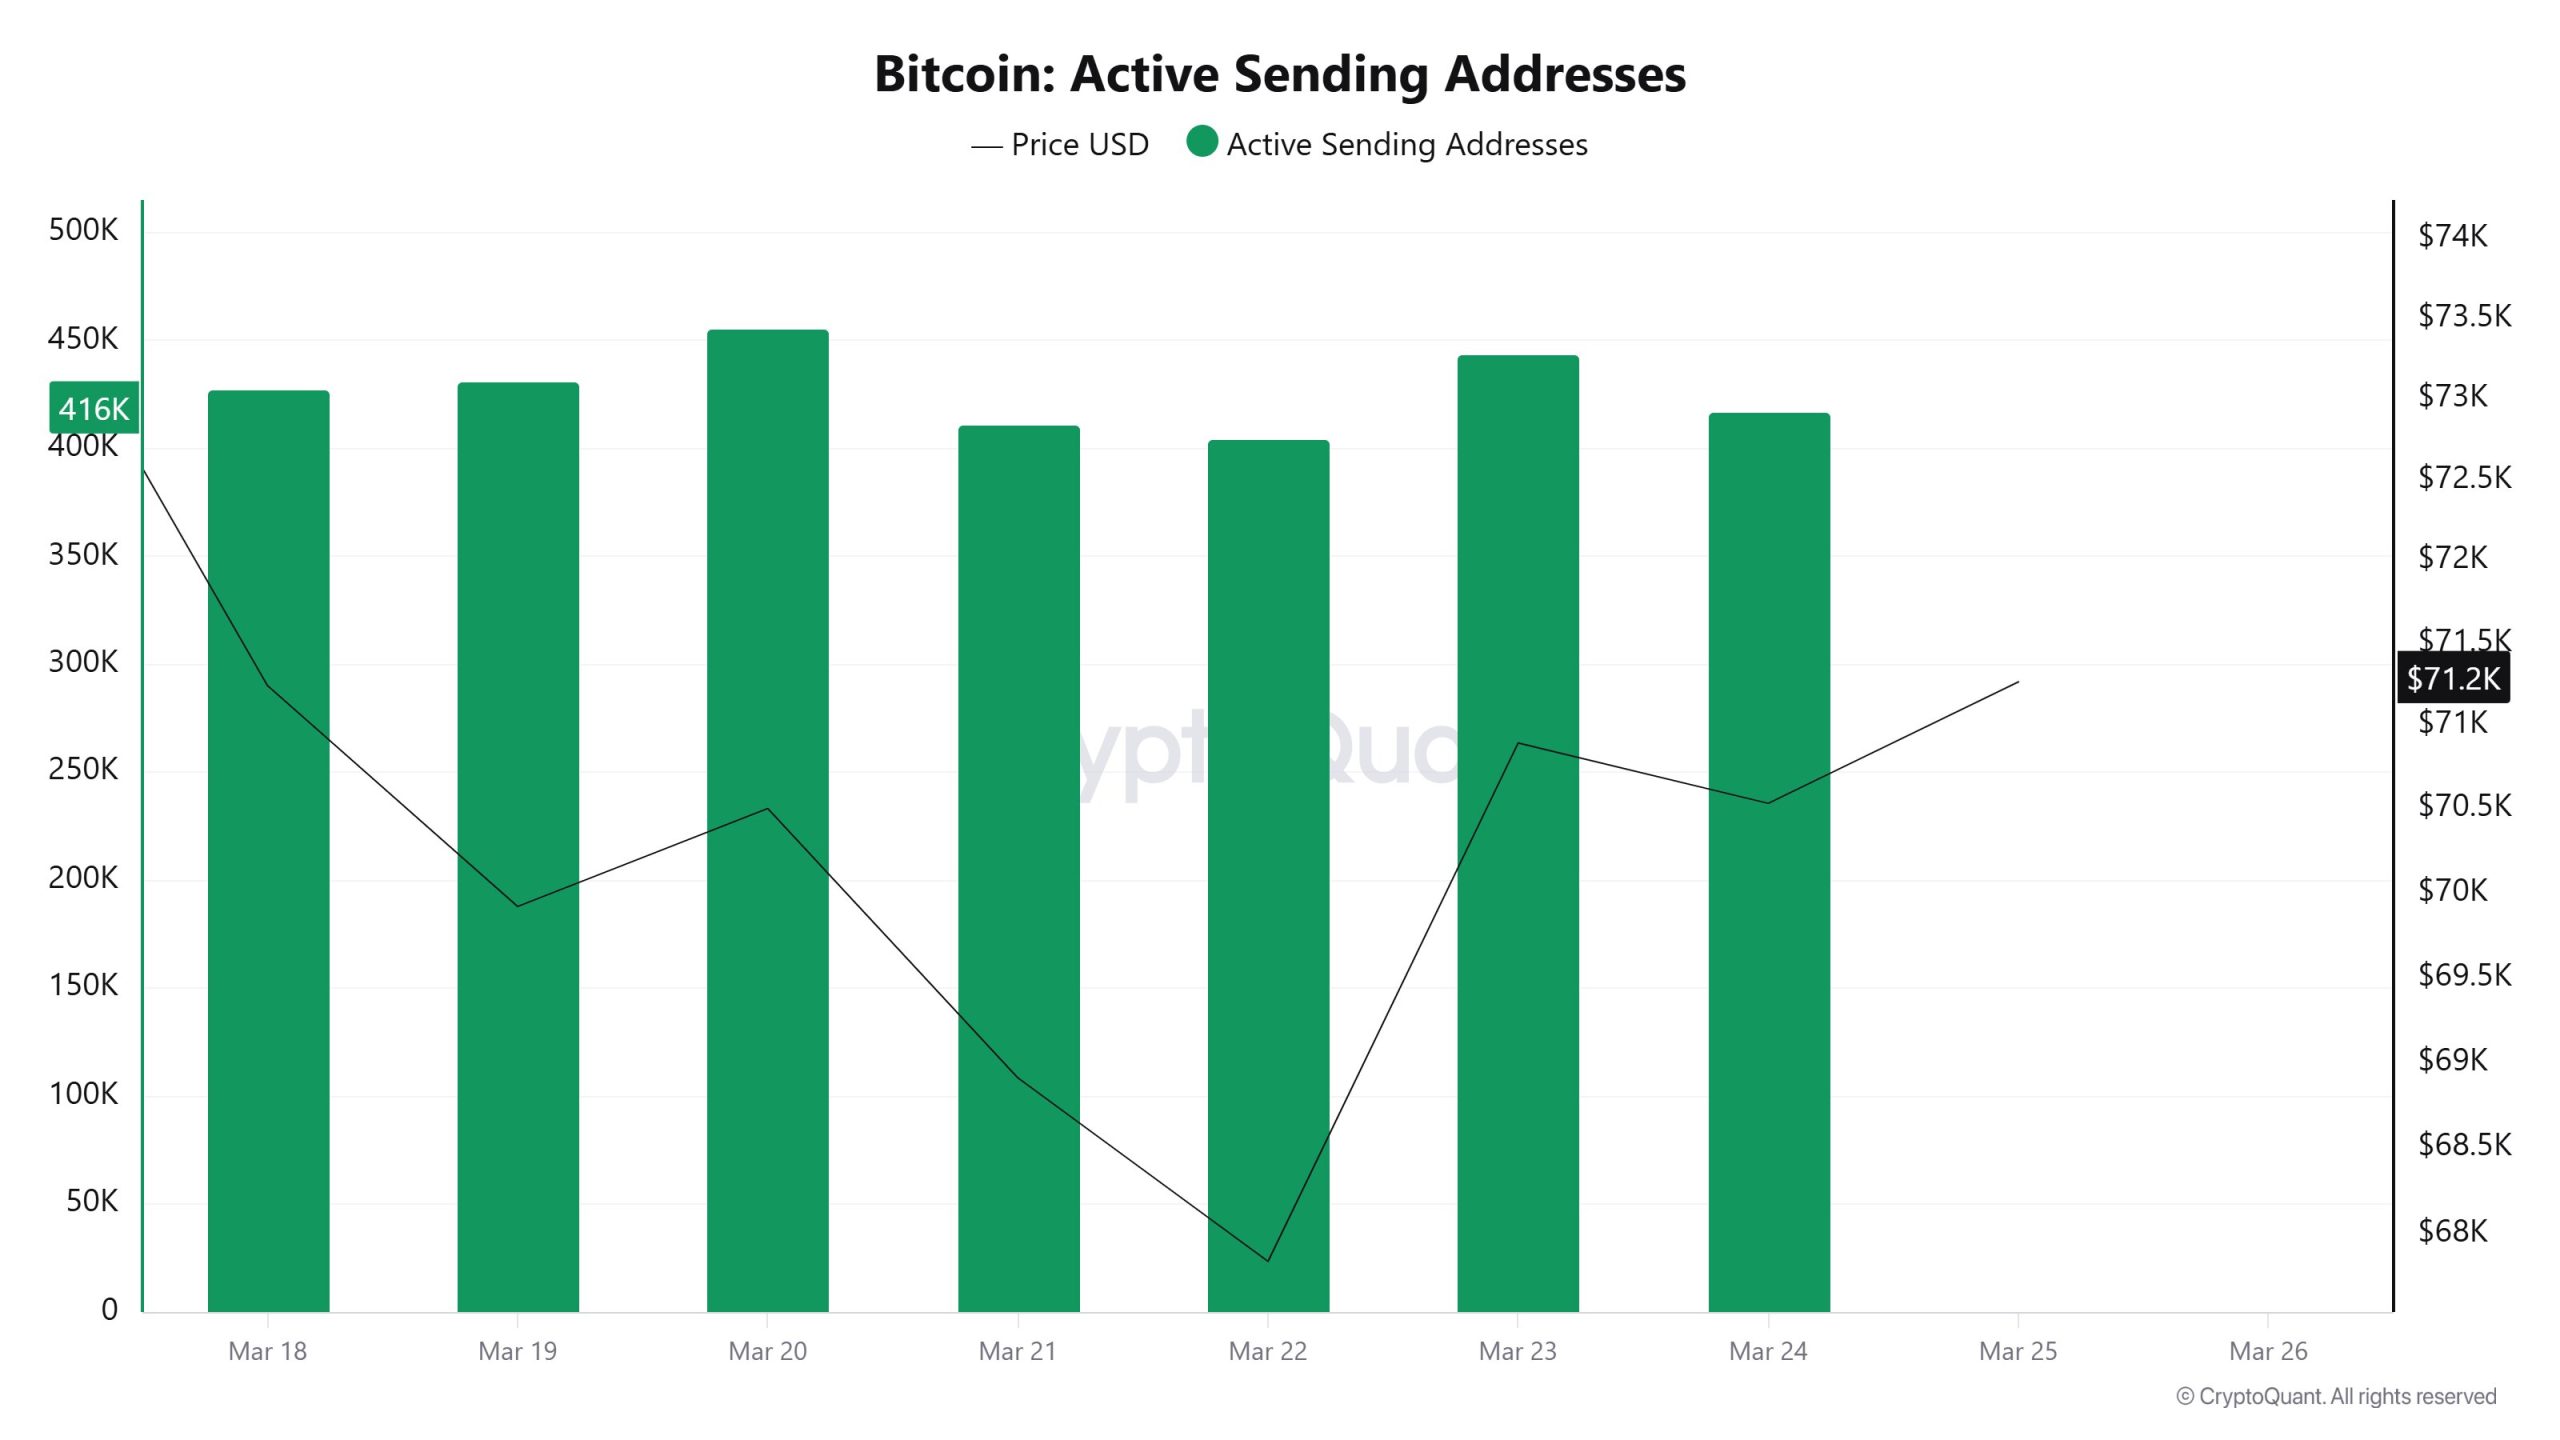
A similar pattern is observed on the sending address side. The metric, which stood at approximately 420K at the start of the week, rose to 450K on March 20. It then dropped sharply on March 22, approaching the 400K level. It subsequently rose again but remained around 410K by the end of the week. The drop on March 22, in particular, indicates that transfer and sales transactions decreased significantly that day. The subsequent recovery, however, signals that transactions are picking up pace again.
Breakdowns
MVRV
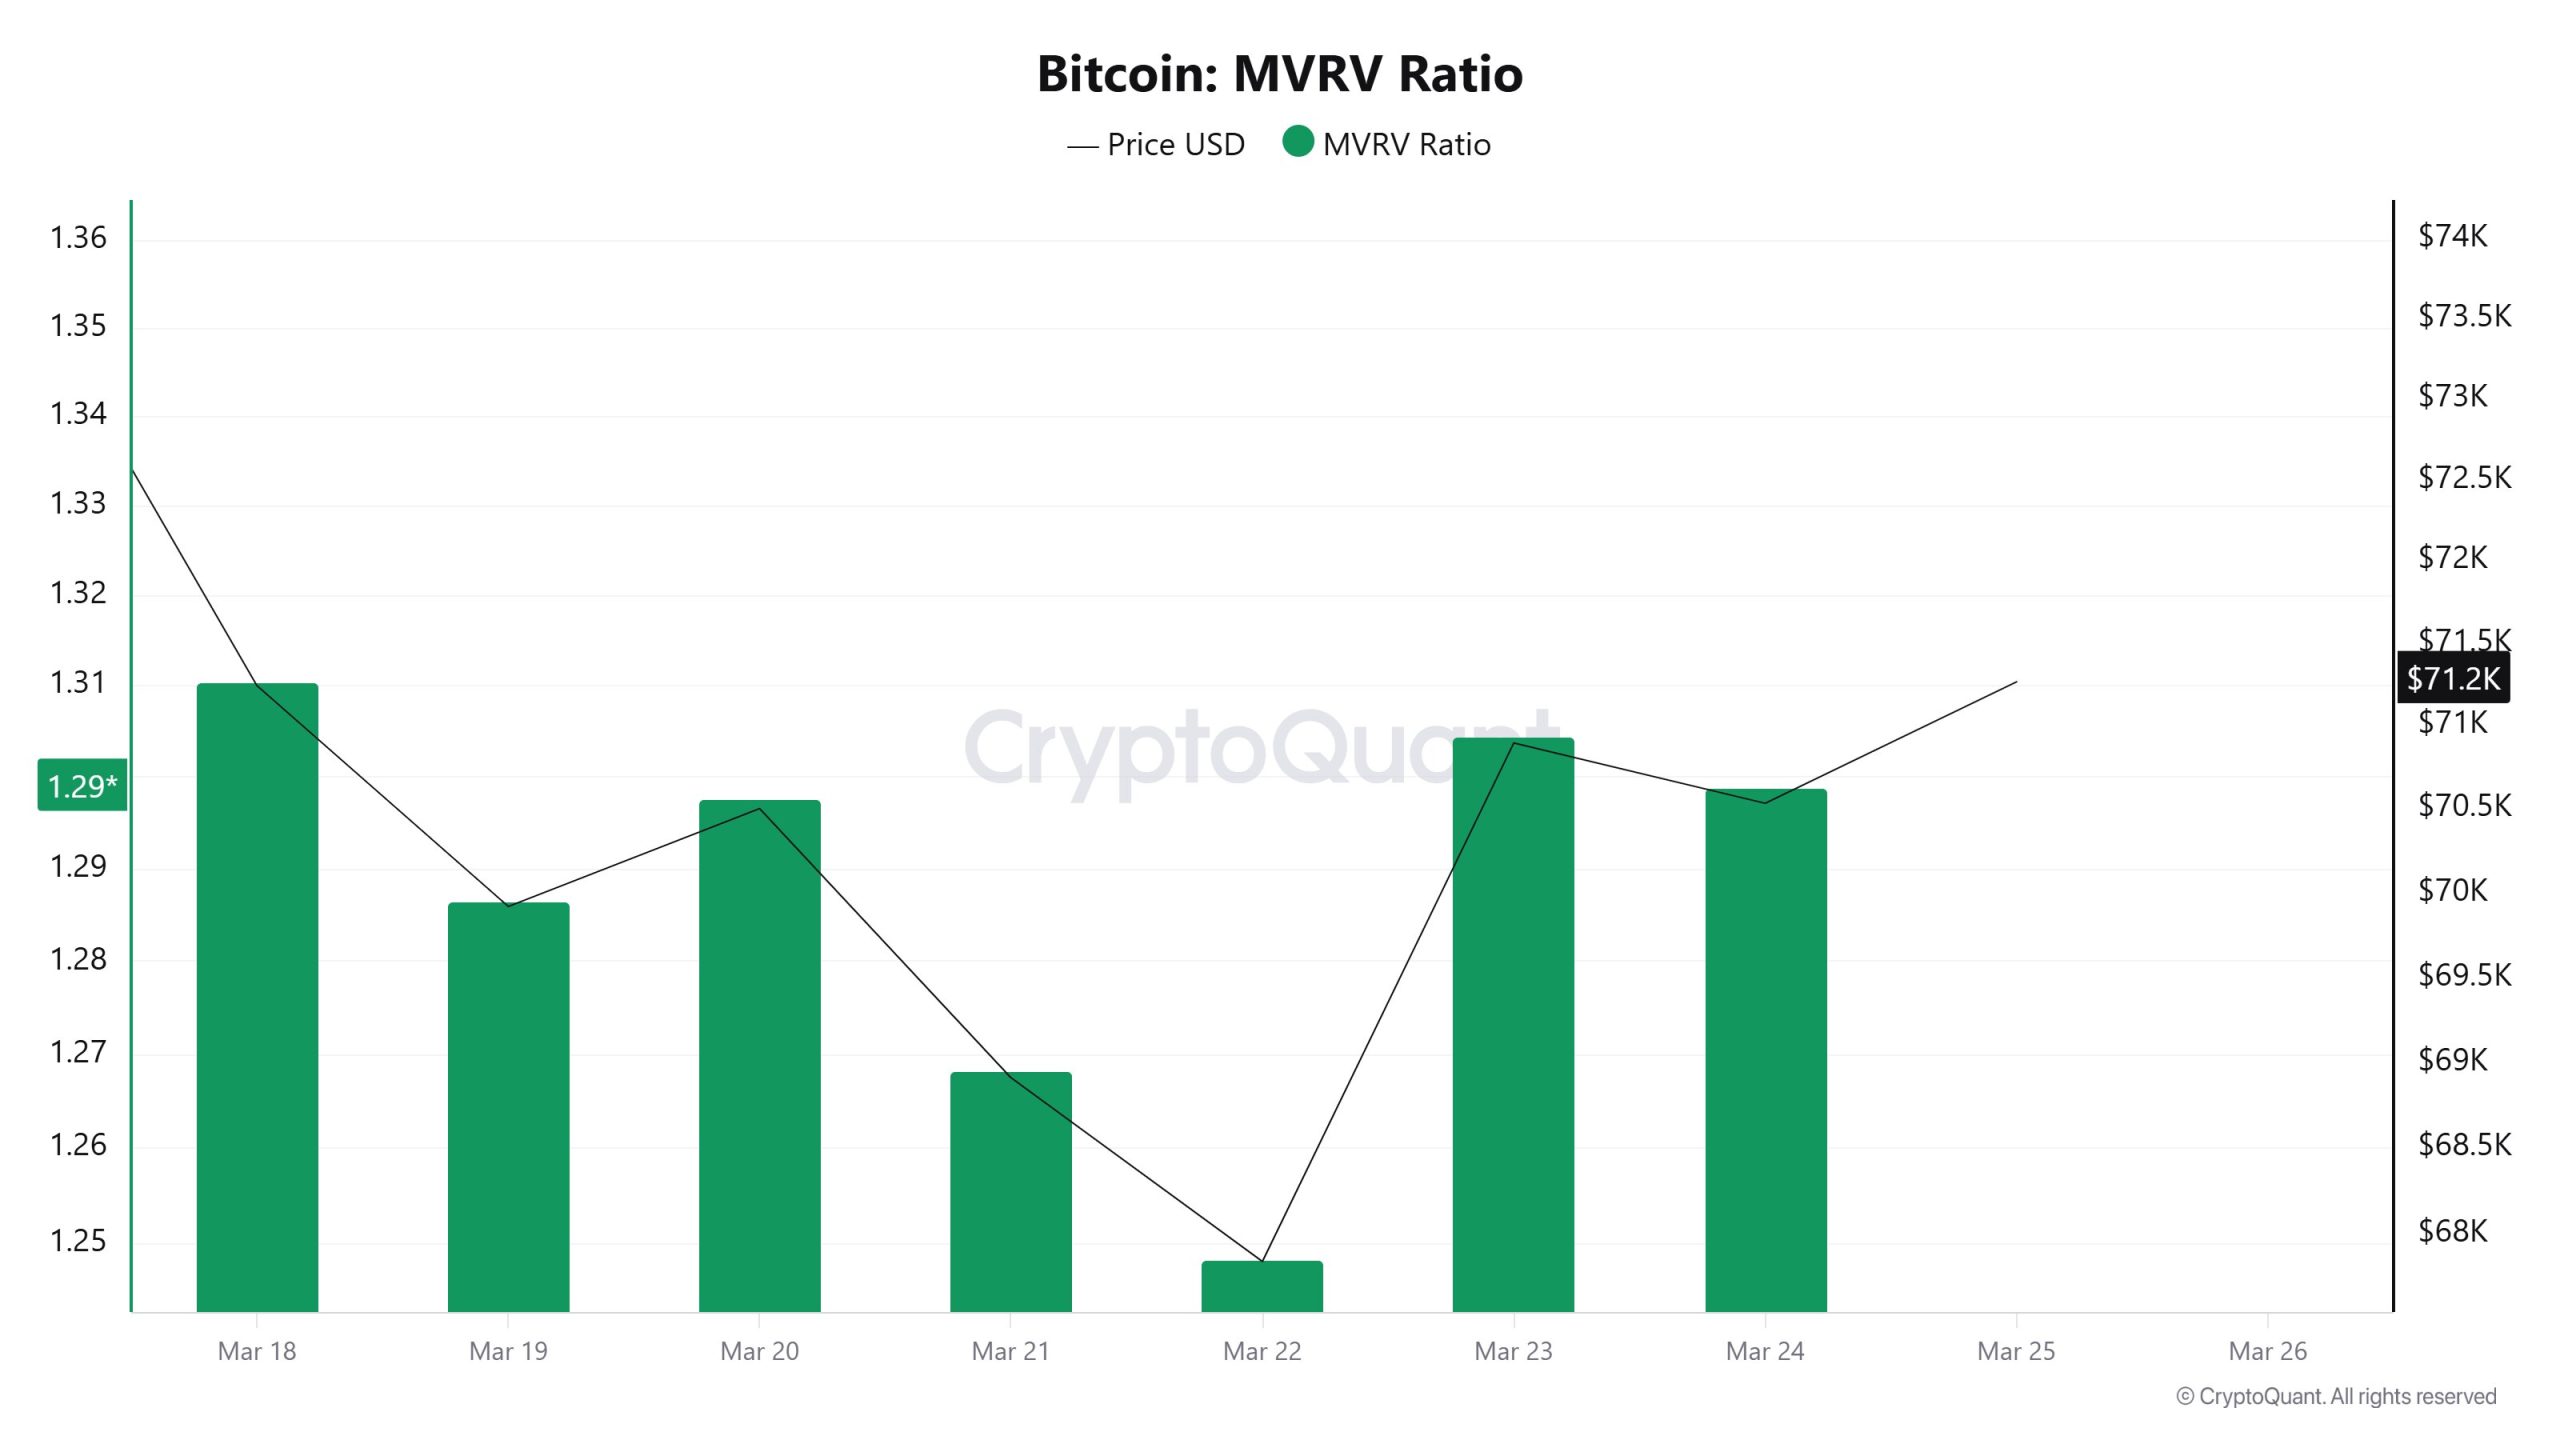
The MVRV Ratio first fell and then recovered over the course of the week. The metric, which stood at approximately 1.33 on March 18, dropped to 1.25 by March 22. It then rose rapidly, climbing above the 1.30 level.
During this decline, investors’ profitability decreased, then increased again as the price recovered. Current levels are still not excessively high, meaning the market does not appear to be overinflated.
Spent Output Profit Ratio (SOPR)
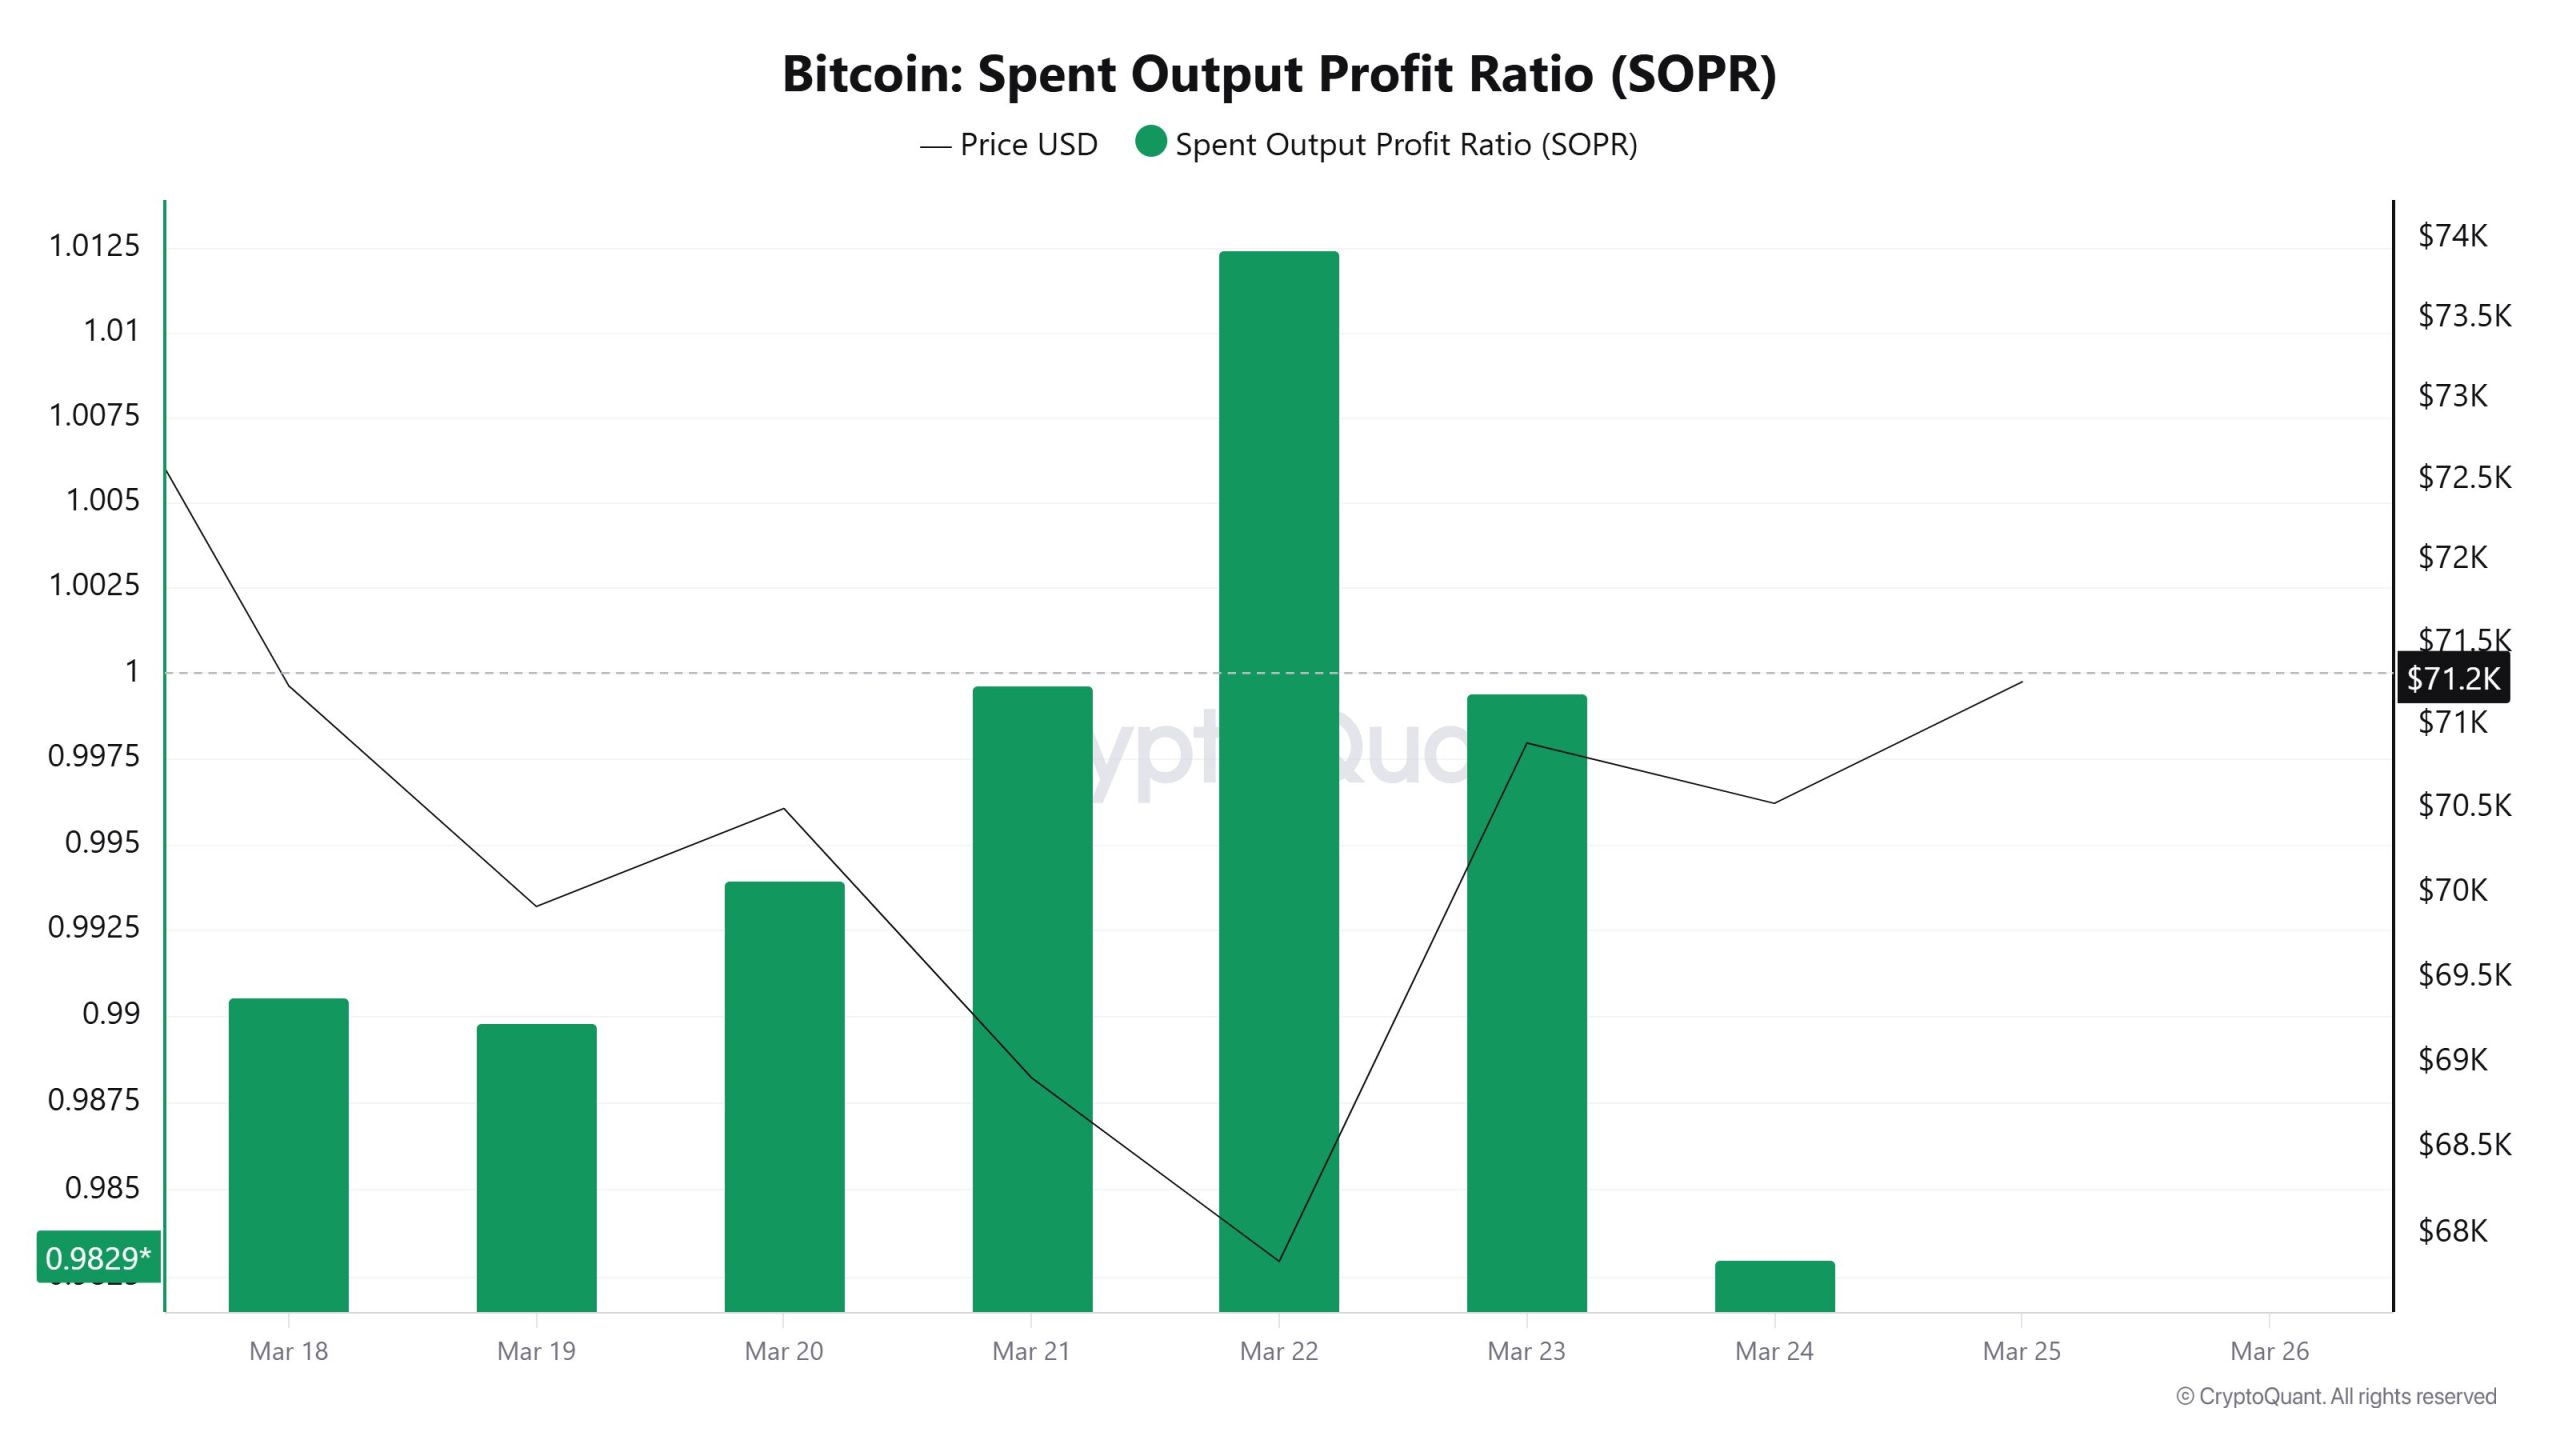
SOPR remained below the 1 level at the start of the week and dropped to 0.98 on March 22. This indicates that loss-making sales increased in the market that day. A rapid recovery followed, and it approached the 1 level again on March 23. A slight weakening was observed again on March 24.
The overall picture suggests that selling pressure increased temporarily but was not sustained.
Derivatives
Open Interest
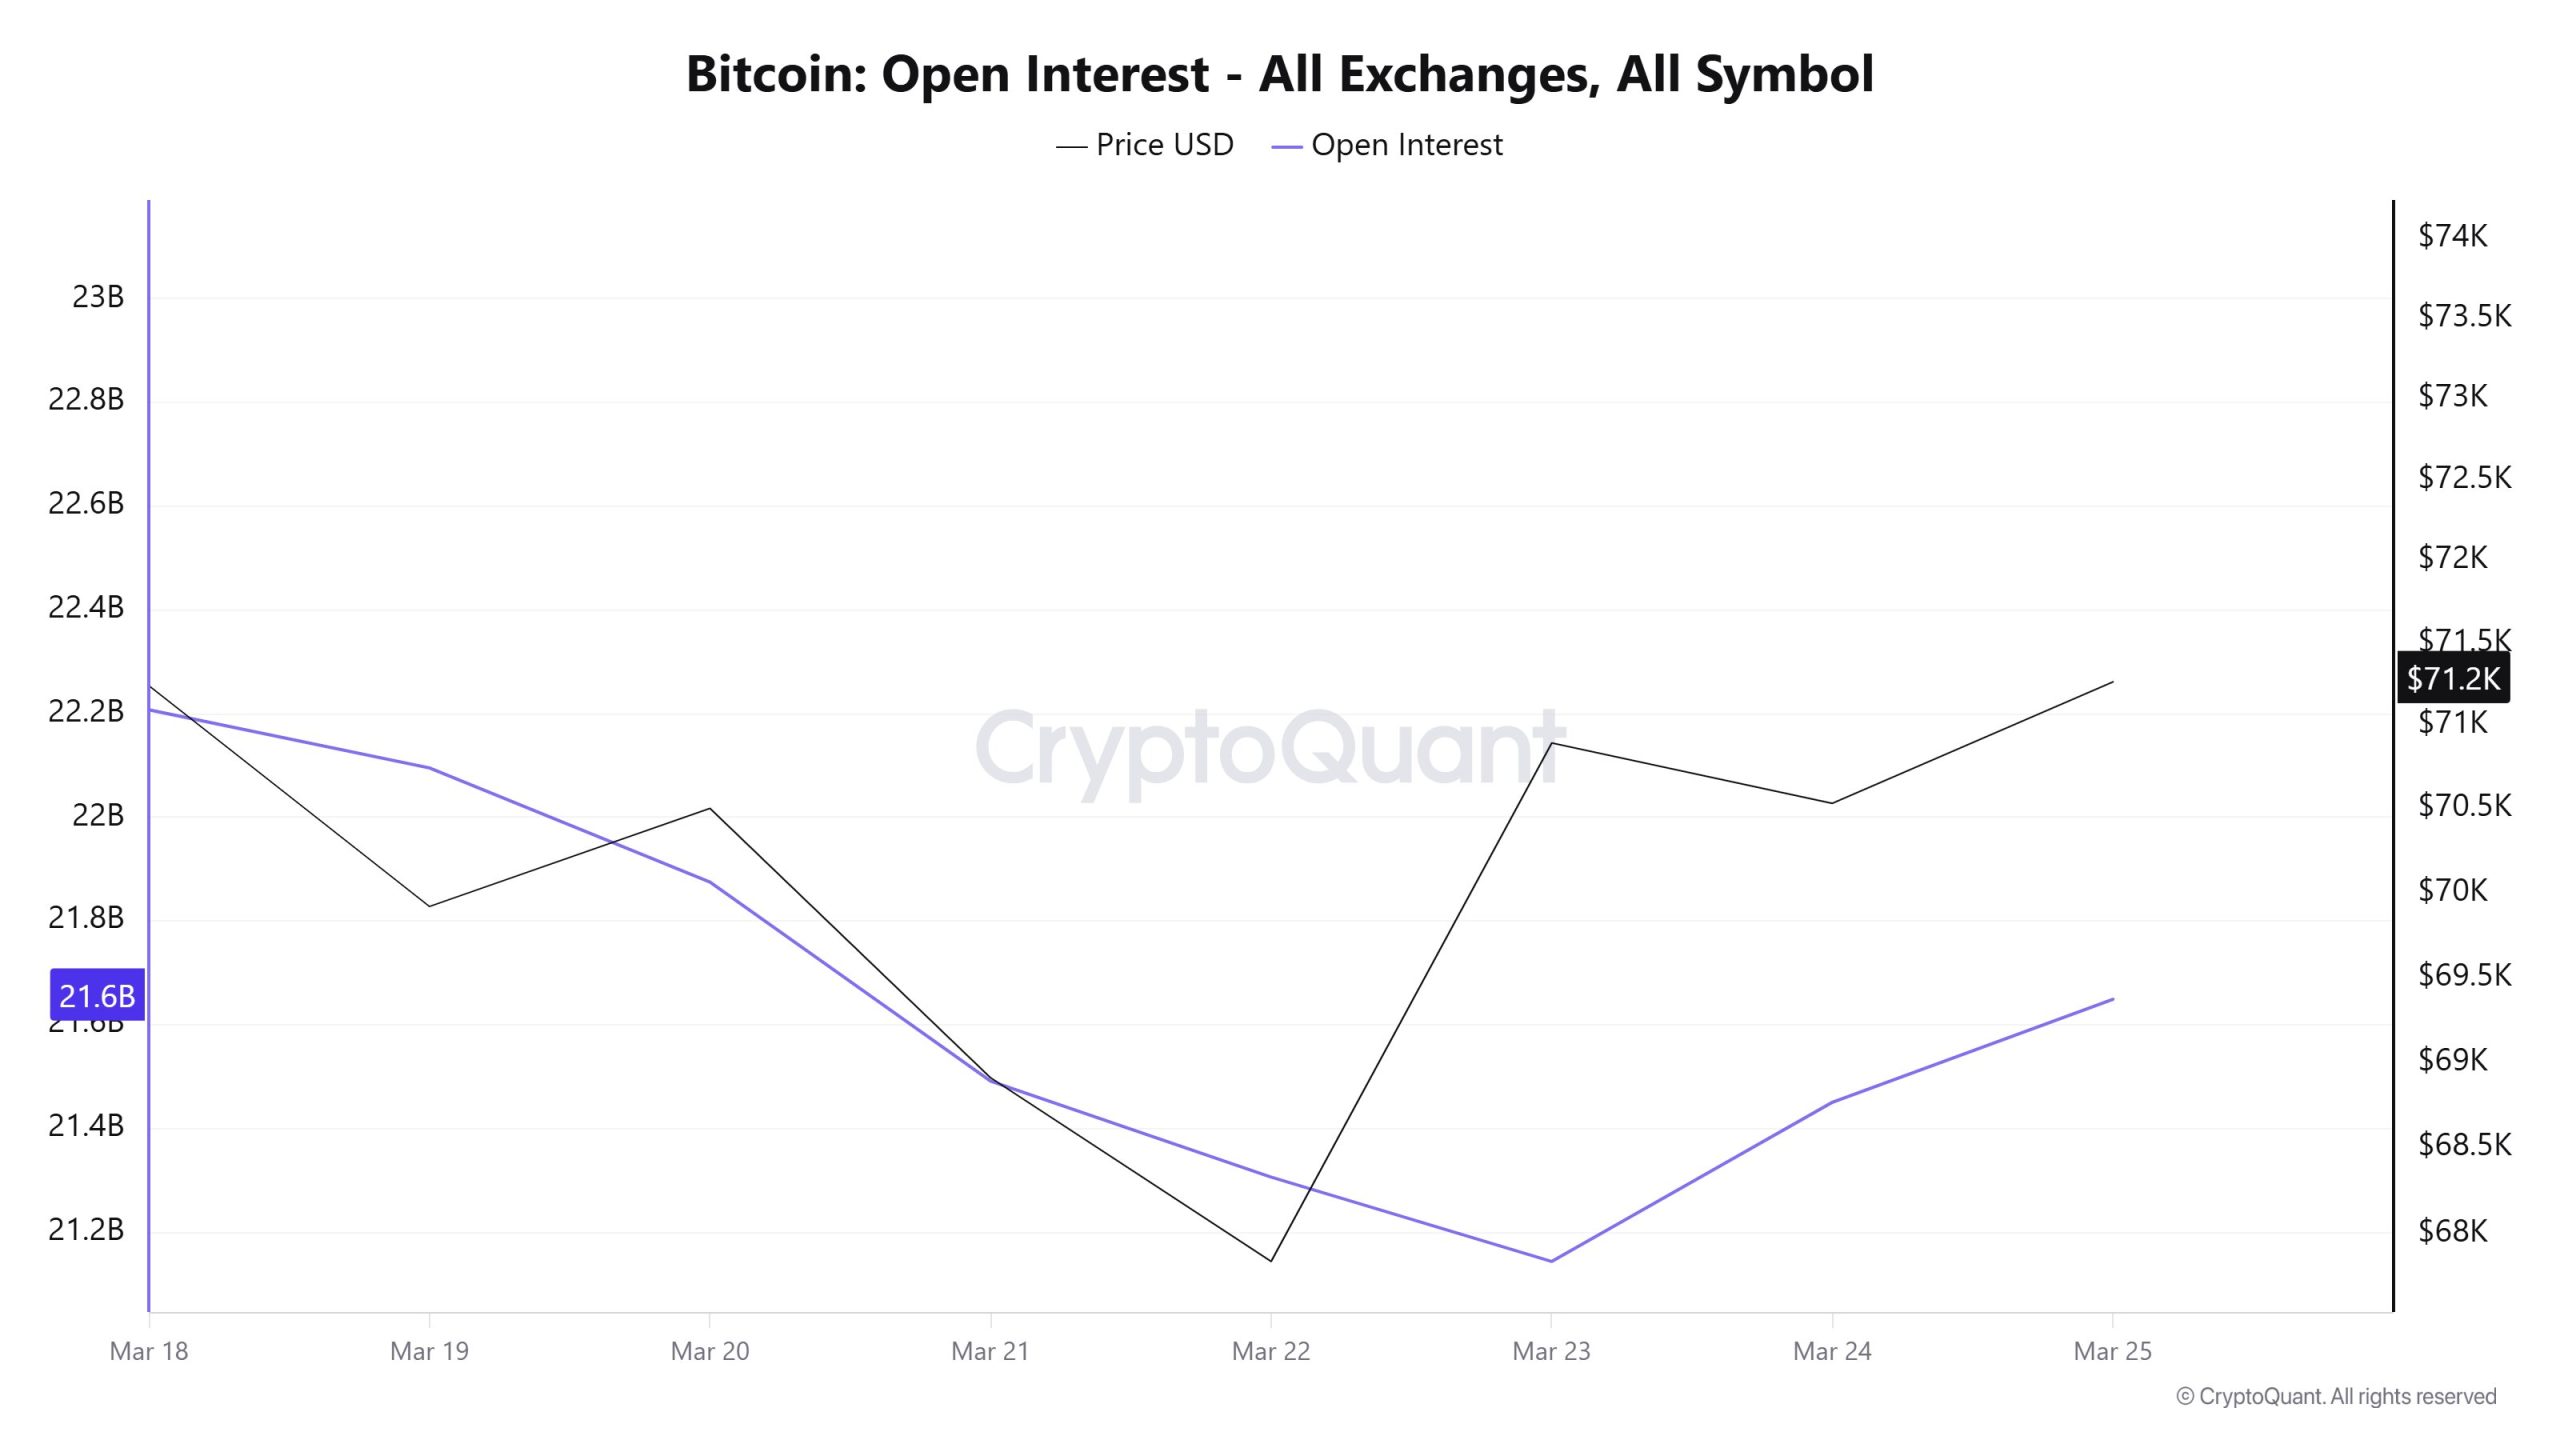
Open Interest stood at approximately $22.2 billion at the start of the week. It declined to around $21.1 billion by March 22. It then surged strongly, rising above $22.2 billion again on March 23. By the end of the week, it had stabilized around $21.6 billion. This movement indicates that positions were first closed out, followed by new positions being opened. In other words, the market went through both a liquidation and a re-entry phase.
Funding Rate
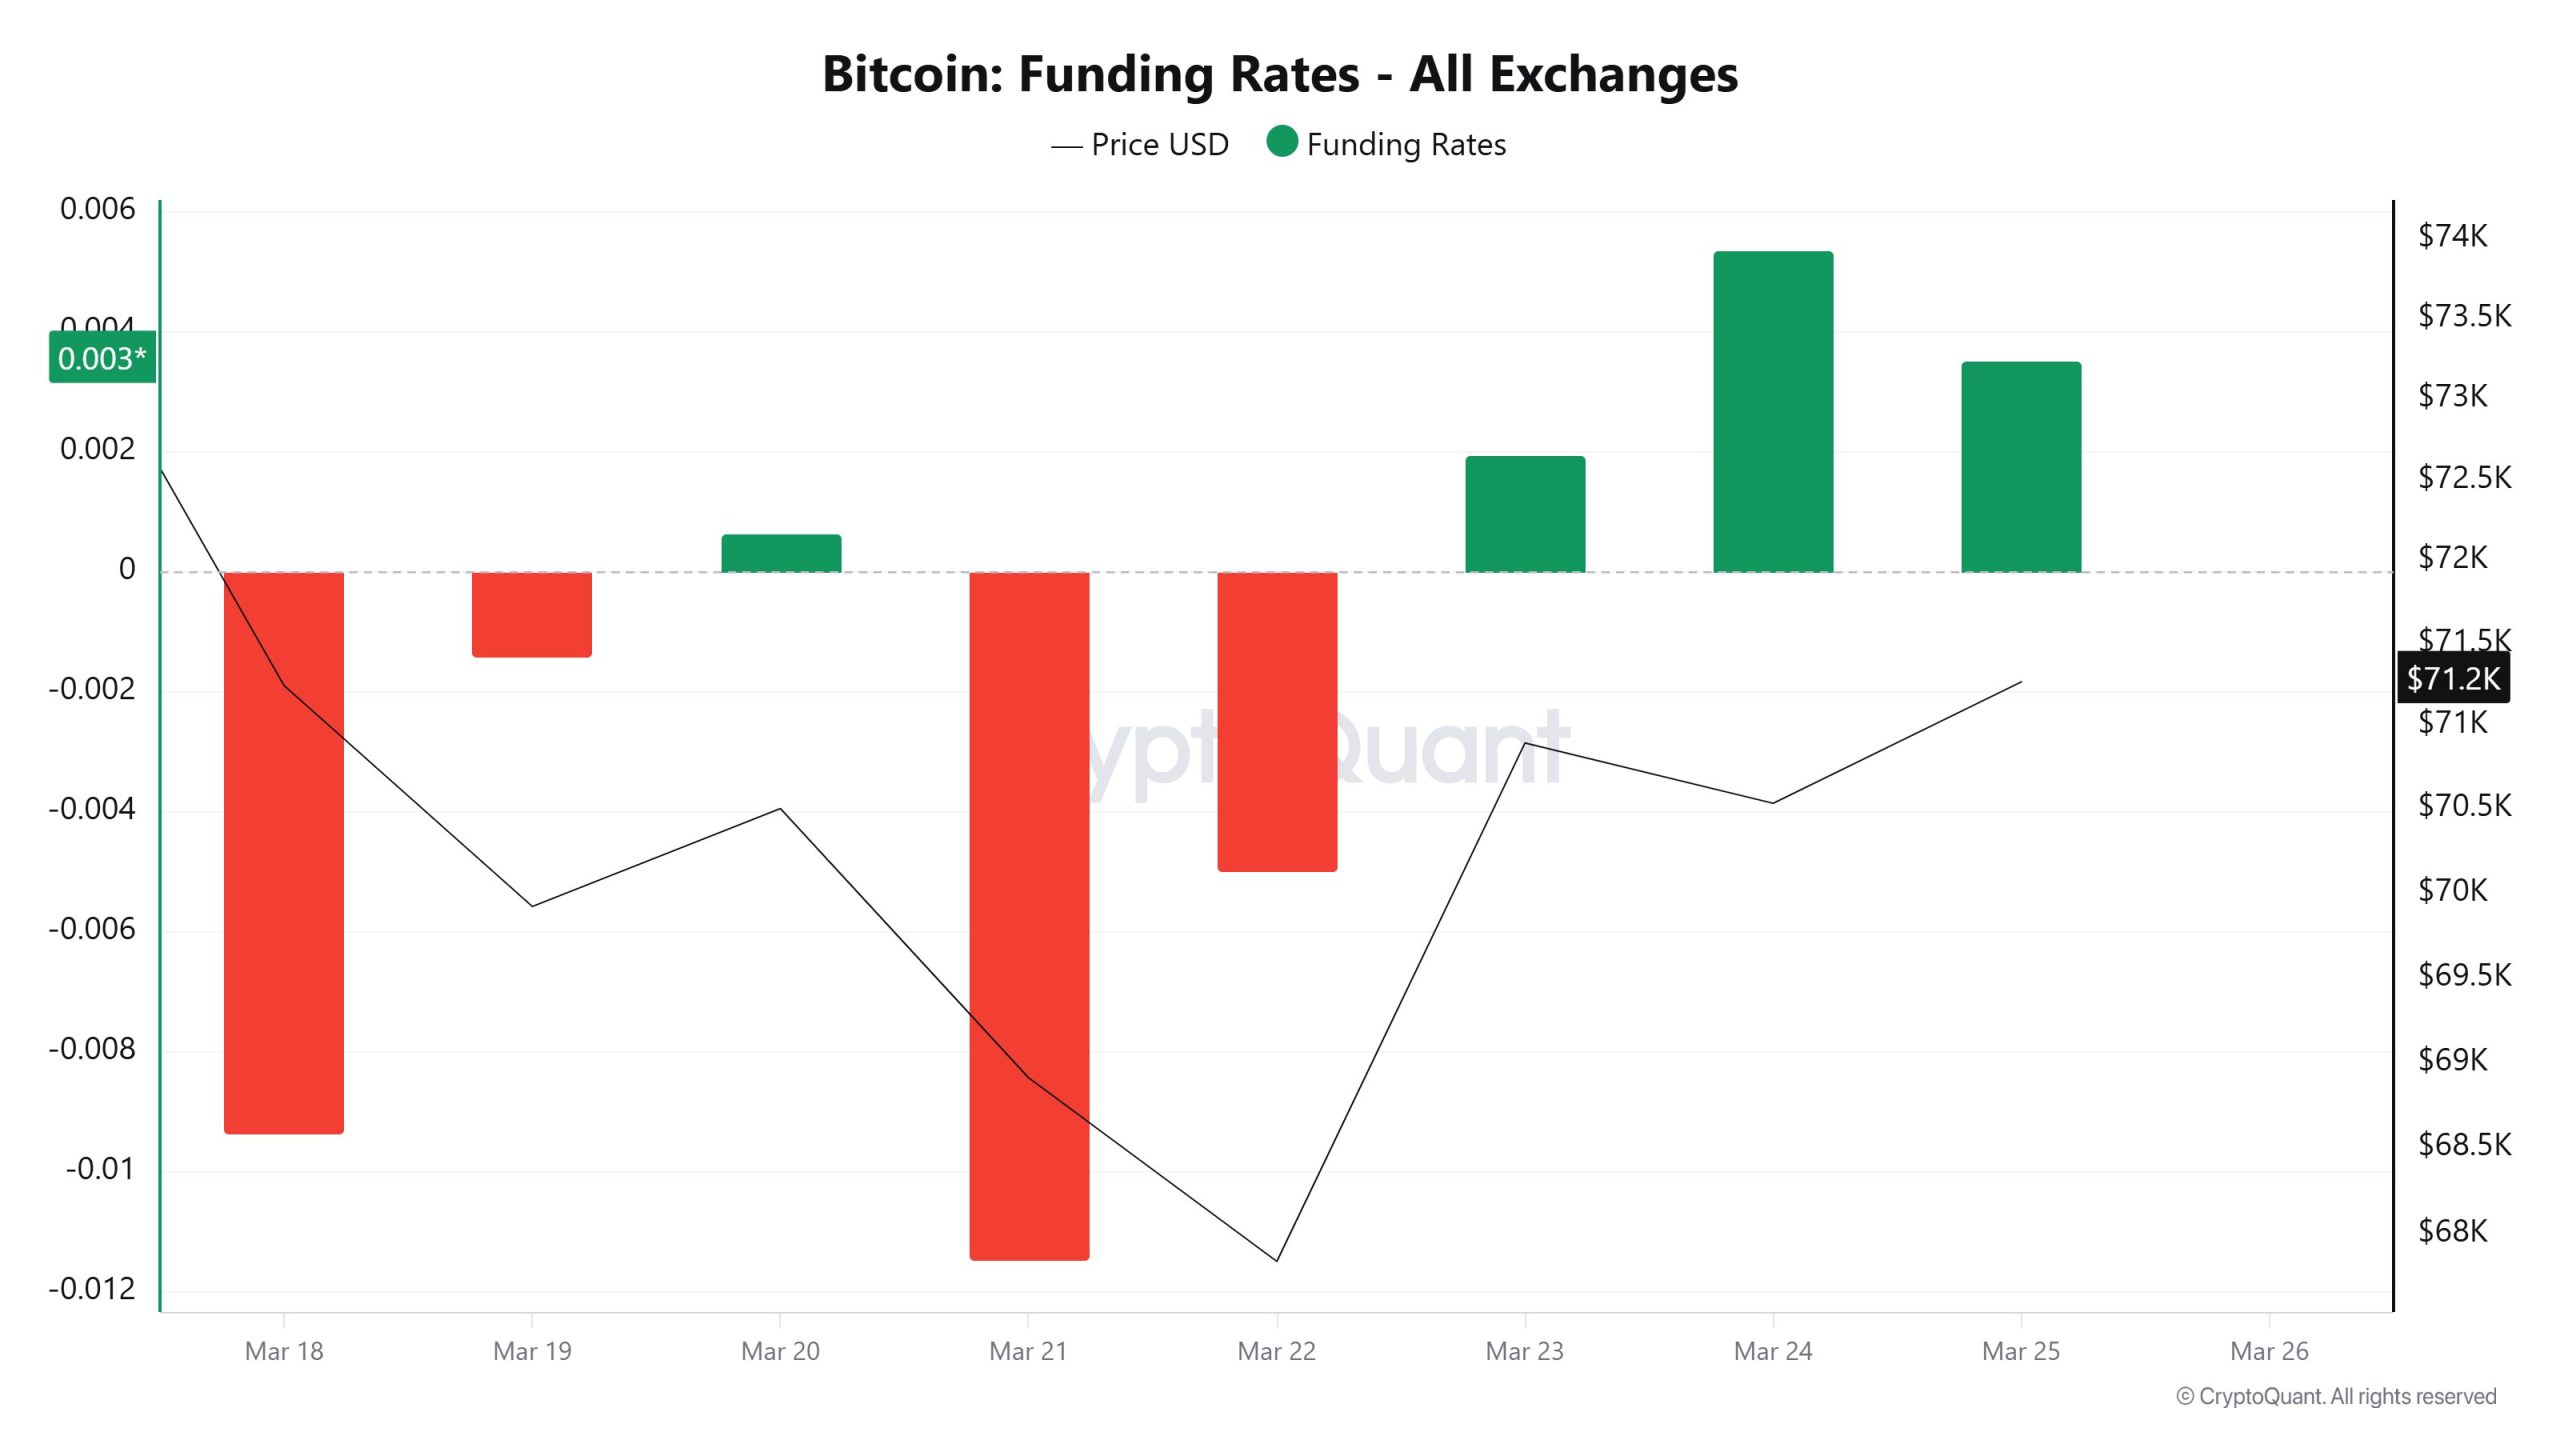
The funding rate started the week in negative territory. Negative rates deepened further on March 21–22. It turned positive starting March 23 and rose more noticeably on March 24–25.
This shift indicates that short positions initially dominated, followed by a strengthening of the long side. By the end of the week, the market had shifted toward a more bullish outlook.
Long & Short Liquidations
The BTC price fell from the $74,500 level to $67,500 last week and then rebounded to the $71,000 level. Along with this volatility, $806 million in long positions and $659 million in short positions were liquidated.
| Date | Long Amount (Million $) | Short Amount (Million $) |
|---|---|---|
| March 18 | 104.48 | 11.62 |
| March 19 | 81.64 | 31.52 |
| March 20 | 27.24 | 25.83 |
| March 21 | 54.34 | 4.64 |
| March 22 | 282.24 | 32.83 |
| March 23 | 42.50 | 531.56 |
| March 24 | 214.24 | 21.84 |
| Total | 806.68 | 659.84 |
Exchange Supply Ratio
“Bitcoin Exchange Supply Ratio” Image to be Added
The Exchange Supply Ratio generally trended downward throughout the week. Although a slight increase was observed until March 20, a sharp drop occurred on March 22. It subsequently recovered but remained below the level seen at the start of the week.
This decline indicates that the amount of Bitcoin on exchanges has decreased. In other words, investors continue to withdraw their coins from exchanges. This situation generally signals that selling pressure remains limited.
BTC On-Chain Overview
| Metric | Positive 📈 | Negative 📉 | Neutral ➖ |
|---|---|---|---|
| Active Addresses | ✓ | ||
| Breakdowns | ✓ | ||
| Derivatives | ✓ | ||
| Exchange Supply Ratio | ✓ |
- The metrics and guidance provided in the table do not alone explain or imply any expectation of future price changes for any asset. Digital asset prices can fluctuate based on many different variables. The on-chain analysis and related guidance are intended to assist investors in their decision-making process; however, basing financial investments solely on the results of this analysis may lead to unfavorable outcomes. Even if all metrics produce positive, negative, or neutral results simultaneously, the expected outcomes may not materialize depending on market conditions. Investors reviewing the report should take these warnings into consideration.
Legal Notice
The investment information, comments, and recommendations contained in this document do not constitute investment advisory services. Investment advisory services are provided by authorized institutions on a personalized basis, taking into account the risk and return preferences of individuals. The comments and recommendations contained in this document are of a general nature. These recommendations may not be suitable for your financial situation and risk and return preferences. Therefore, making an investment decision based solely on the information contained in this document may not result in outcomes that align with your expectations.
NOTE: All data used in Bitcoin on-chain analysis is based on CryptoQuant.
