
Active Addresses
Active Receiving Addresses
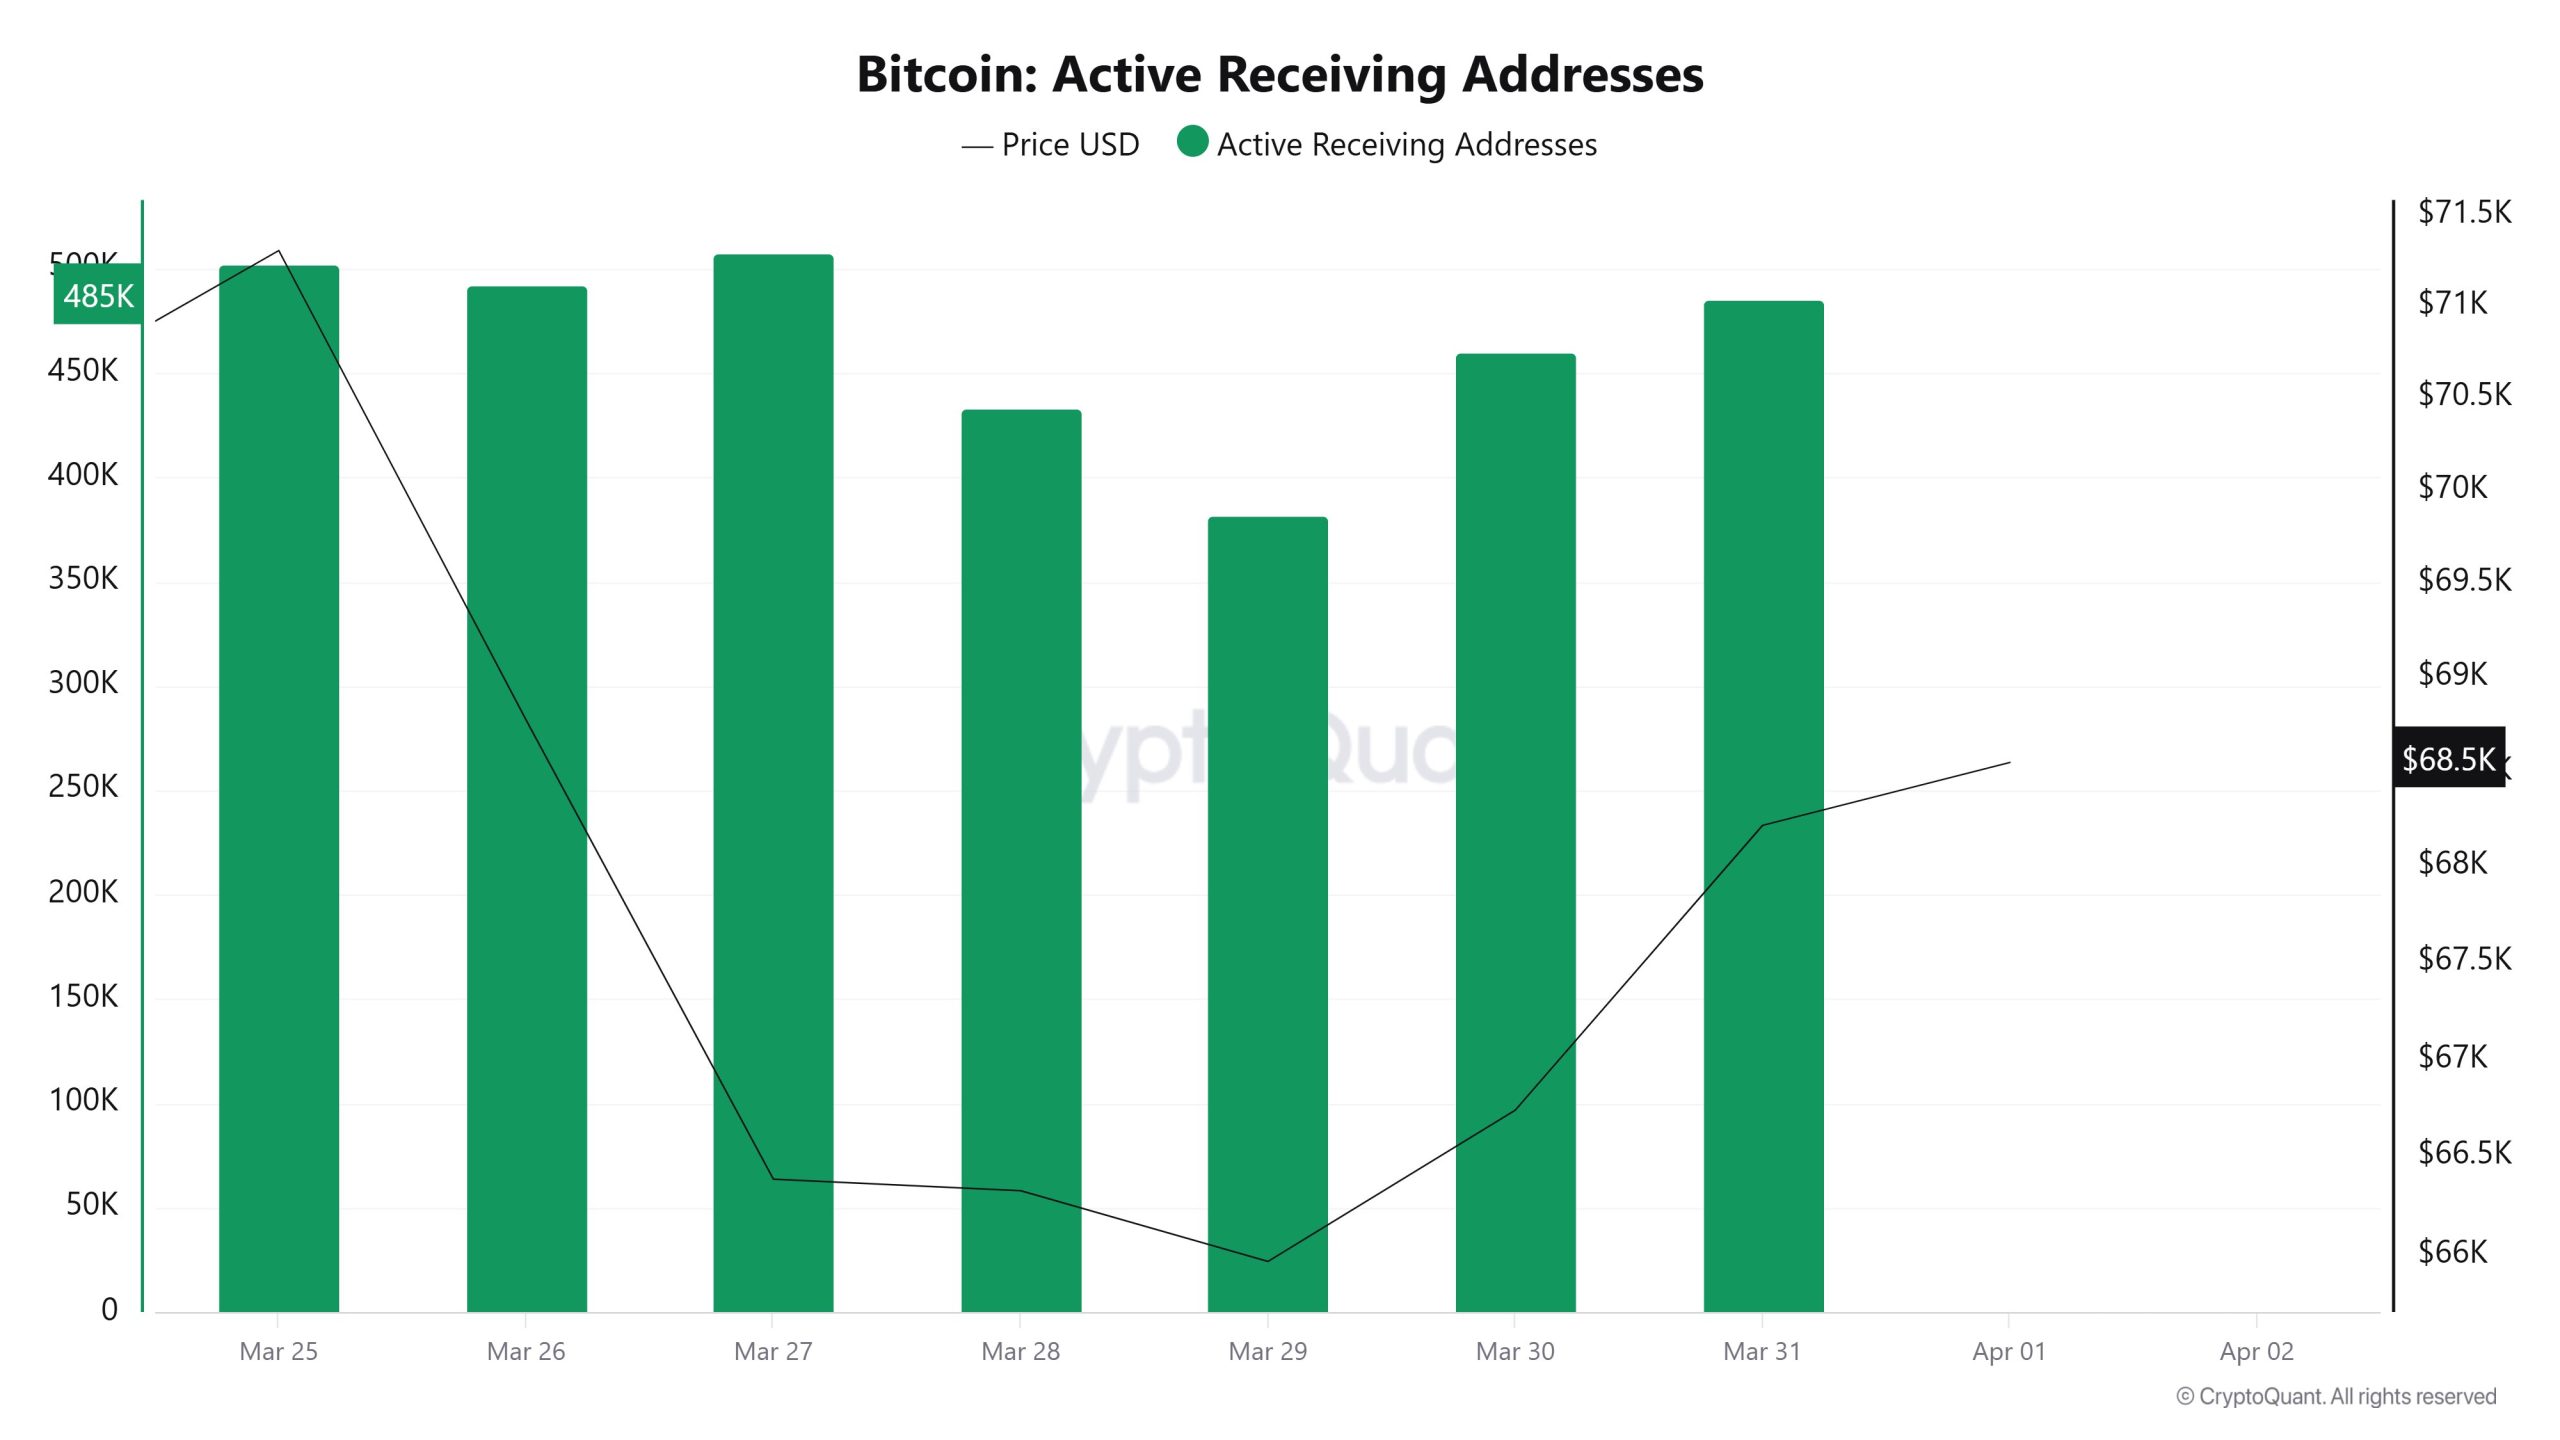
The number of receiving addresses was at a strong level in the 480K–500K range at the start of the week but dropped significantly to around 380K between March 27 and 29. This decline did not last long, and the number rebounded toward the end of the week, rising to the 460K–480K range. Following a brief period of weakness, activity on the network appears to be picking up again.
Active Sending Addresses
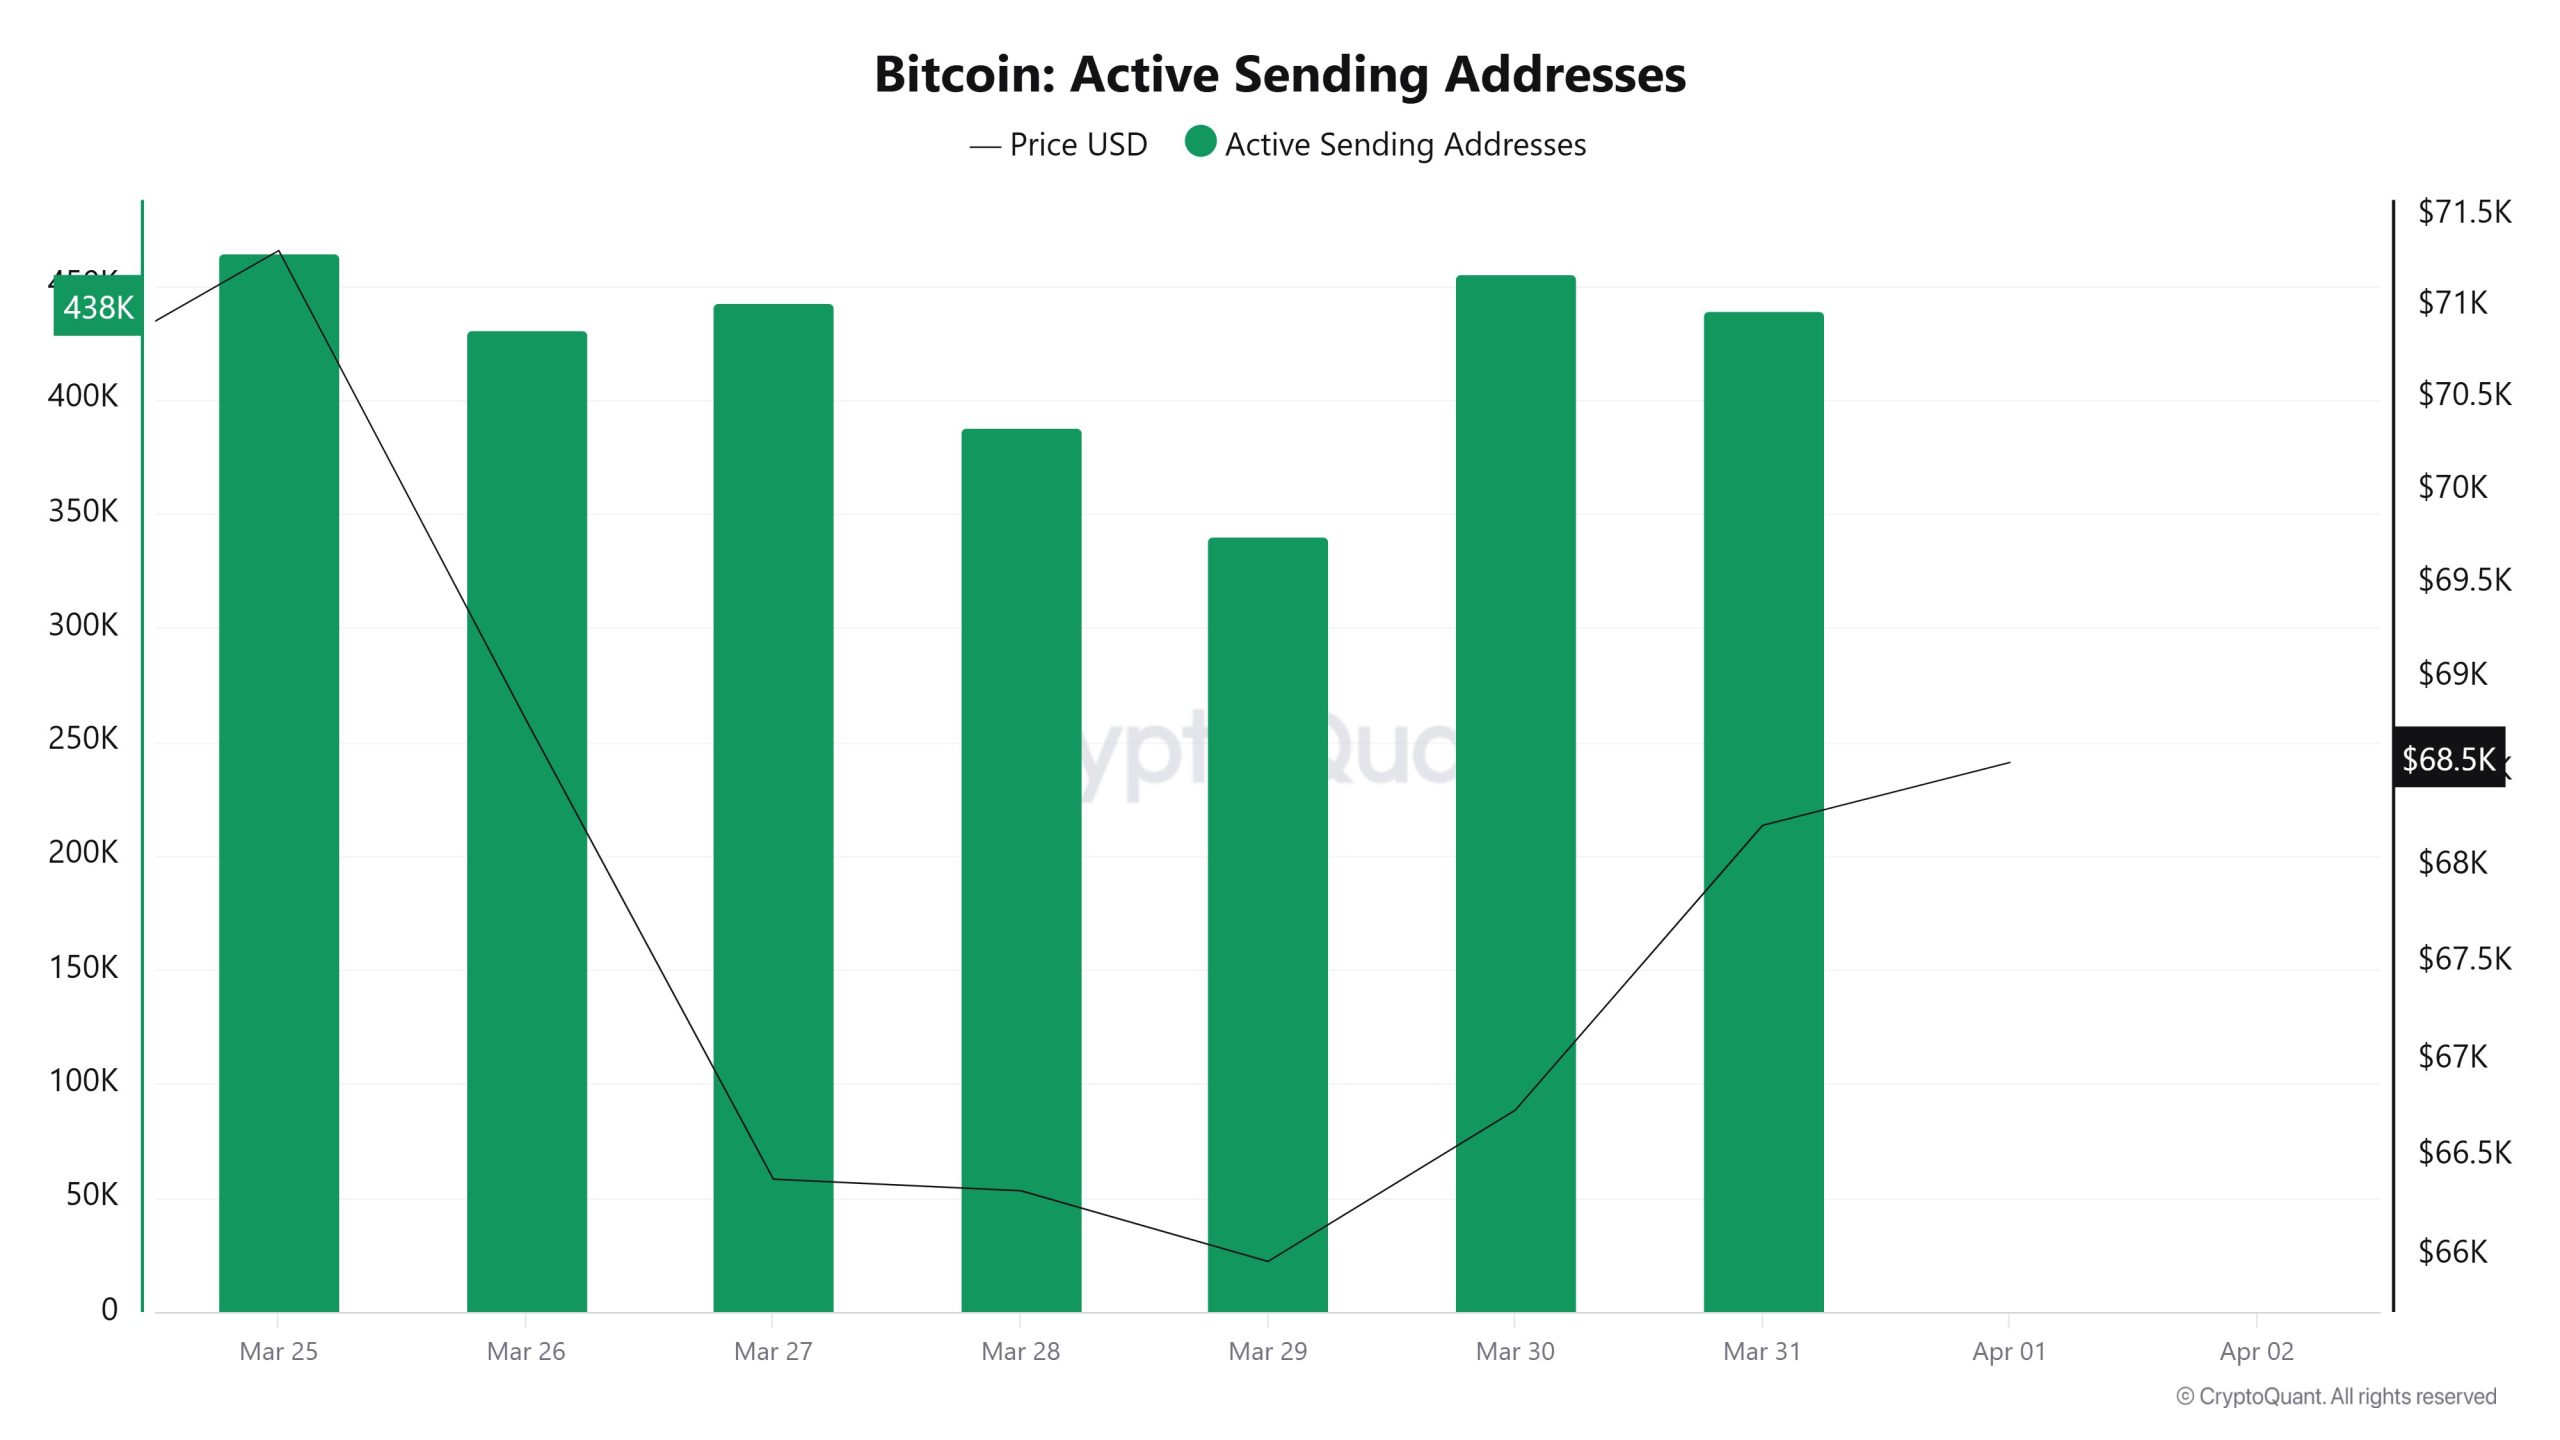
There is a similar pattern on the sending address side. The data, which had been hovering in the 430K–450K range at the start of the week, dropped to 330K during the period of March 27–29. It then rebounded, approaching the 430K range again toward the end of the week. Although there was a brief slowdown in transaction activity, there is no sign of a sustained decline.
Breakdowns
MVRV
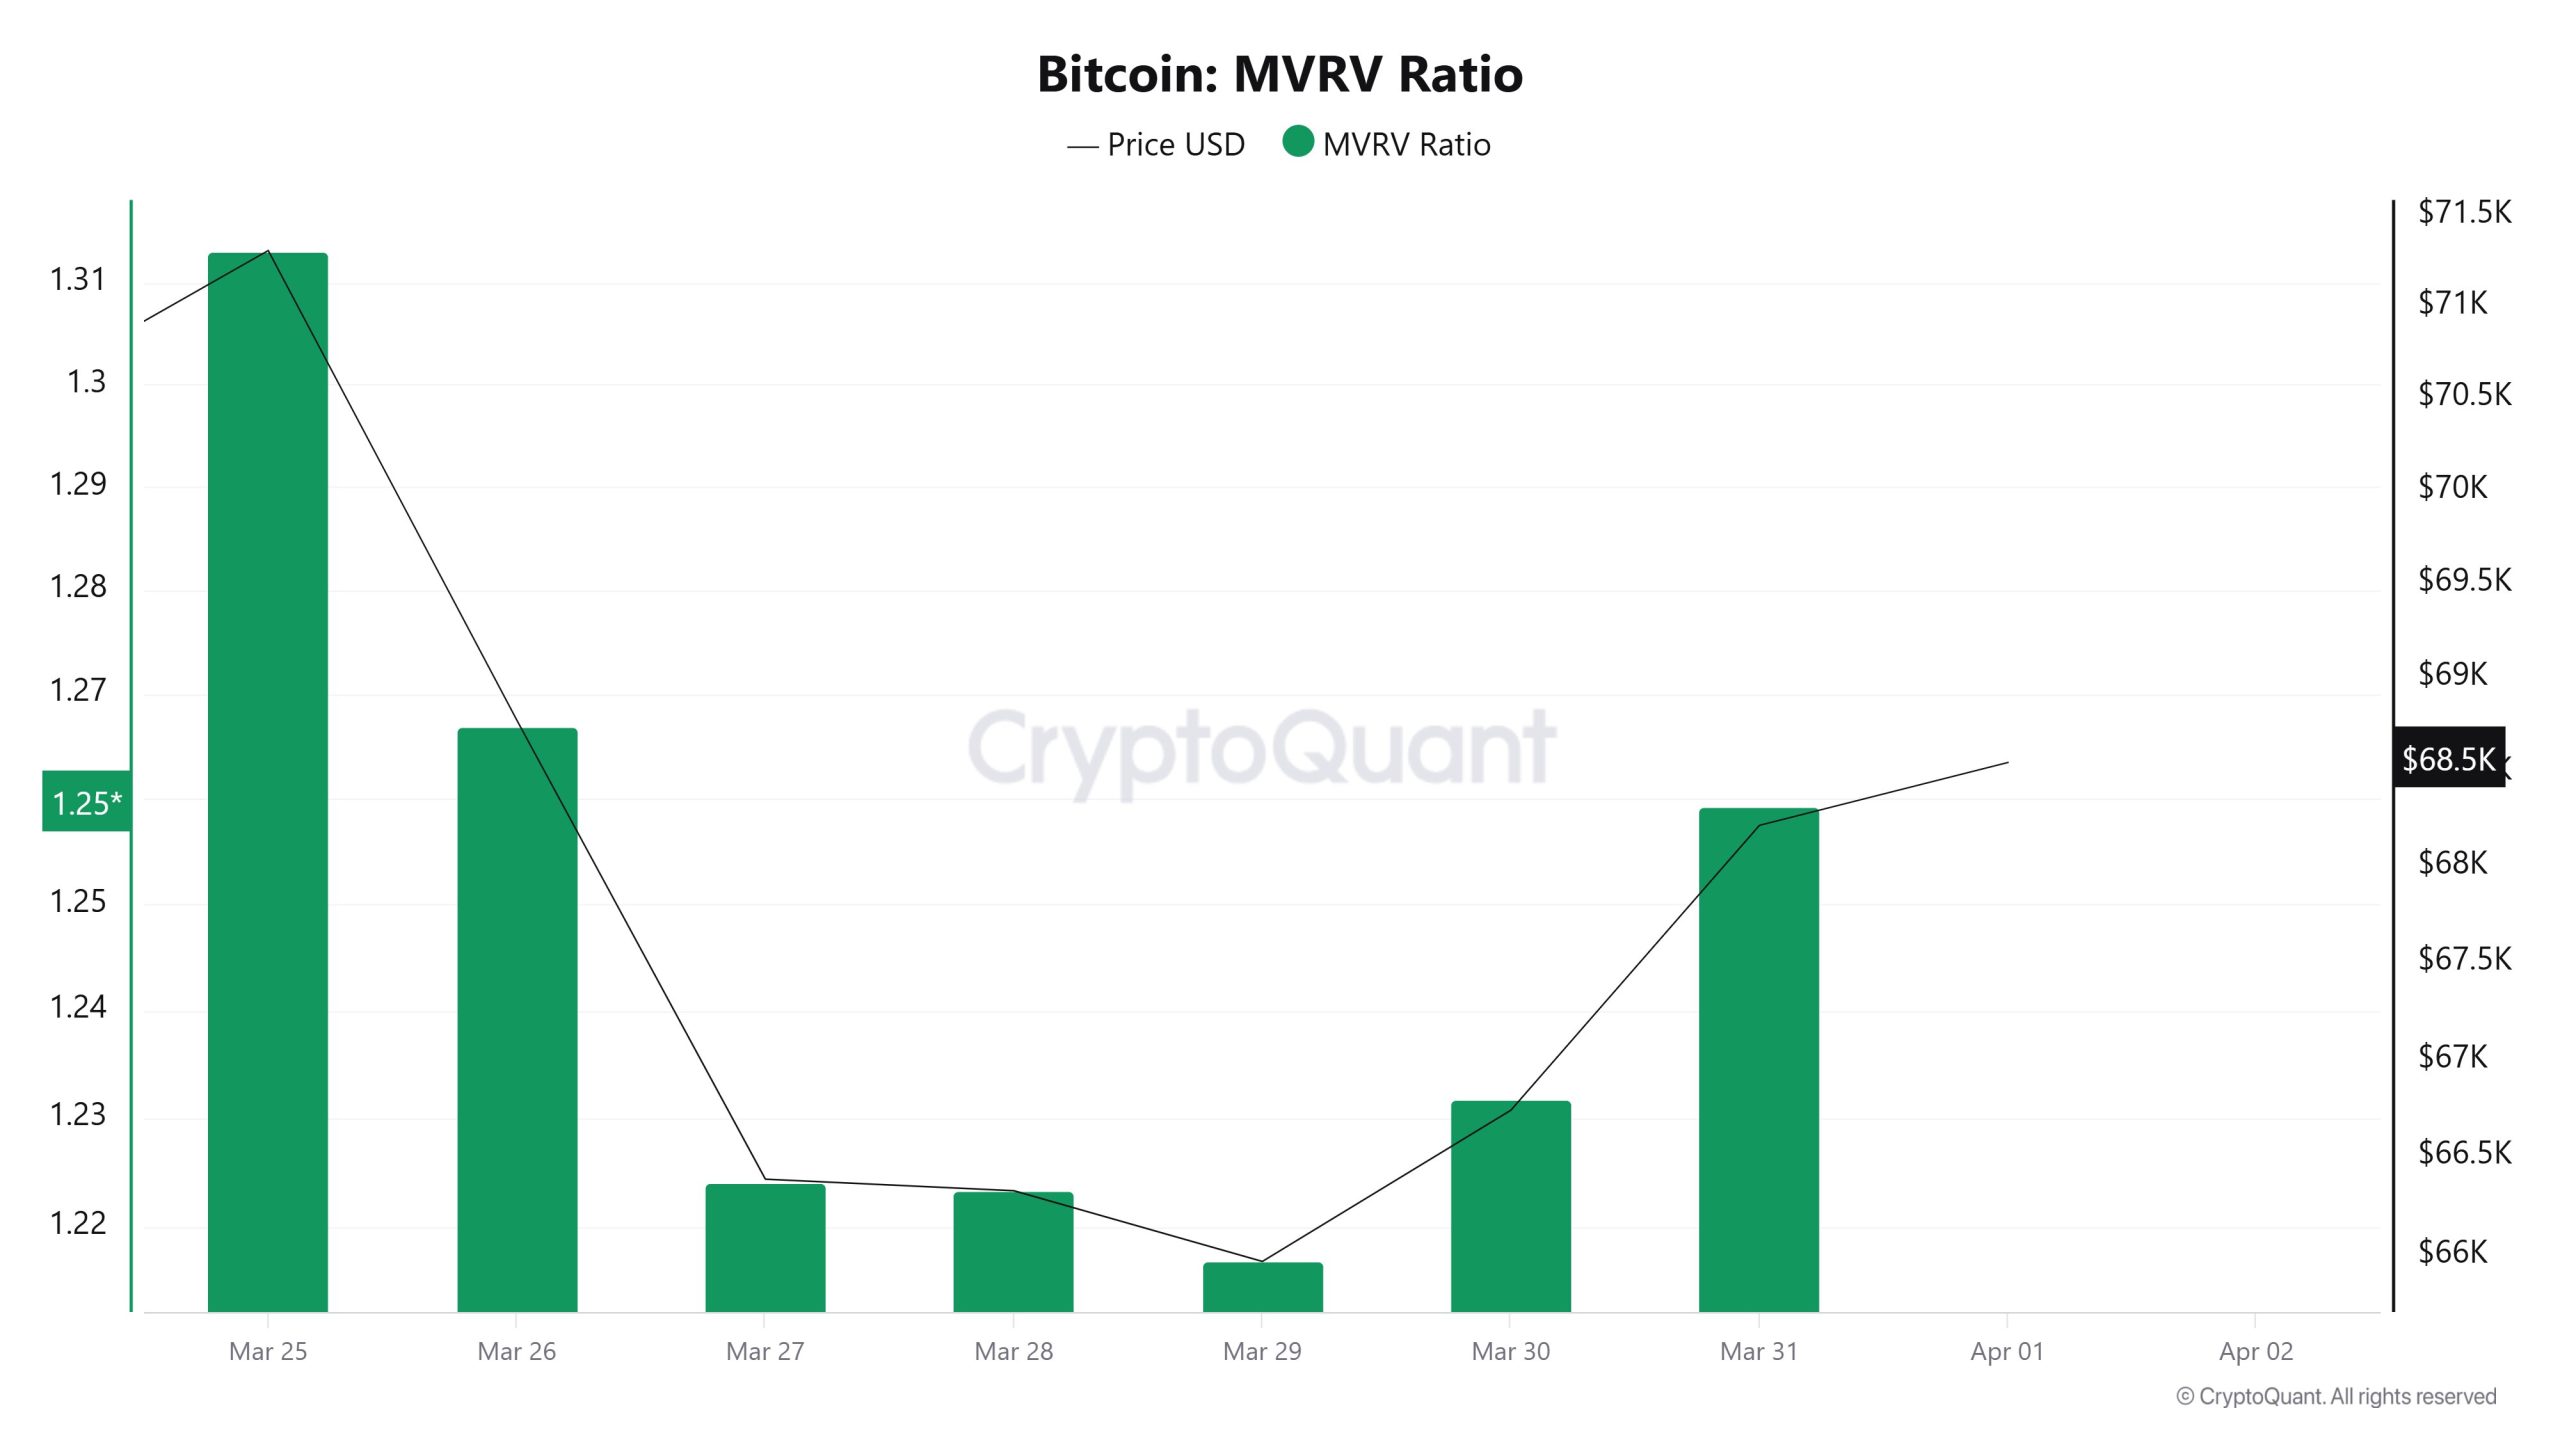
The MVRV ratio stood at 1.31 at the start of the week and declined to the 1.21–1.22 range. It recovered toward the end of the week, approaching the 1.25 level. While investors’ profit margins have generally narrowed, there has been a recovery in recent days.
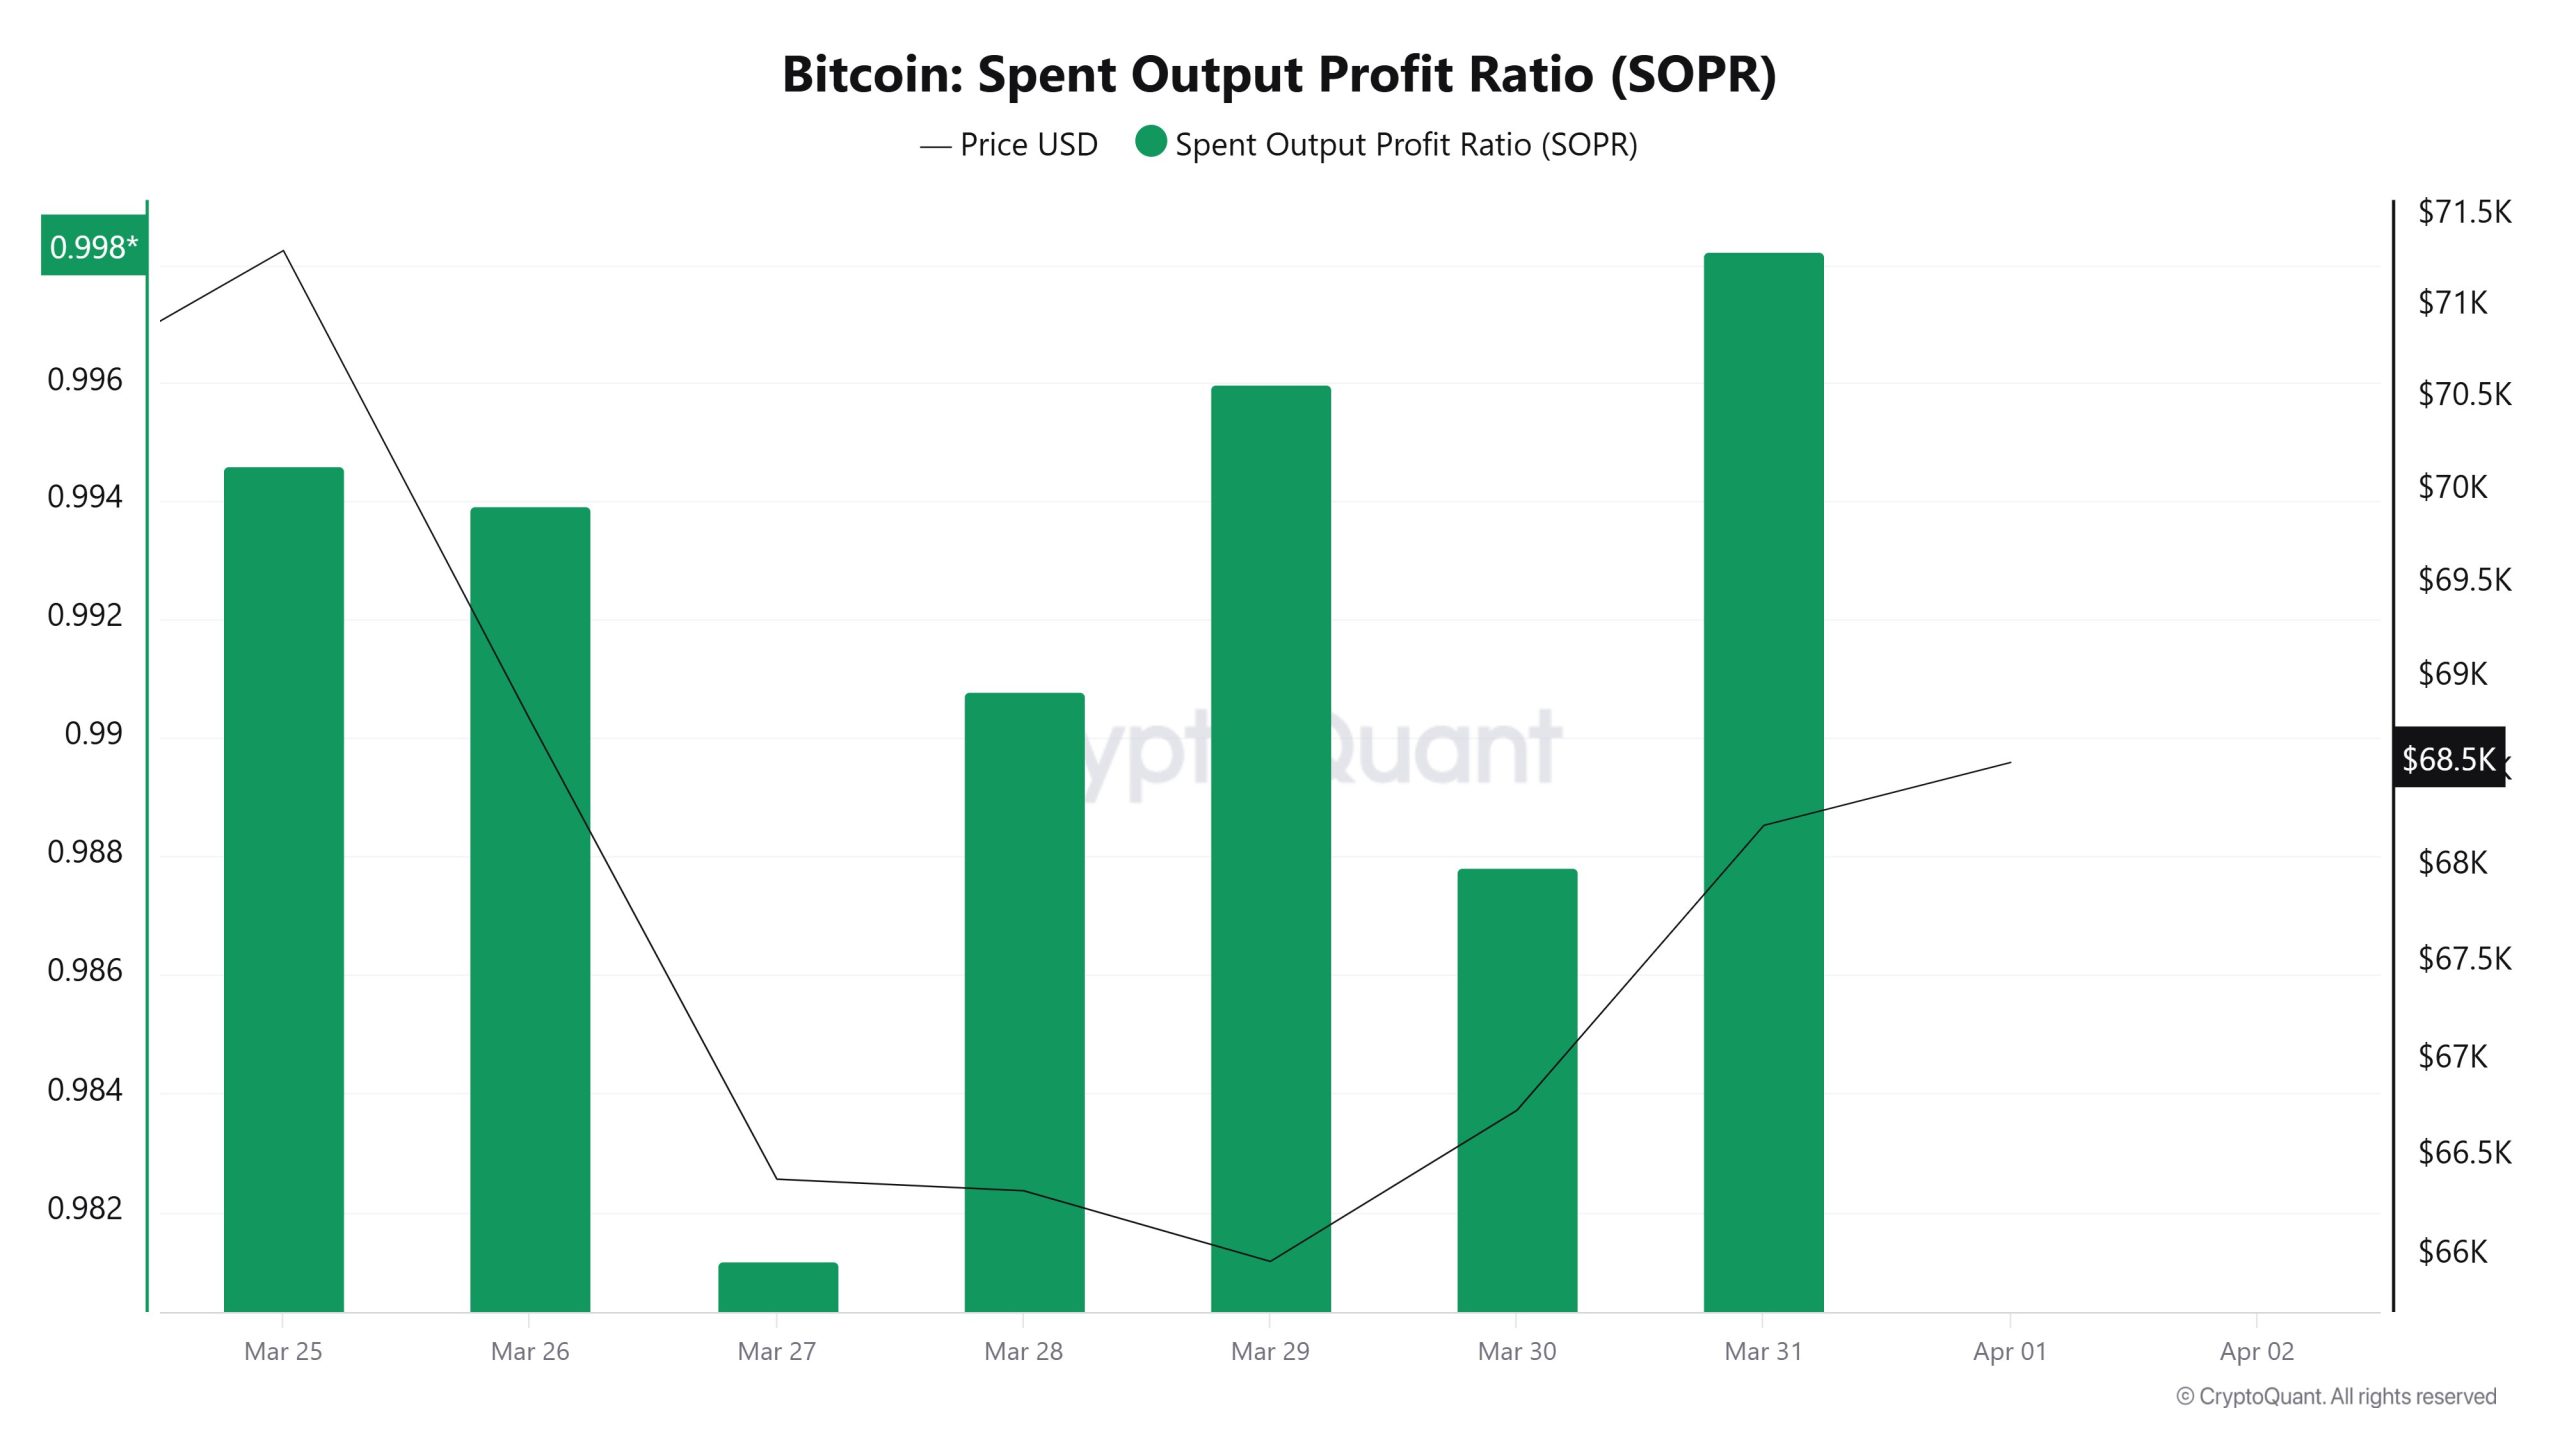
Spent Output Profit Ratio (SOPR)
SOPR started the week at around 0.99 and fell to 0.98 by March 27. It rose again toward the end of the week, approaching the 1.0 level. This pattern indicates that investors sold at a loss in the middle of the week but subsequently returned to selling at a profit.
Derivatives
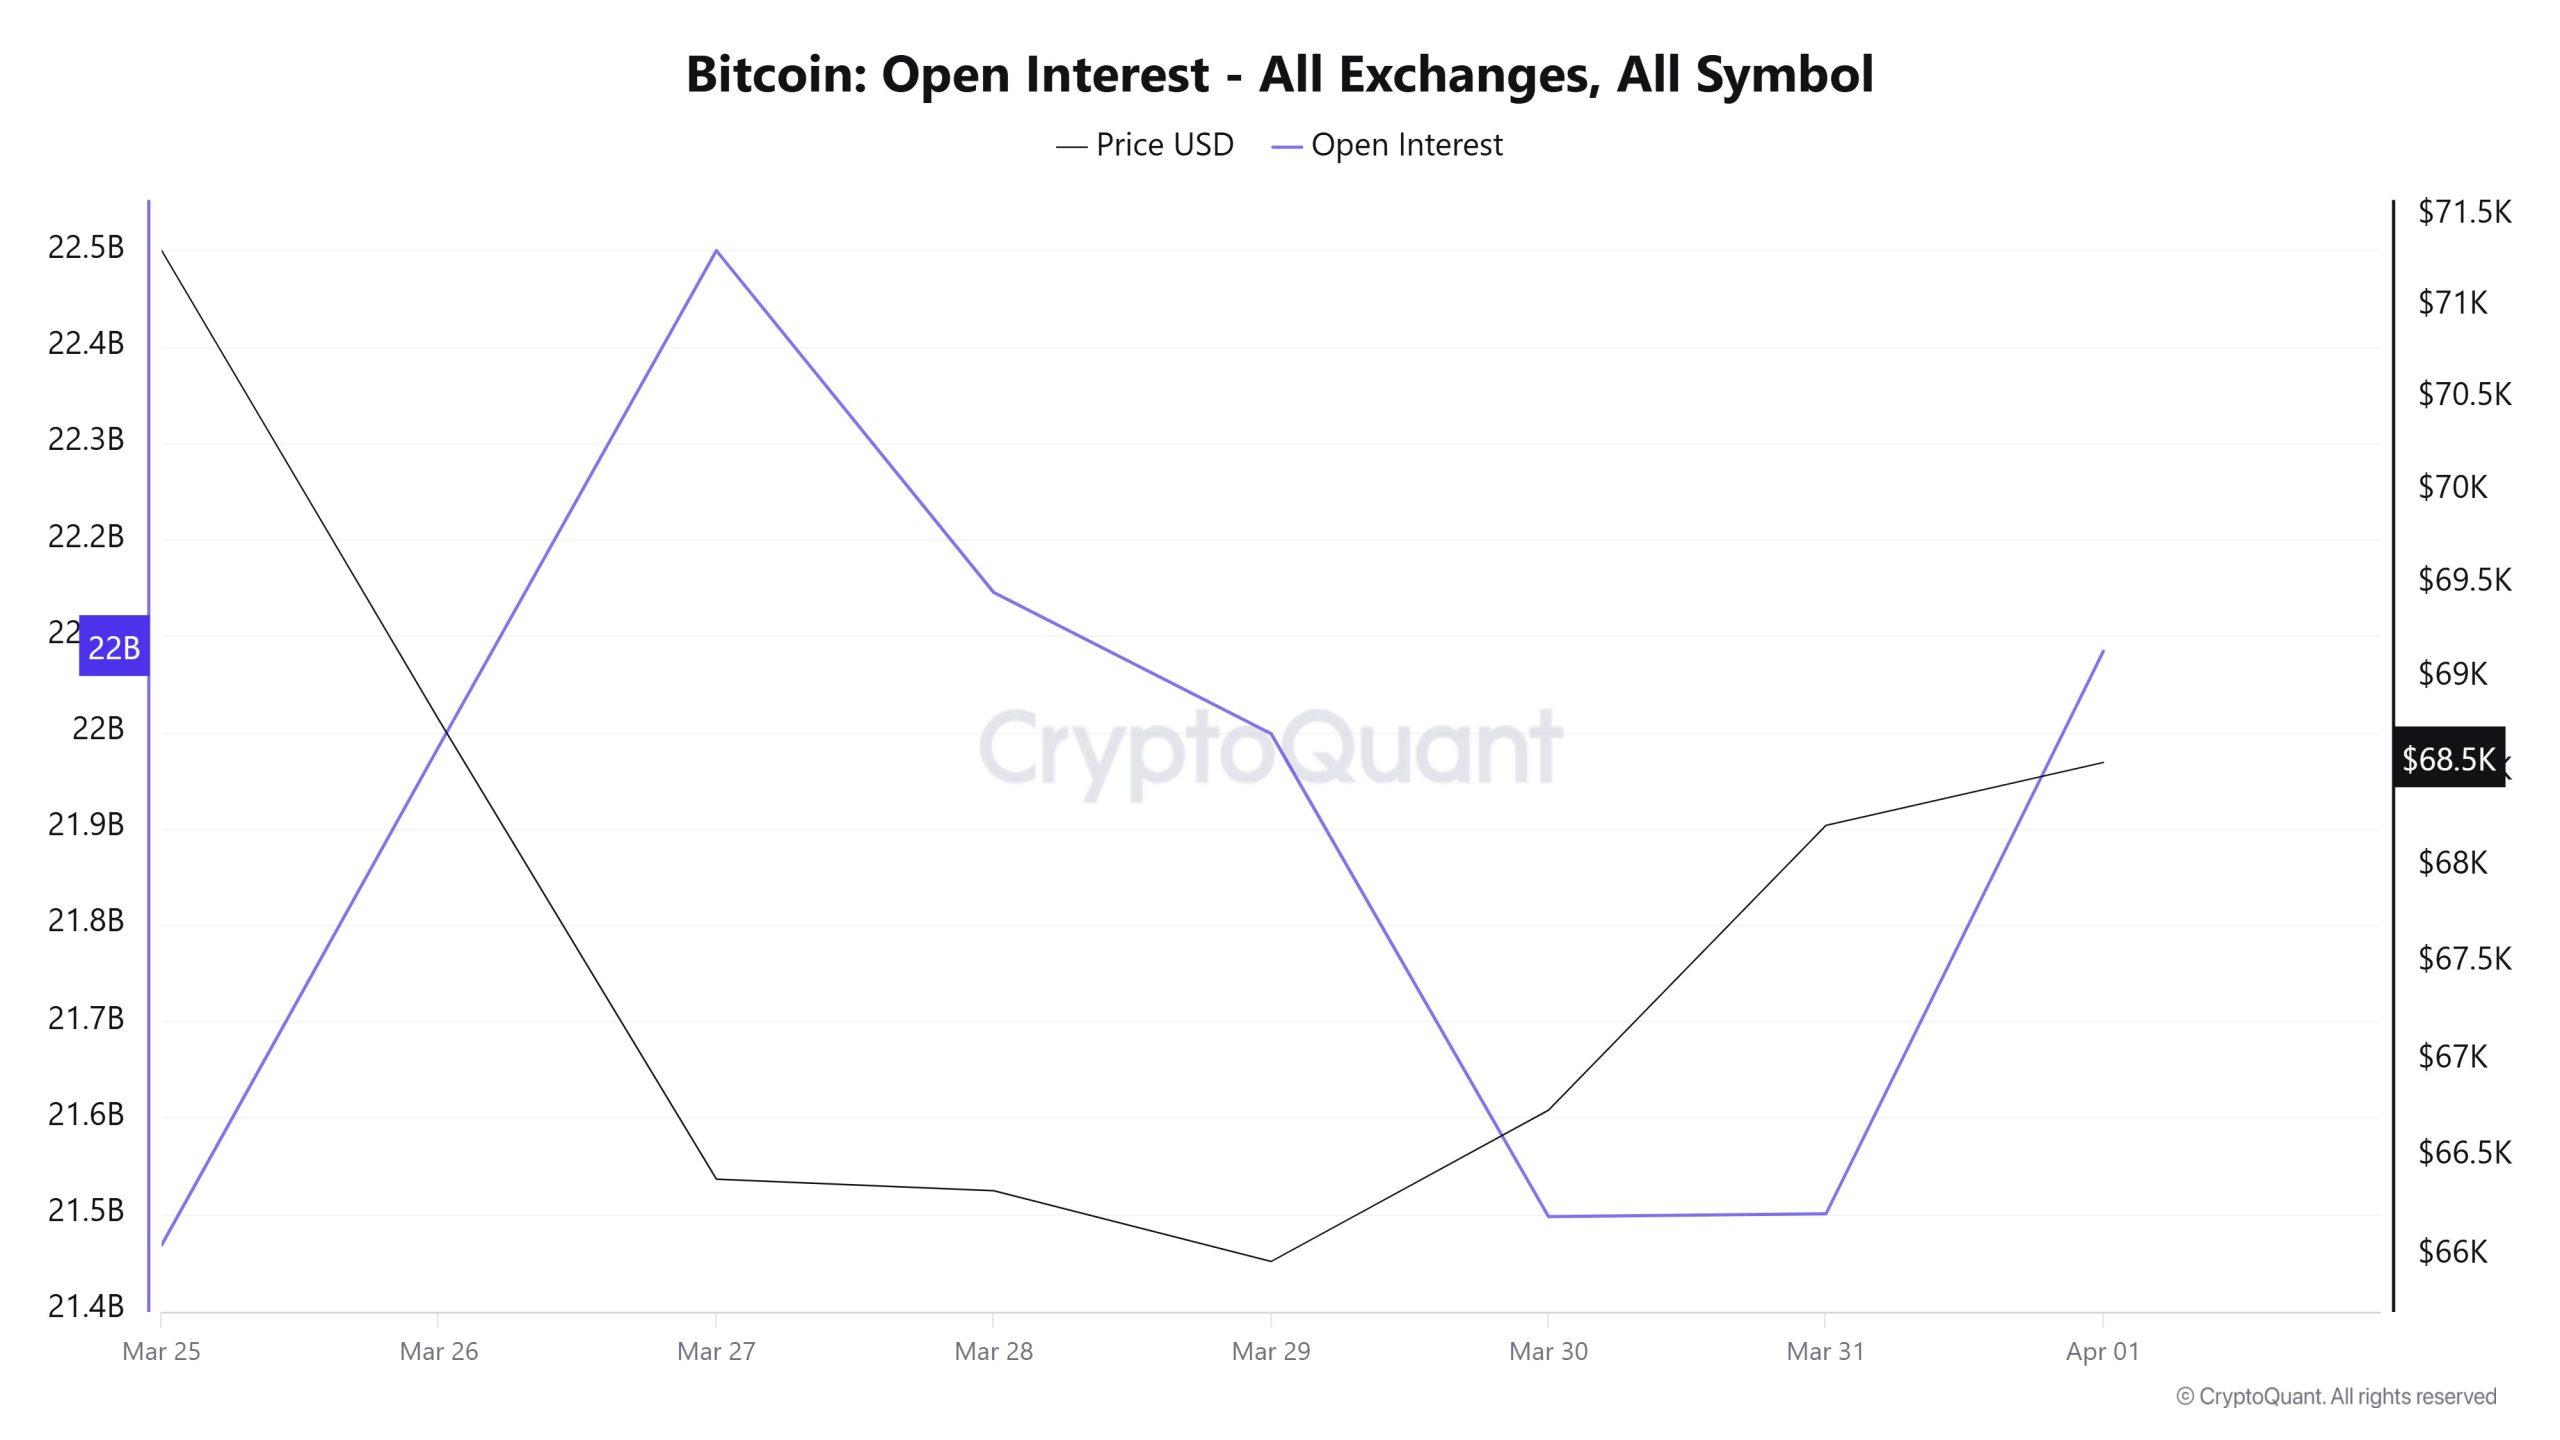
Open Interest
Open interest was around 21.5B at the start of the week and rose to 22.5B on March 27. It then fell sharply, retreating back to the 21.5B level. Toward the end of the week, it rose again, approaching the 22B level. It appears that leveraged positions in the market first increased, were then liquidated, and subsequently re-established.
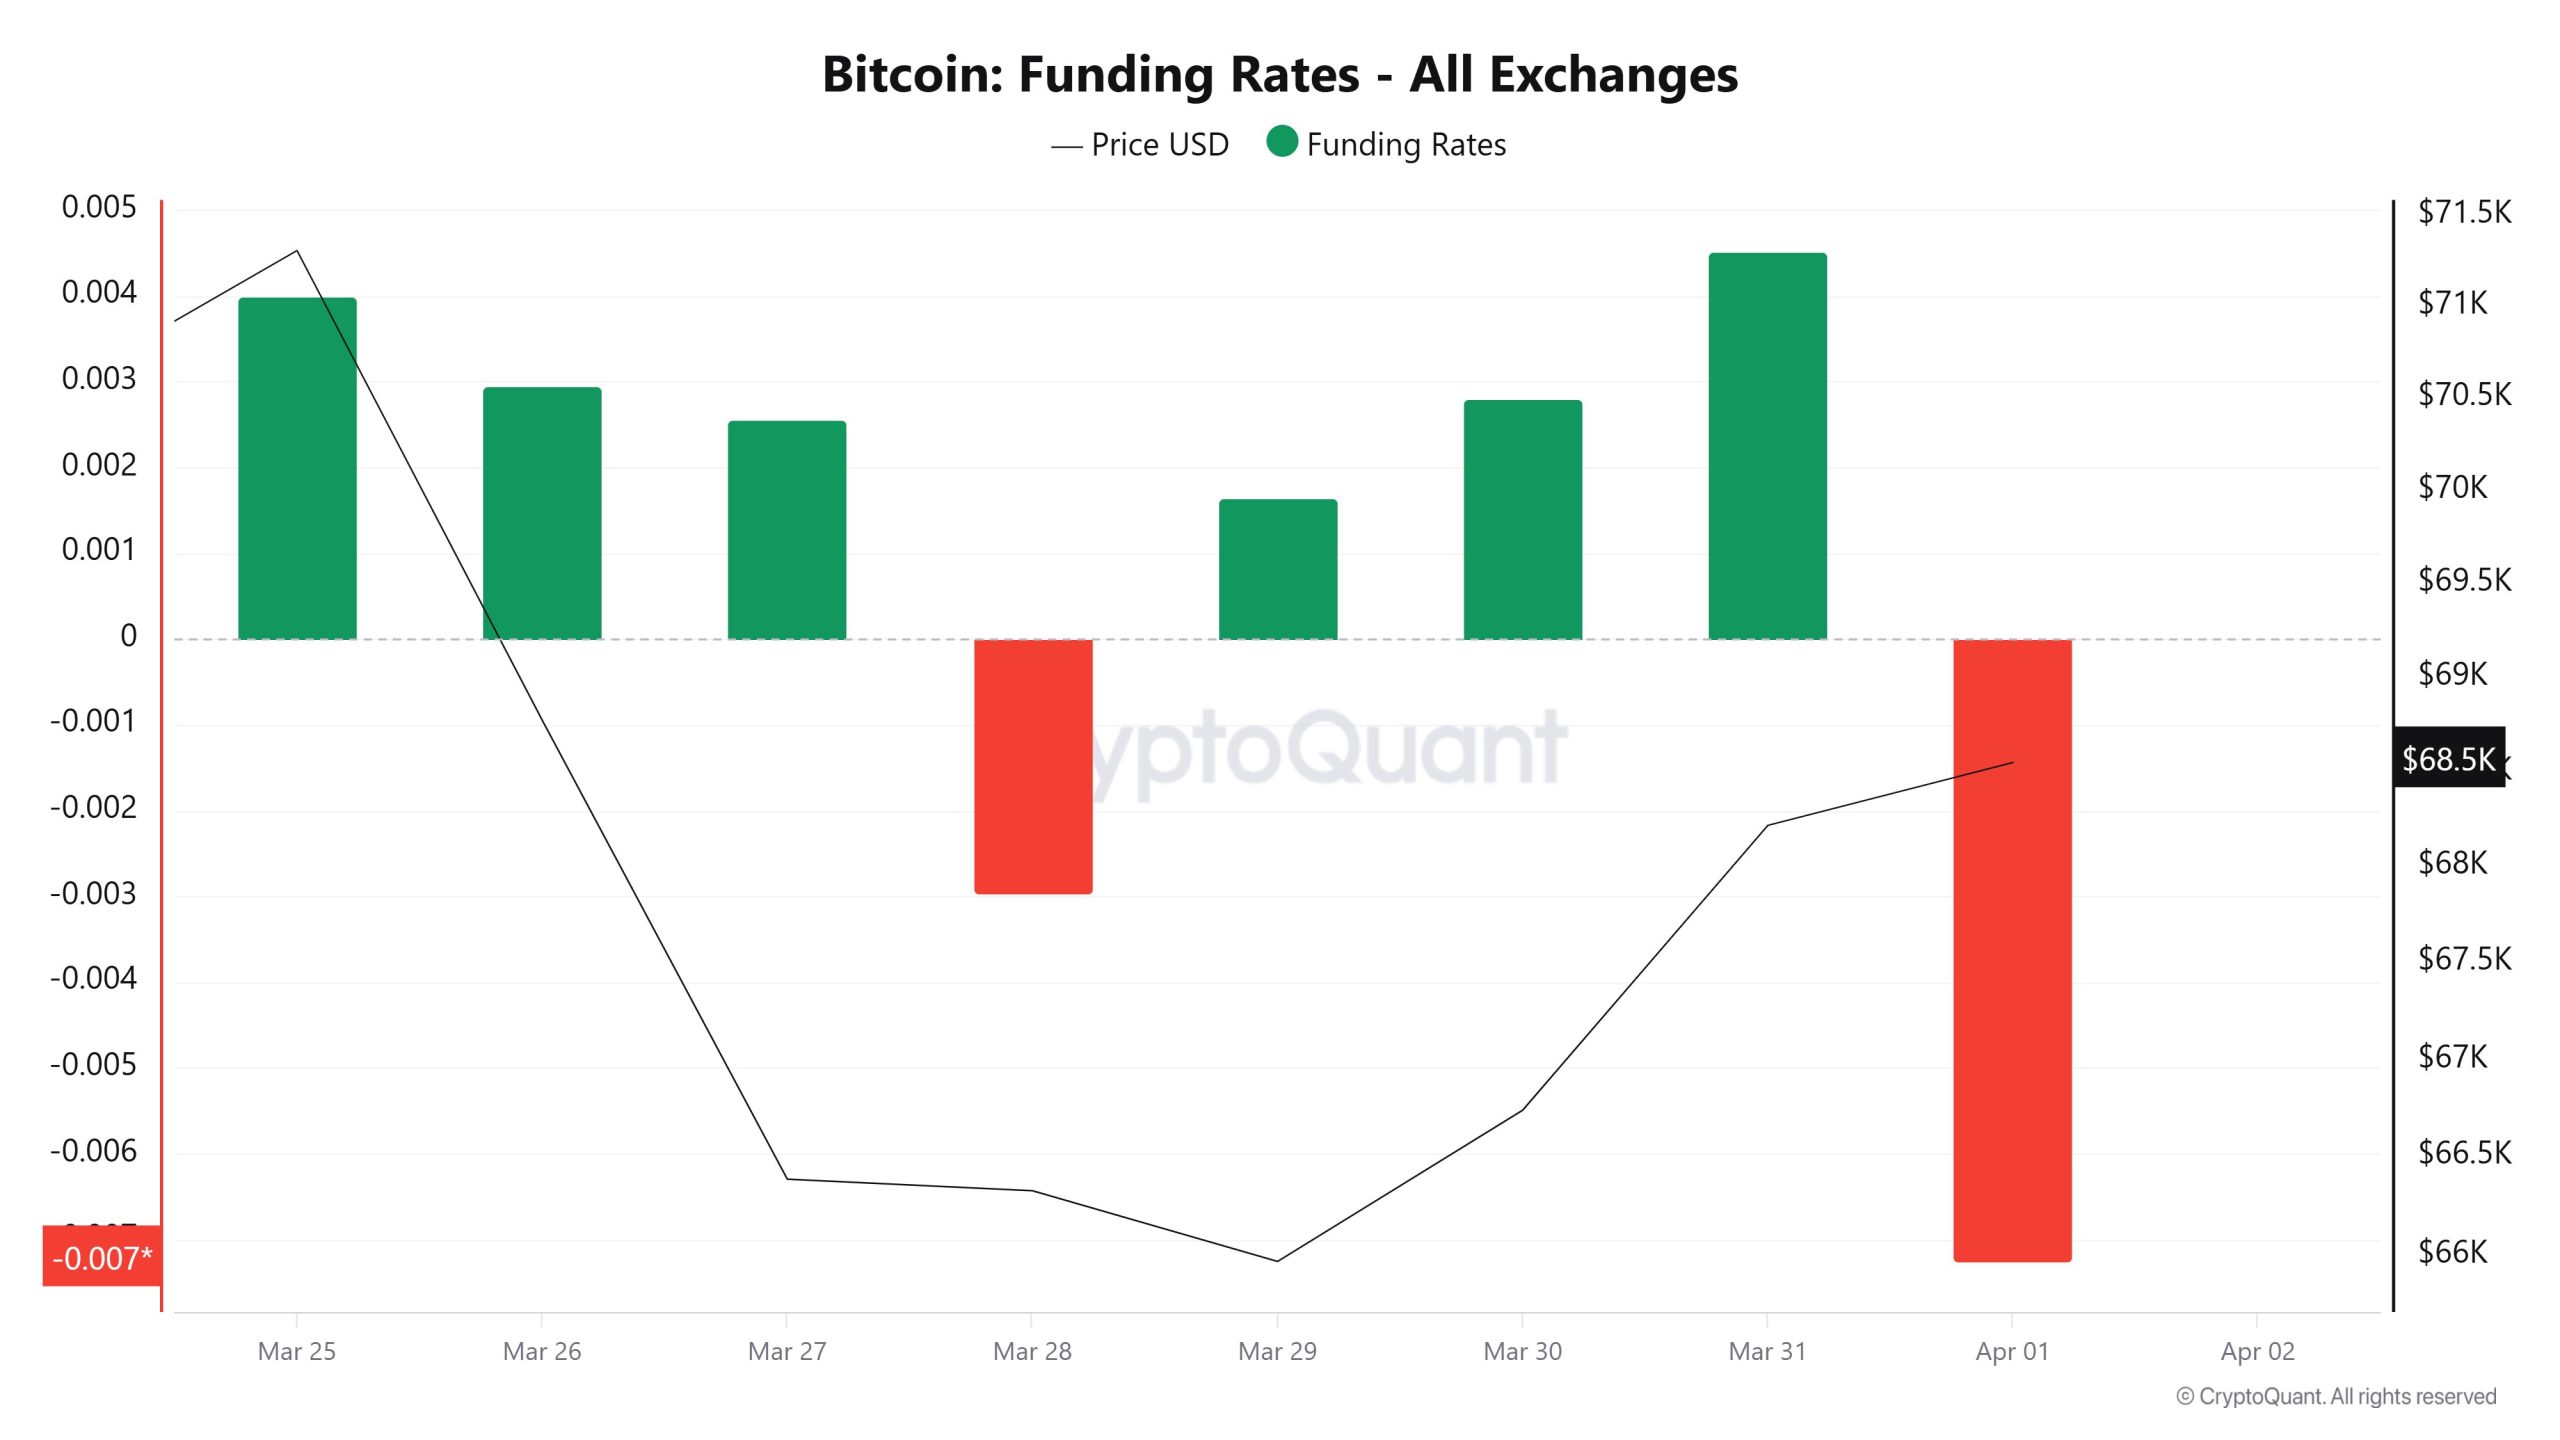
Funding Rate
The funding rate started the week on a positive note but turned sharply negative on March 27, indicating that short positions had gained the upper hand. It returned to positive territory between March 29 and 31, with a particularly strong positive value observed on March 31. With the rate turning negative again on April 1, it appears the market has yet to find a clear direction. However, the recent decline makes a short squeeze a possibility.
Long & Short Liquidations
Last week, as the BTC price fell from the $72,000 level to the $65,000 level, $864 million worth of long positions were liquidated. Additionally, $336 million worth of short positions were liquidated.
| Date | Long Amount (Million $) | Short Amount (Million $) |
|---|---|---|
| March 25 | 197.06 | 178.29 |
| March 26 | 81.69 | 9.49 |
| March 27 | 413.59 | 11.19 |
| March 28 | 14.69 | 16.66 |
| March 29 | 77.95 | 32.93 |
| March 30 | 24.56 | 37.28 |
| March 31 | 54.91 | 50.78 |
| Total | 864.45 | 336.62 |
Exchange Supply Ratio
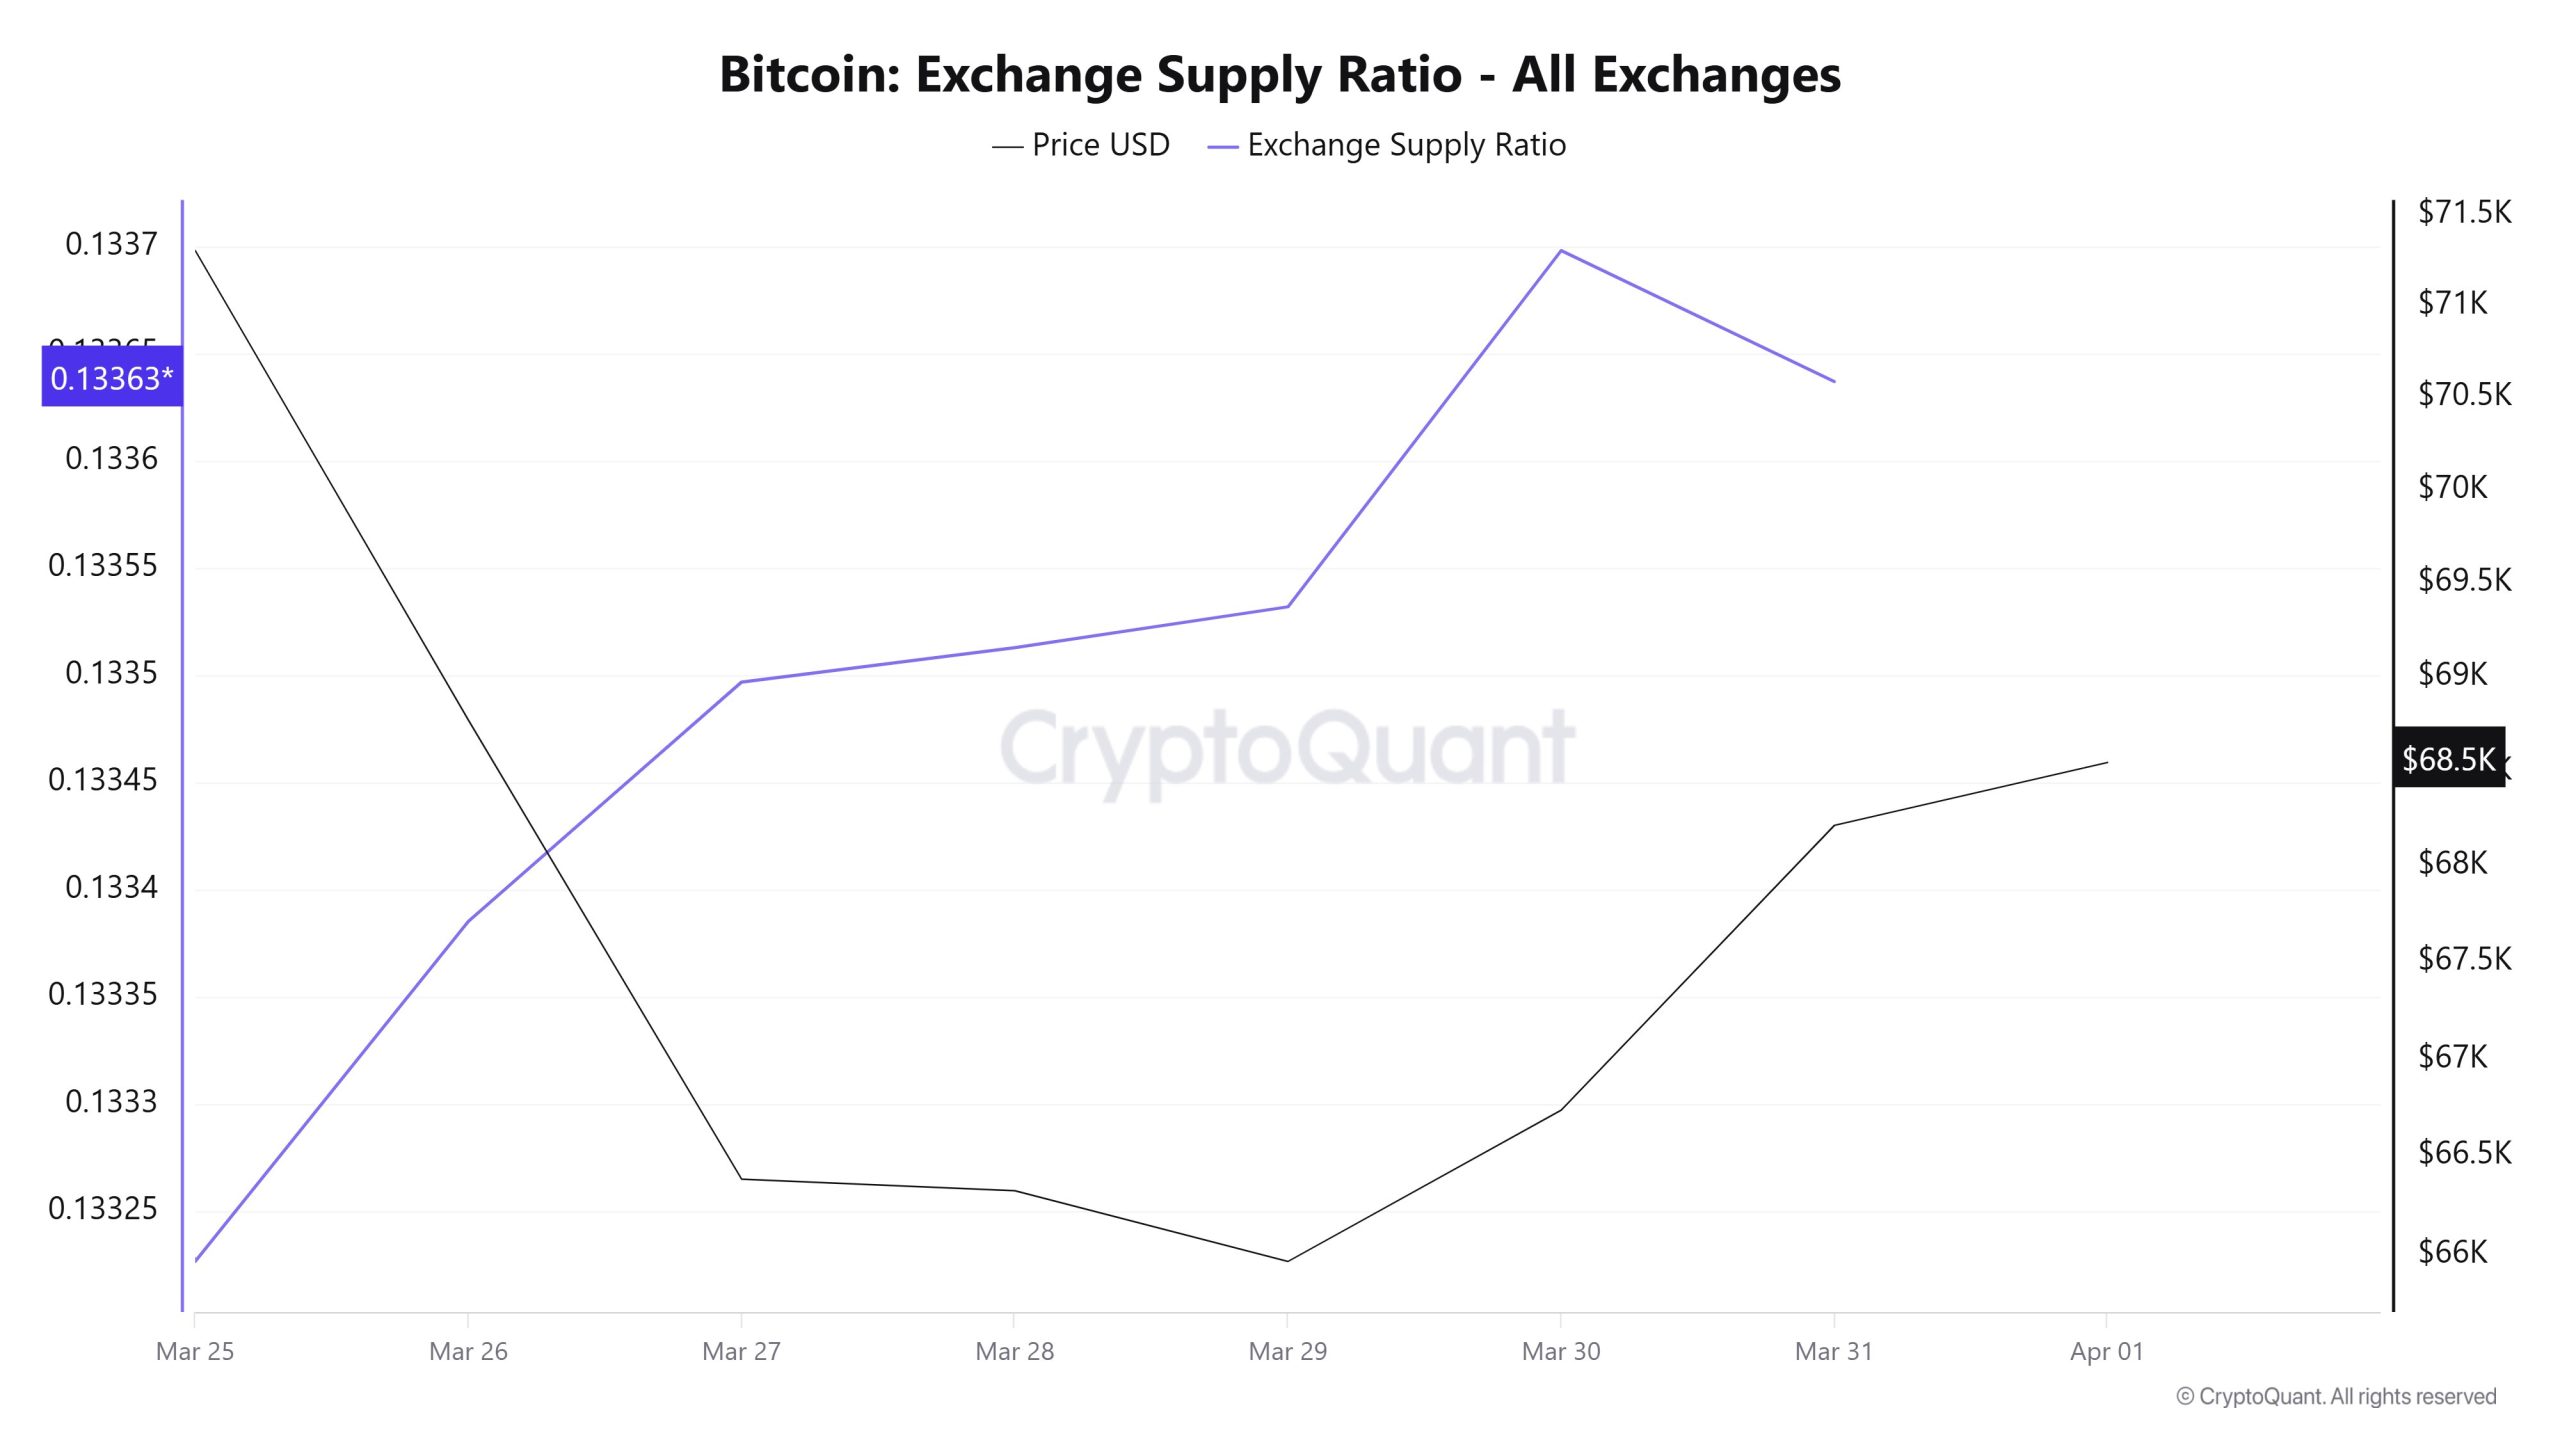
The exchange supply ratio was at low levels at the start of the week but rose gradually after March 26 and peaked around March 30. Although a limited pullback was observed afterward, the ratio remains higher than at the start of the week. There has been an increase in the amount of BTC moving toward exchanges, indicating that the likelihood of selling has increased somewhat in the short term.
BTC On-Chain Overview
| Metric | Positive 📈 | Negative 📉 | Neutral ➖ |
|---|---|---|---|
| Active Addresses | ✓ | ||
| Breakdowns | ✓ | ||
| Derivatives | ✓ | ||
| Exchange Supply Ratio | ✓ |
*The metrics and guidance provided in the table do not, on their own, explain or imply any expectation of future price changes for any asset. Digital asset prices can fluctuate based on many different factors. The on-chain analysis and related guidance are intended to assist investors in their decision-making process; however, basing financial investments solely on the results of this analysis may lead to unfavorable outcomes. Even if all metrics produce positive, negative, or neutral results simultaneously, the expected outcomes may not materialize depending on market conditions. Investors reviewing the report should take these warnings into consideration.
Legal Notice
The investment information, comments, and recommendations contained in this document do not constitute investment advisory services. Investment advisory services are provided by authorized institutions on a personalized basis, taking into account the risk and return preferences of individuals. The comments and recommendations contained in this document are of a general nature. These recommendations may not be suitable for your financial situation and risk and return preferences. Therefore, making an investment decision based solely on the information contained in this document may not result in outcomes that align with your expectations.
NOTE: All data used in Bitcoin on-chain analysis is based on CryptoQuant.
