
Active Addresses
Active Sending Addresses
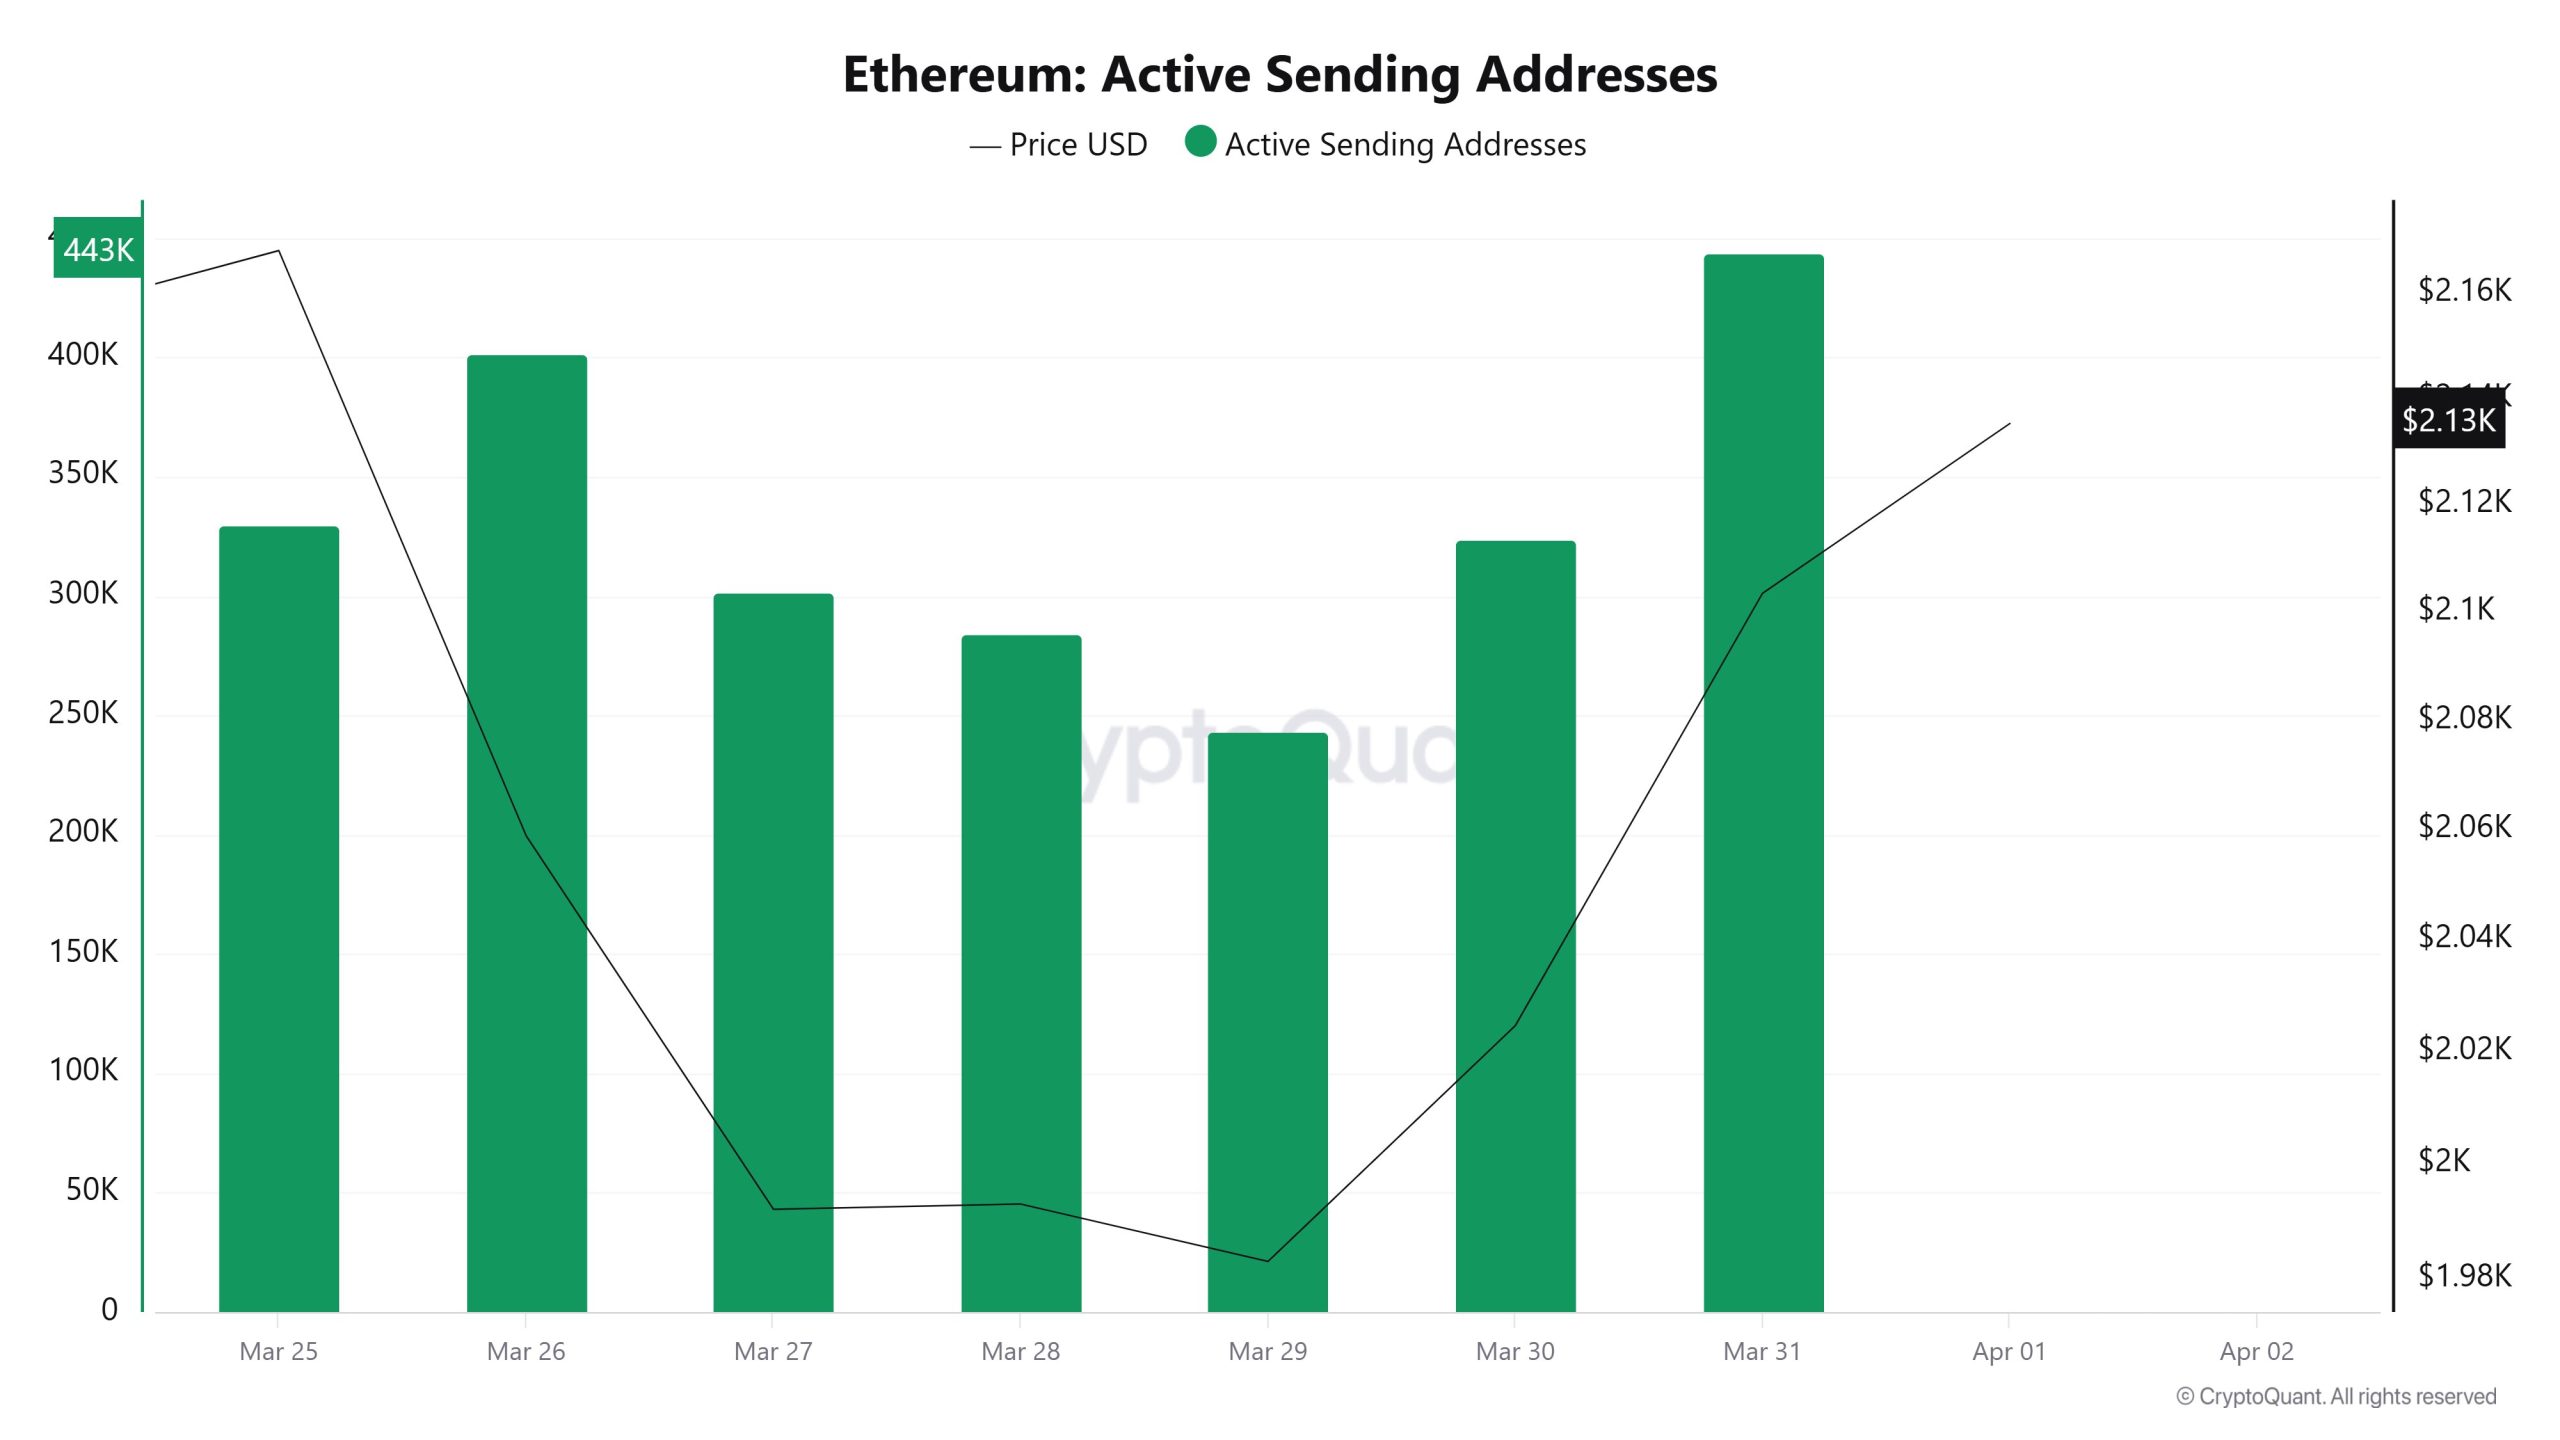
The data for sending addresses followed a similar trend. The figure, which was around 440K at the start of the week, dropped to 240K by midweek. Following a subsequent recovery, it returned to the 440K range. This decline in the number of active addresses, followed by a rapid recovery, indicates that the market has resumed activity after a brief pause.
Active Receiving Addresses
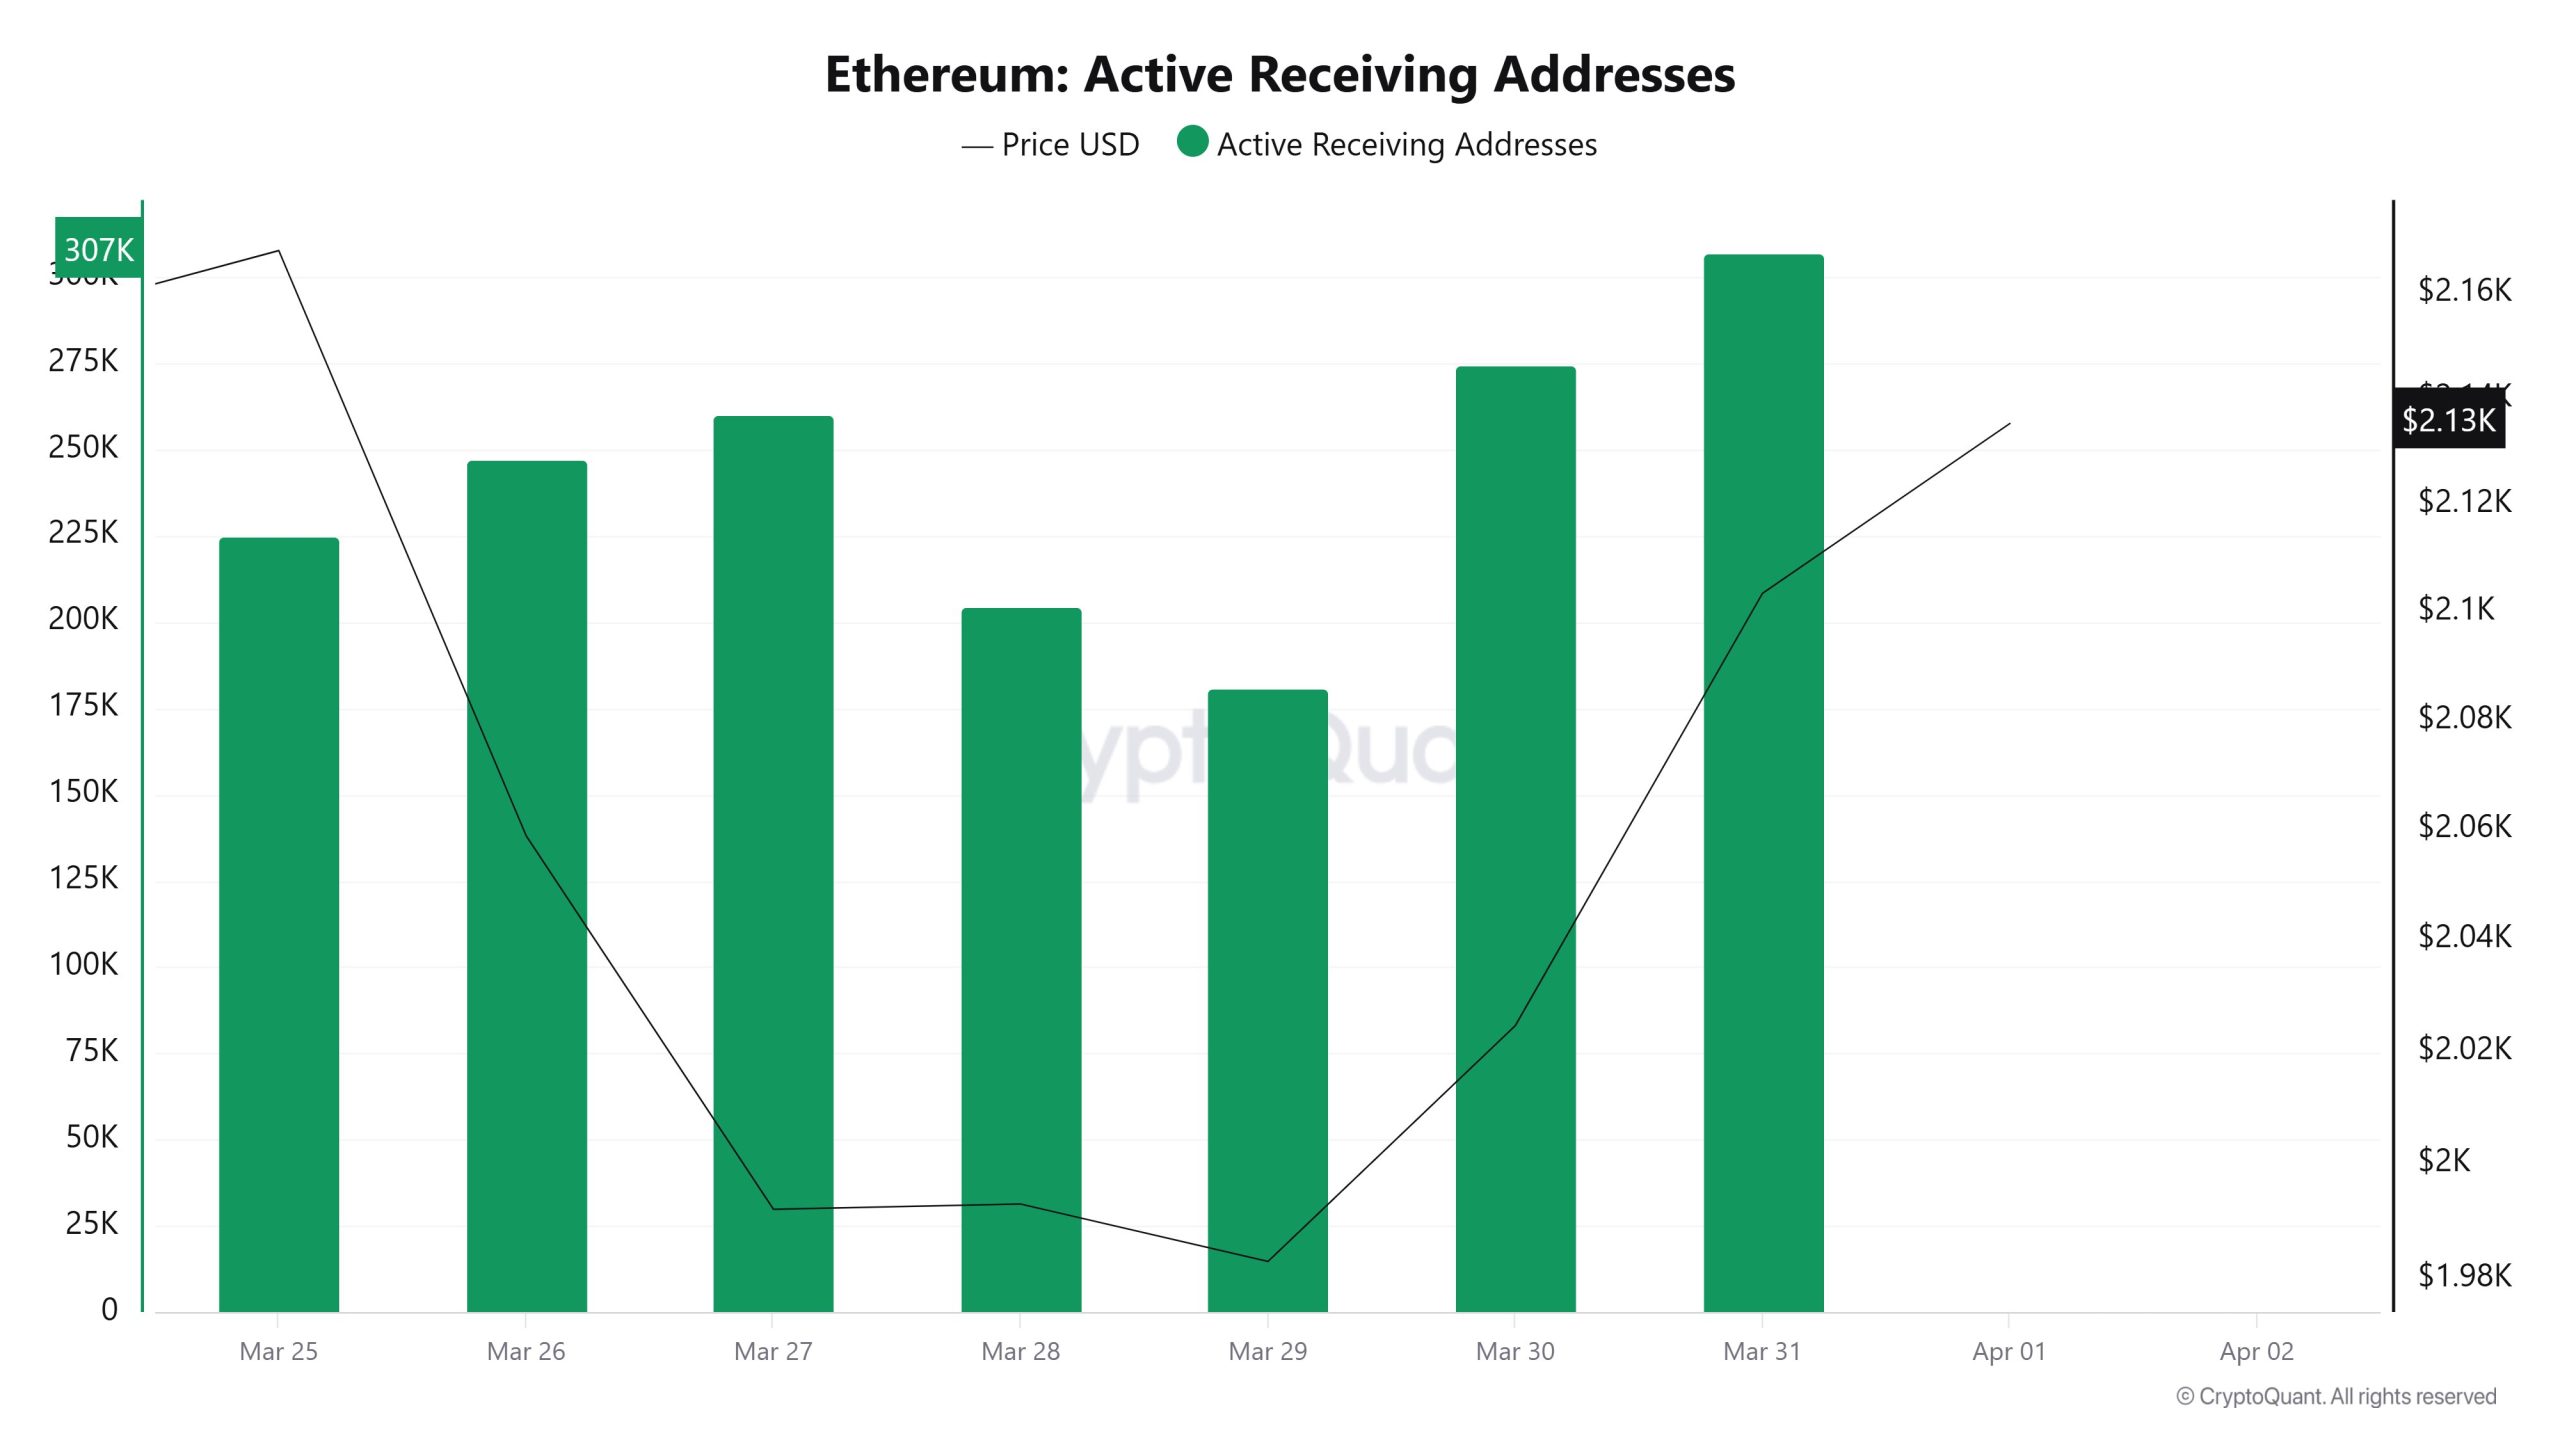
The number of receiving addresses started above the 300K level at the beginning of the week but experienced a significant drop between March 27–29, falling to the 180K range. This decline did not last long, and a rapid recovery—particularly after March 30—brought the figure back toward the 300K level. By the end of the week, network activity appeared to be gaining strength again.
Total Value Staked
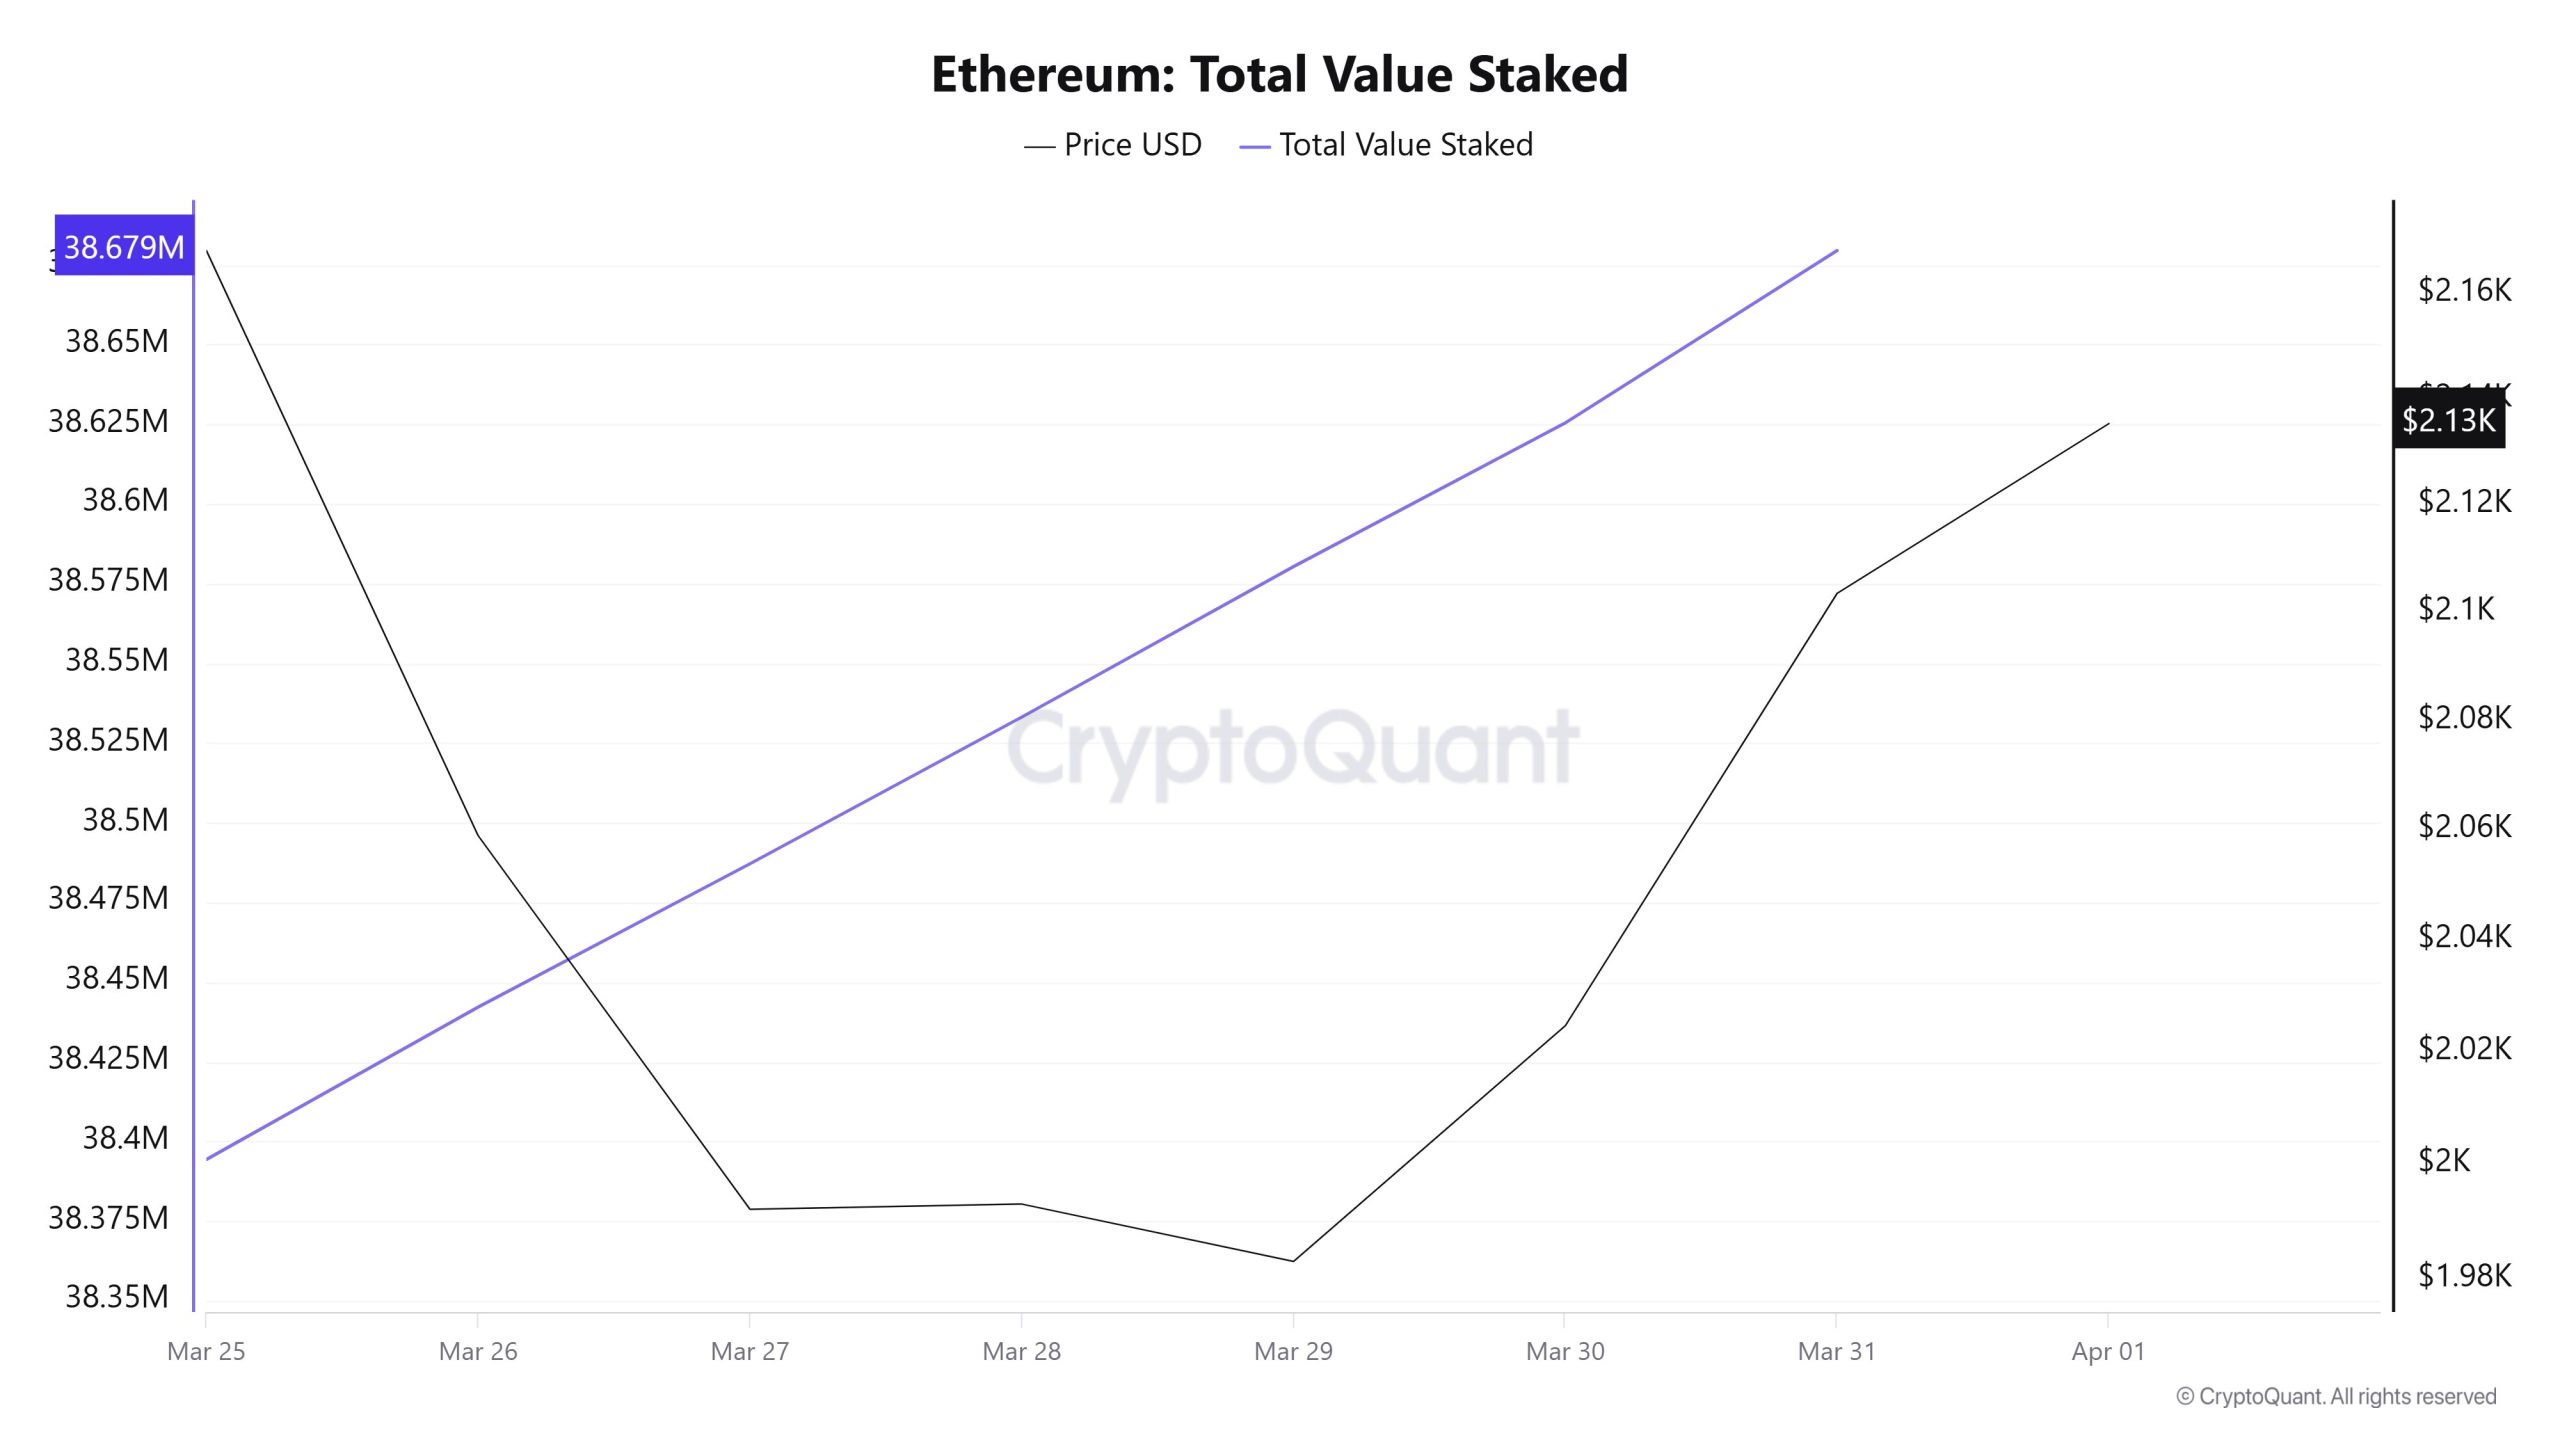
The total value staked data showed a steady increase throughout the week. Starting at the 38.38M level, the figure rose day by day, reaching 38.67M. Despite price volatility, the uninterrupted growth in staking indicates that long-term confidence remains intact.
Staking Inflows
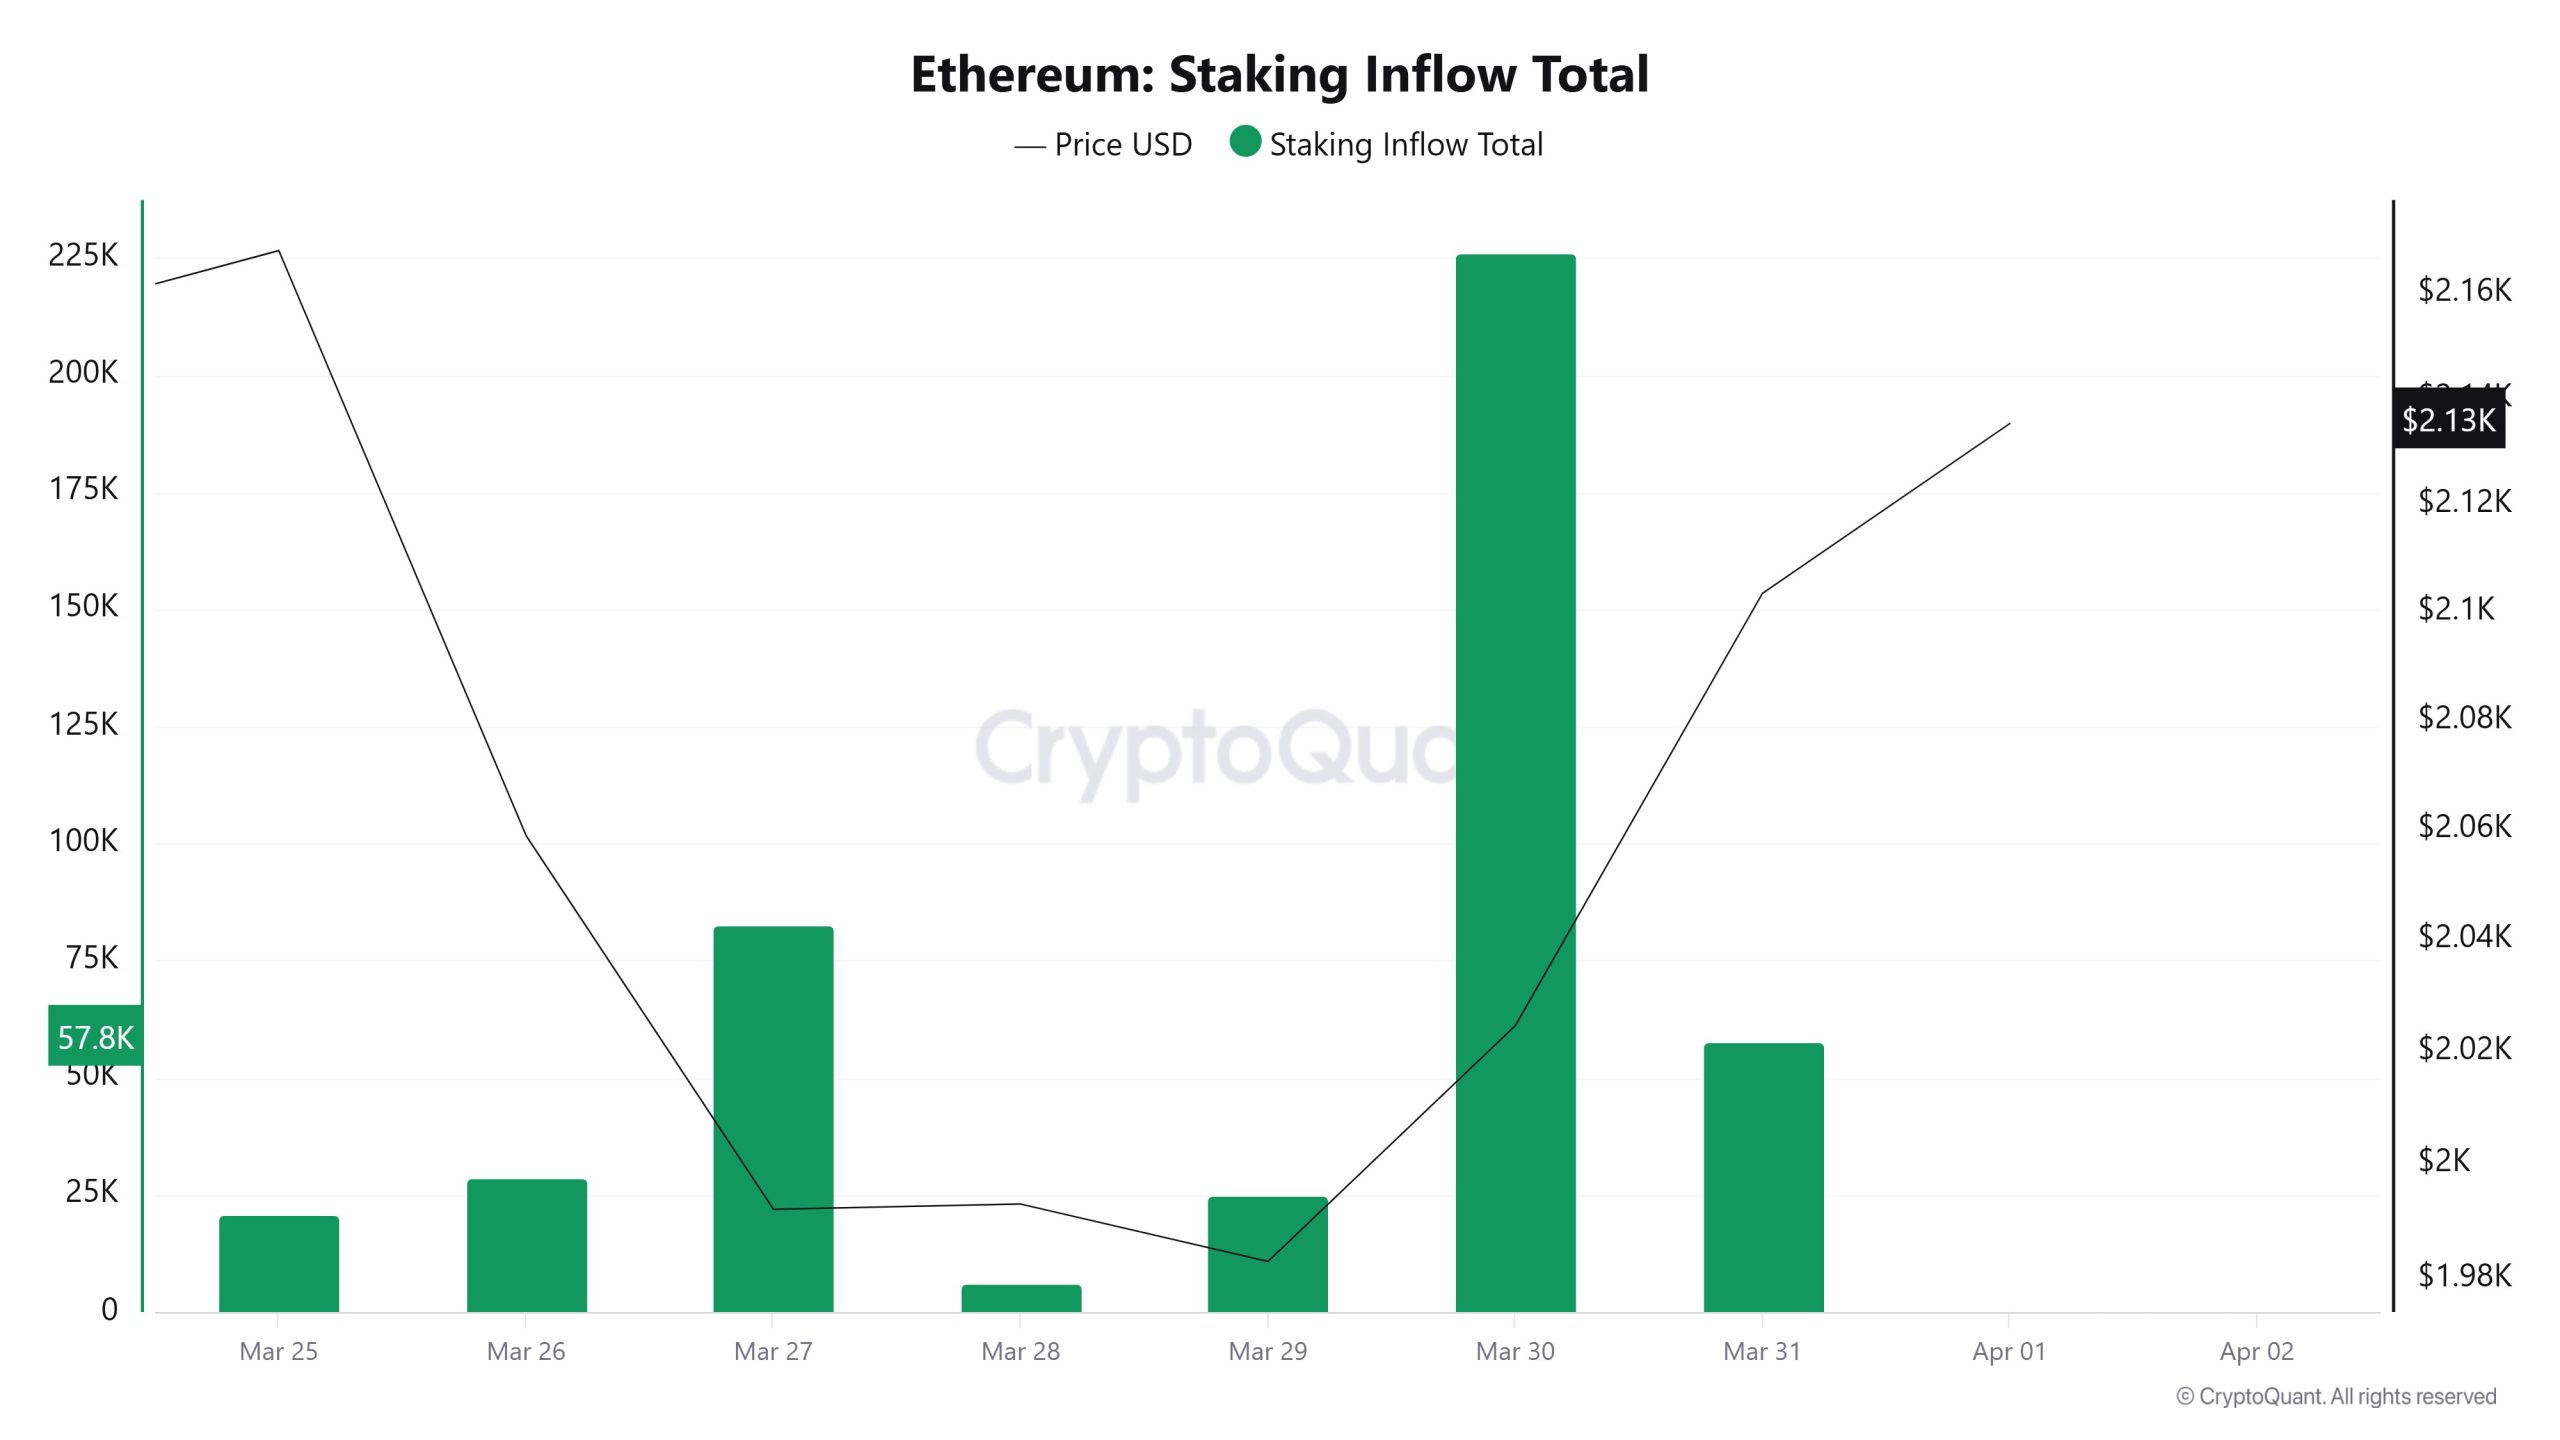
Staking inflows showed a volatile pattern throughout the week. While a significant increase was observed on March 27, inflows weakened considerably on March 28. On March 30, however, a very strong surge pushed inflows to the week’s highest level. Such sudden spikes indicate that interest in staking is accelerating periodically.
Derivatives
Open Interest
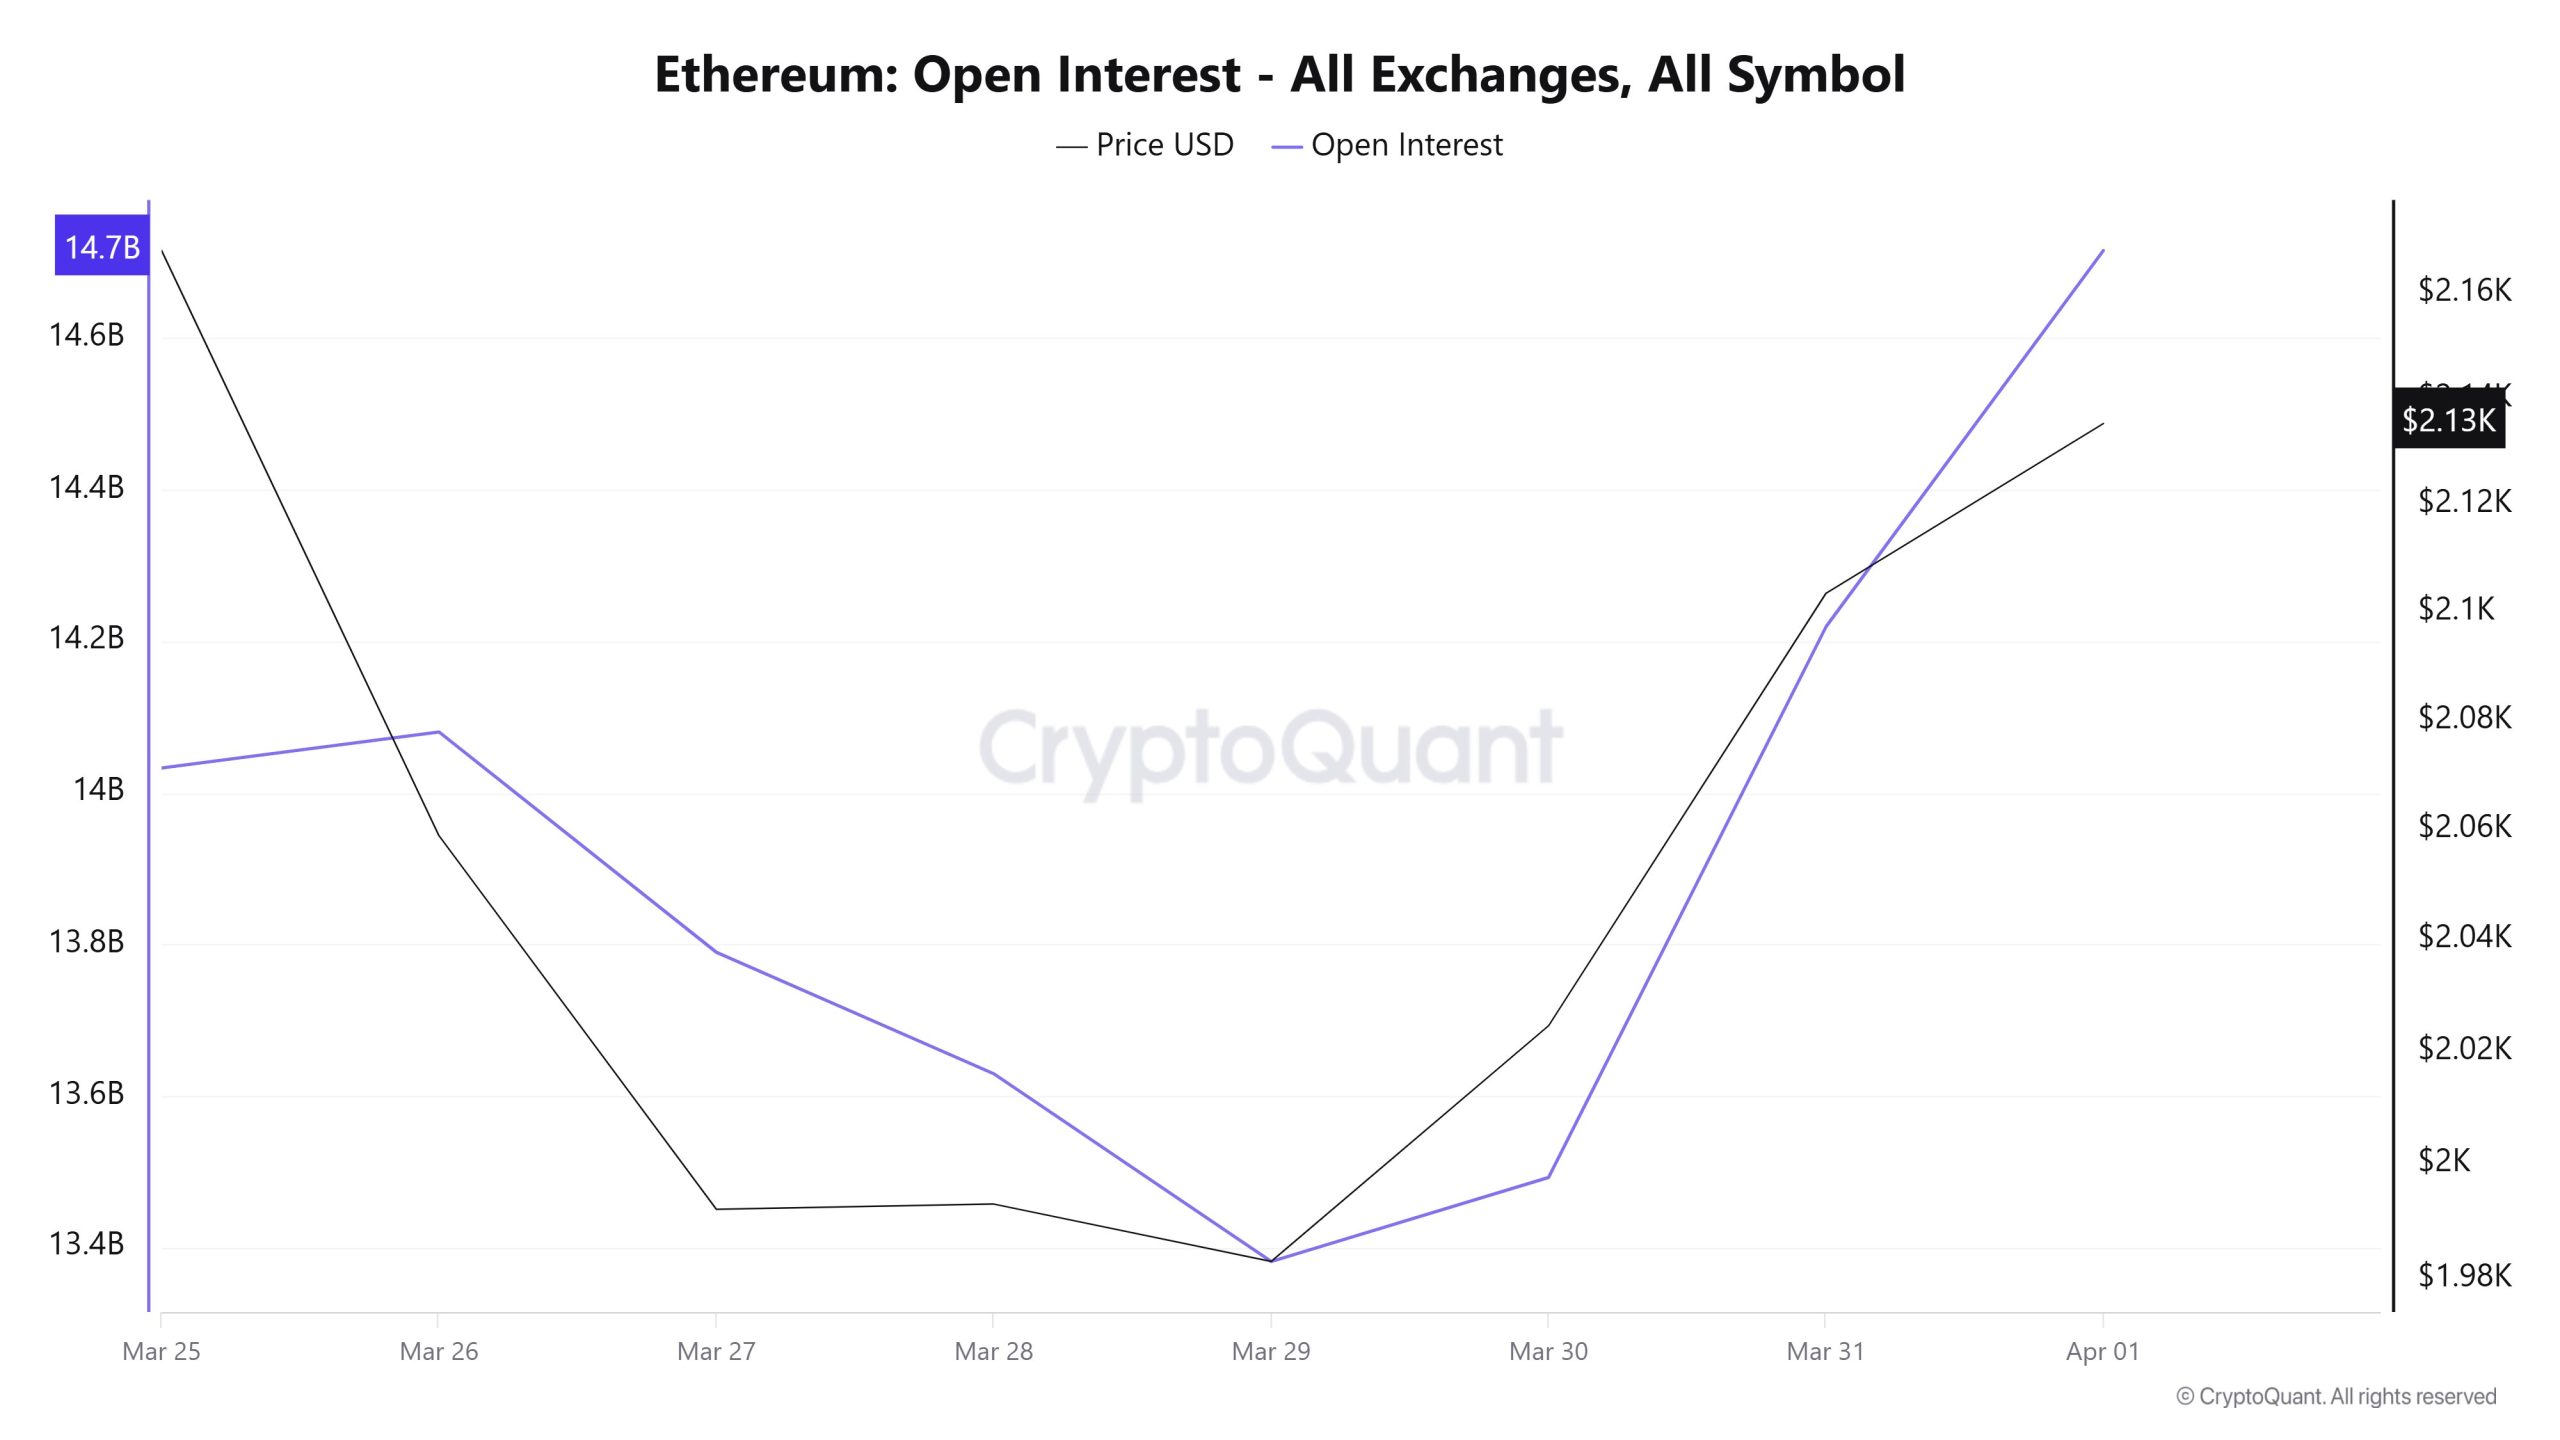
Open interest data began to decline from 14.6B levels at the start of the week, falling to 13.4B by March 29. During this period, it appears that leveraged positions were significantly liquidated from the market. Subsequently, a rapid recovery pushed the figure back up to 14.7B. This movement indicates that position openings have resumed in the market following the liquidations.
Funding Rate
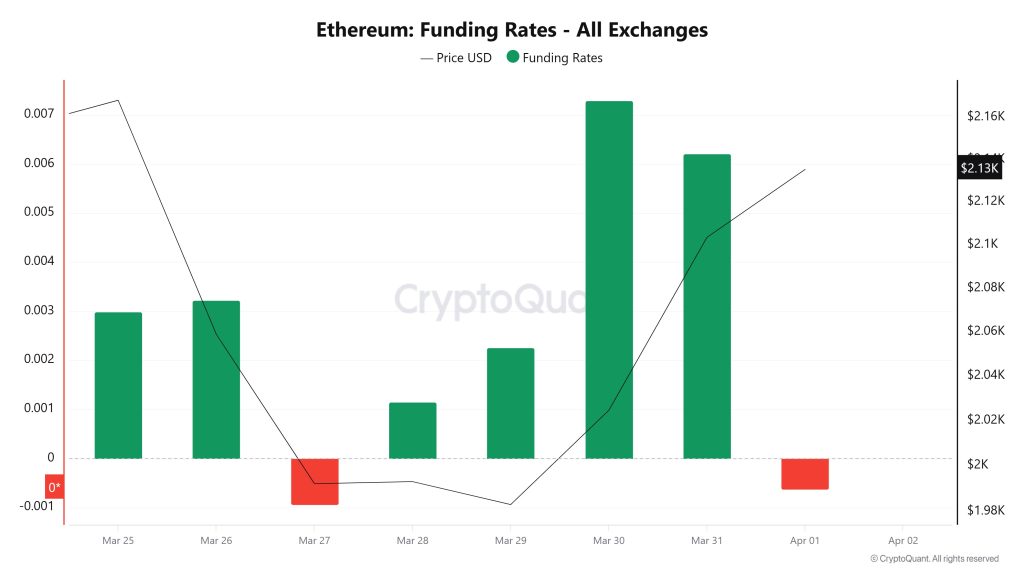
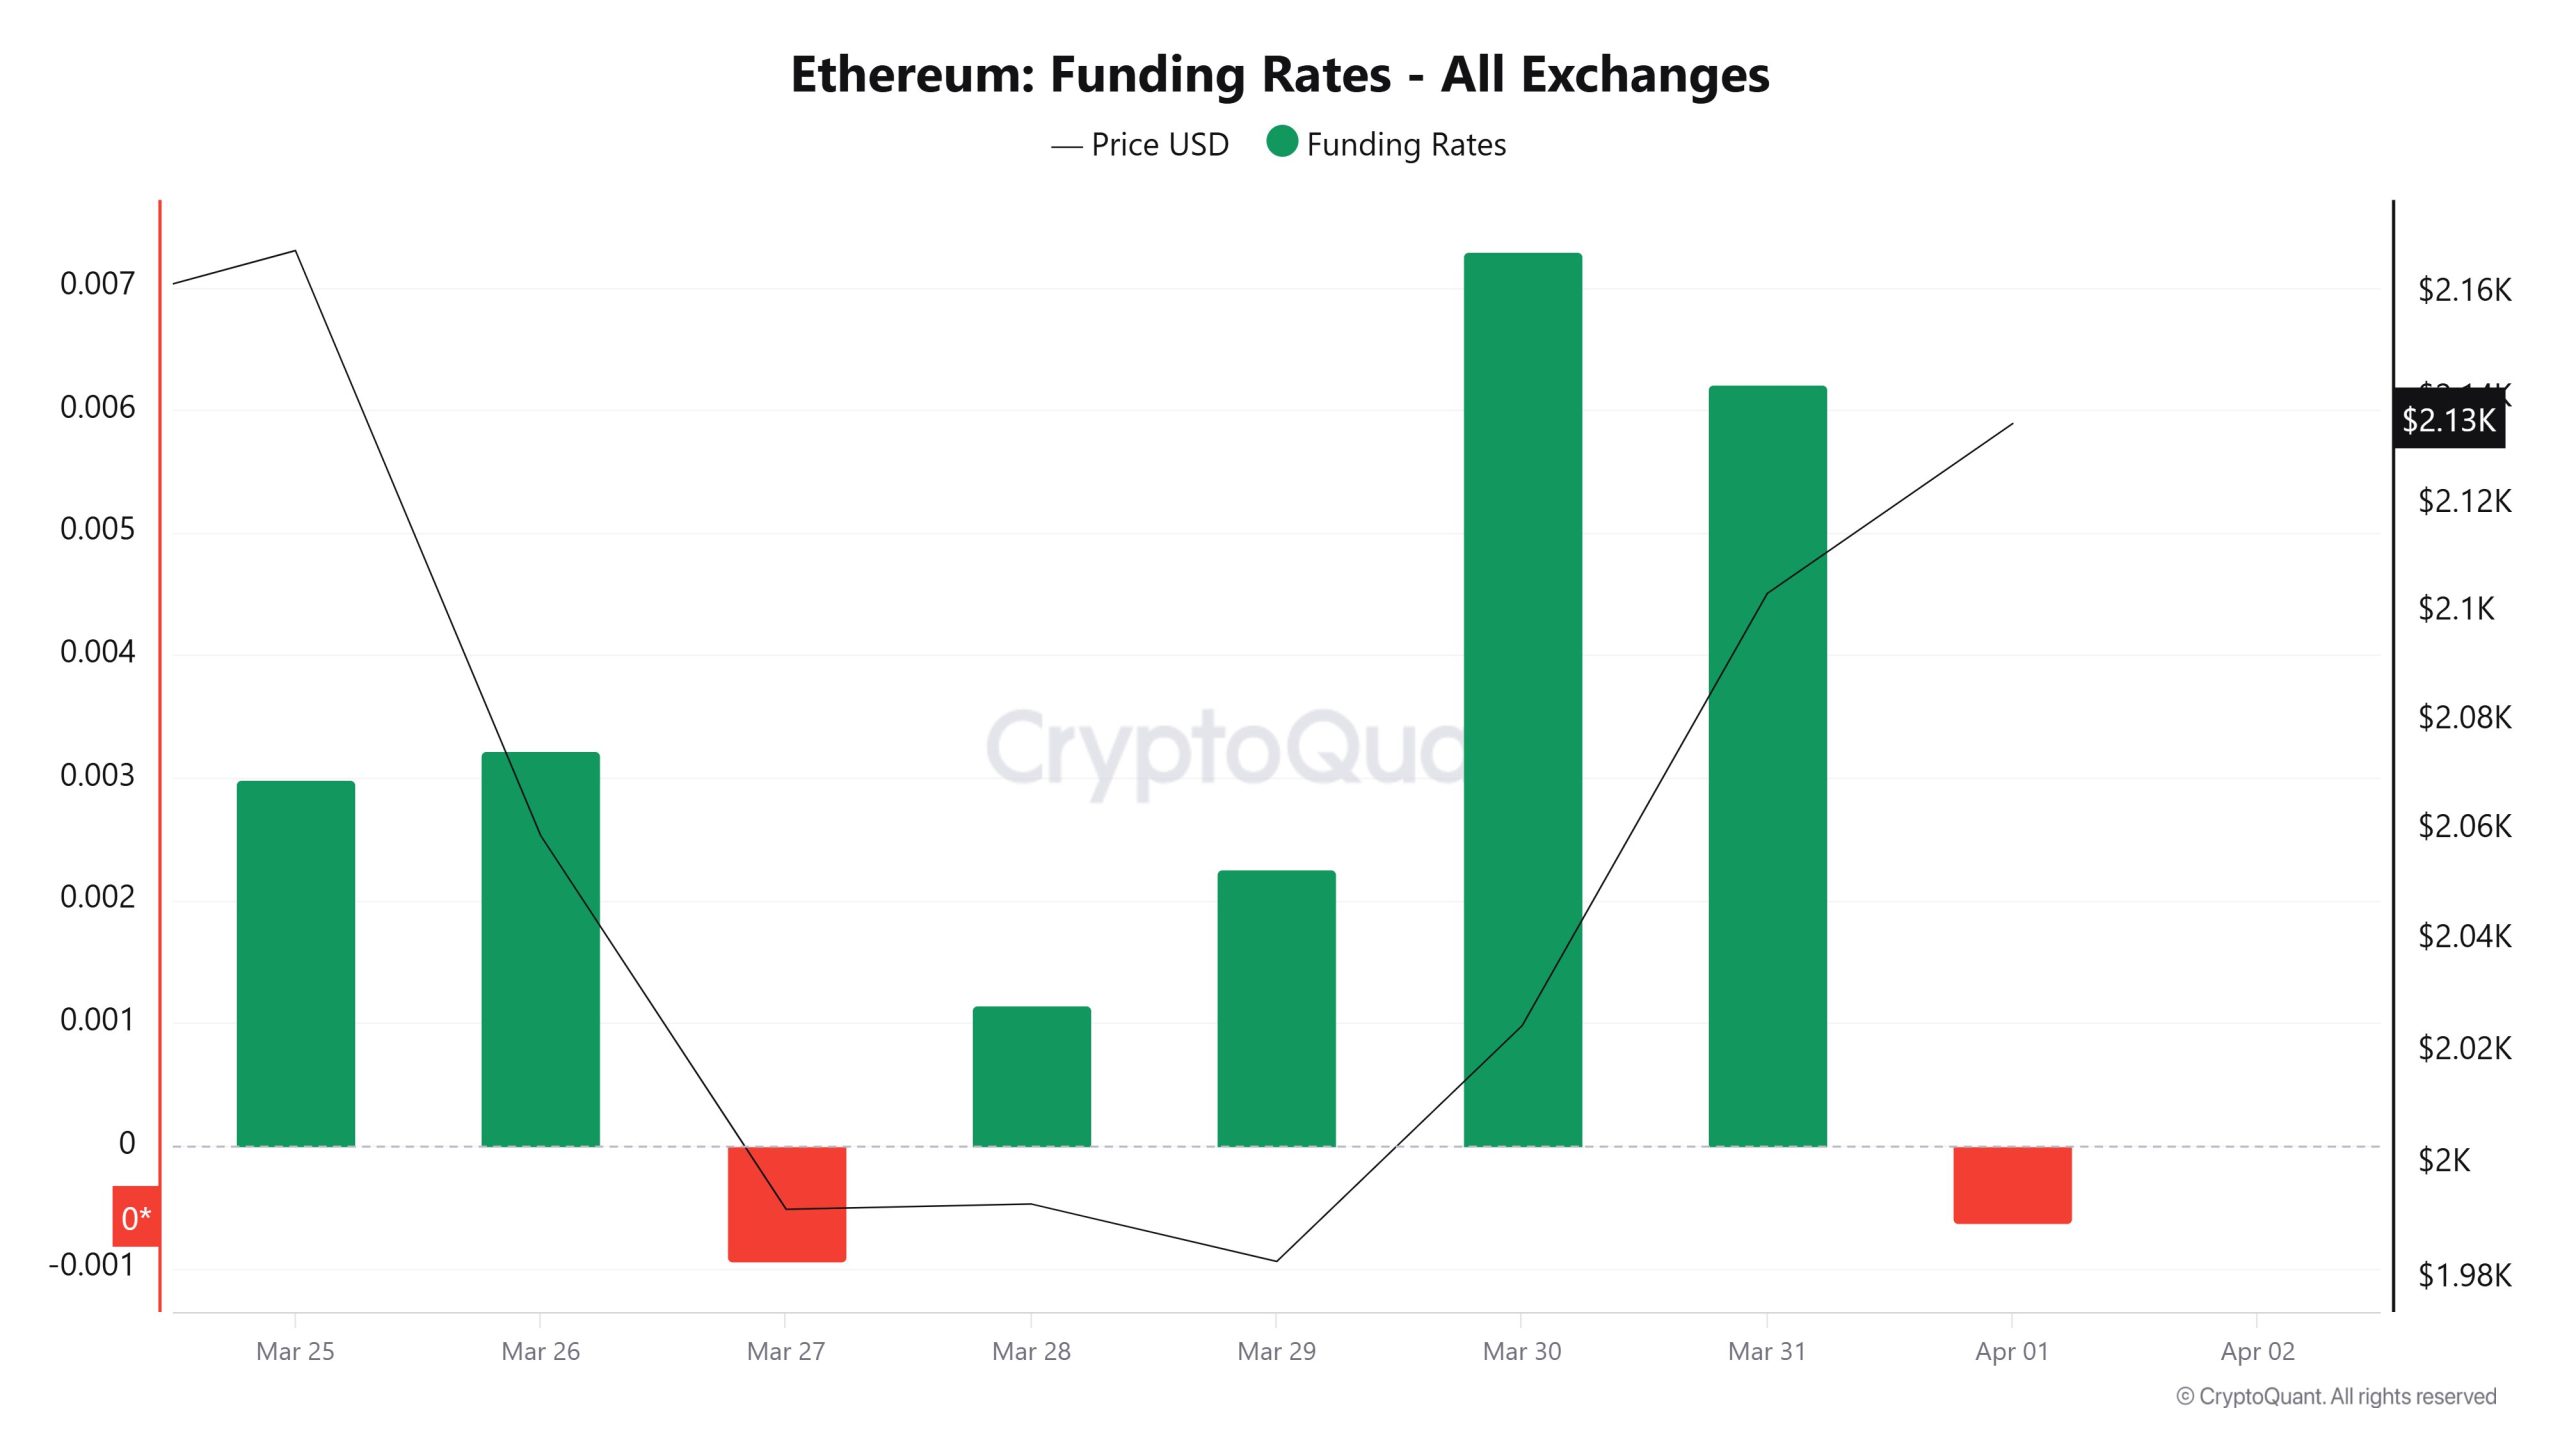
The funding rate remained in positive territory at the start of the week but turned negative around March 27, indicating an increase in short positions. The rate returned to positive territory starting March 28 and reached strong levels during the March 30–31 period. Its shift back to negative on April 1 suggests the market has yet to clarify its direction and that the volatile structure persists.
Long & Short Liquidations
As the ETH price fell from the $2,200 level to $1,938 and then rebounded to the $2,150 level last week, $1.16 billion in long positions and $260 million in short positions were liquidated.
| Date | Long Amount (Million $) | Short Amount (Million $) |
|---|---|---|
| March 25 | 17.98 | 45.31 |
| March 26 | 159.38 | 10.88 |
| March 27 | 159.96 | 32.09 |
| March 28 | 12.58 | 22.17 |
| March 29 | 116.67 | 11.77 |
| March 30 | 255.98 | 55.61 |
| March 31 | 293.93 | 82.32 |
| Total | 1,016.48 | 260.15 |
ETH On-Chain Total
| Metric | Positive 📈 | Negative 📉 | Neutral ➖ |
|---|---|---|---|
| Active Addresses | ✓ | ||
| Total Staked Value | ✓ | ||
| Derivatives | ✓ | ||
| Staking Inflows | ✓ |
*The metrics and guidance provided in the table do not alone explain or imply any expectation regarding future price changes in any asset. Digital asset prices can fluctuate based on numerous variables. The on-chain analysis and related guidance are intended to assist investors in their decision-making process; however, basing financial investments solely on the results of this analysis may lead to unfavorable outcomes. Even if all metrics produce positive, negative, or neutral results simultaneously, the expected outcomes may not materialize depending on market conditions. Investors reviewing the report should take these warnings into consideration.
Legal Notice
The investment information, comments, and recommendations contained in this document do not constitute investment advisory services. Investment advisory services are provided by authorized institutions on a personalized basis, taking into account the risk and return preferences of individuals. The comments and recommendations contained in this document are of a general nature. These recommendations may not be suitable for your financial situation and risk and return preferences. Therefore, making an investment decision based solely on the information contained in this document may not result in outcomes that align with your expectations.
NOTE: All data used in Ethereum on-chain analysis is based on CryptoQuant.
