
Fear & Greed Index
Source: Alternative.me
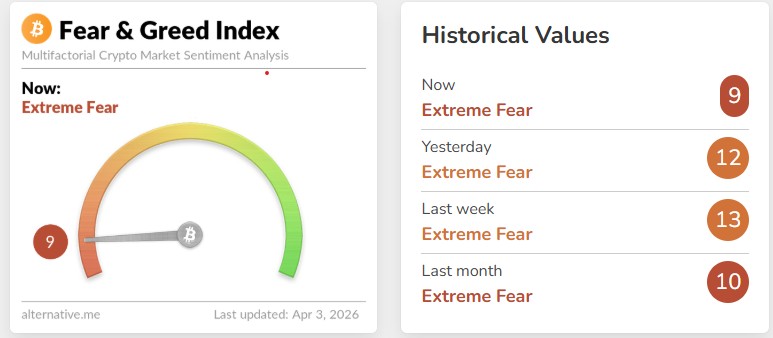
- Change in Fear and Greed Level: -4
- Last Week’s Level: 13
- This Week’s Level: 9
The Fear and Greed Index broke down again this week, falling from 13 to 9. Market sentiment, which was already weak, appears to have deteriorated significantly with this decline. The index’s return to single-digit levels indicates a serious decline in risk appetite among investors.
The limited recovery attempts seen over the past few weeks have not proven sustainable. On the contrary, this movement has largely remained a temporary relief. The current structure clearly demonstrates that a strong environment of confidence has not yet formed in the market and that selling pressure has not completely subsided.
When considering price movements, the market is currently going through a period where buying activity from the bottom remains weak. In other words, there are buyers, but they are not yet strong enough to drive the market higher. This explains why upward movements have not been sustainable.
A short-term rebound in the index back toward the 15–20 range would be the first sign of a genuine improvement in market sentiment. However, if the index remains at current levels, it would not be surprising for the market to remain cautious and under pressure for some time.
Fund Flows
Source: Coinshares
Overview:
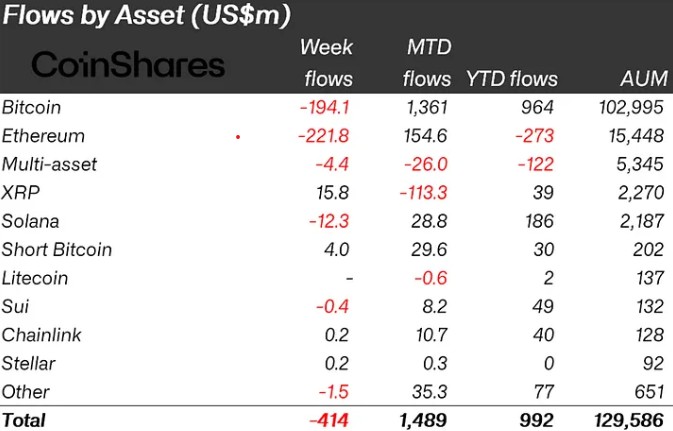
Fund flows weakened significantly this week. The recovery seen in previous weeks has given way to outflows once again. Strong outflows, particularly from Bitcoin and Ethereum, indicate that institutional appetite has retreated. Looking at the broader picture, a more defensive and cautious stance prevails in the market.
Weekly total flows: -$414 million
MTD (Month-to-date): +$1.489 billion
YTD (Year-to-date): +$992 million
While there was a significant outflow on a weekly basis, the majority of this outflow came from major assets.
Bitcoin weekly flow: -$194.1M – The largest outflow occurred on the Bitcoin side. This indicates that institutional investors have begun to reduce risk. Although the structure that has remained strong since the beginning of the year is still intact, momentum has weakened in the short term.
Ethereum weekly flow: -$221.8M – The sharpest outflow of the week was seen in Ethereum. The fact that the YTD figure has also turned negative indicates that the pressure on Ethereum has intensified.
Solana weekly flow: -$12.3M – The positive trend seen in previous weeks weakened this week and turned to outflows, albeit limited.
XRP weekly inflow: +$15.8M – Despite the general weakness in the market, XRP stood out positively. However, the negative picture on the MTD side shows that these inflows do not yet signal a trend reversal.
Other assets:
• Short Bitcoin: +$4.0M
• Chainlink: +$0.2M
• Stellar: +$0.2M
• Sui: -$0.4M
• Multi-asset: -$4.4M
• Litecoin: No weekly data available; slightly negative on a month-to-date basis
Overall, the concentration of outflows in major assets is notable. This indicates a decline in risk appetite across the market and suggests that investors are adopting a more cautious stance. On the altcoin side, however, no clear direction has emerged, and the flow remains scattered and weak.
Total Market Cap
Source: TradingView
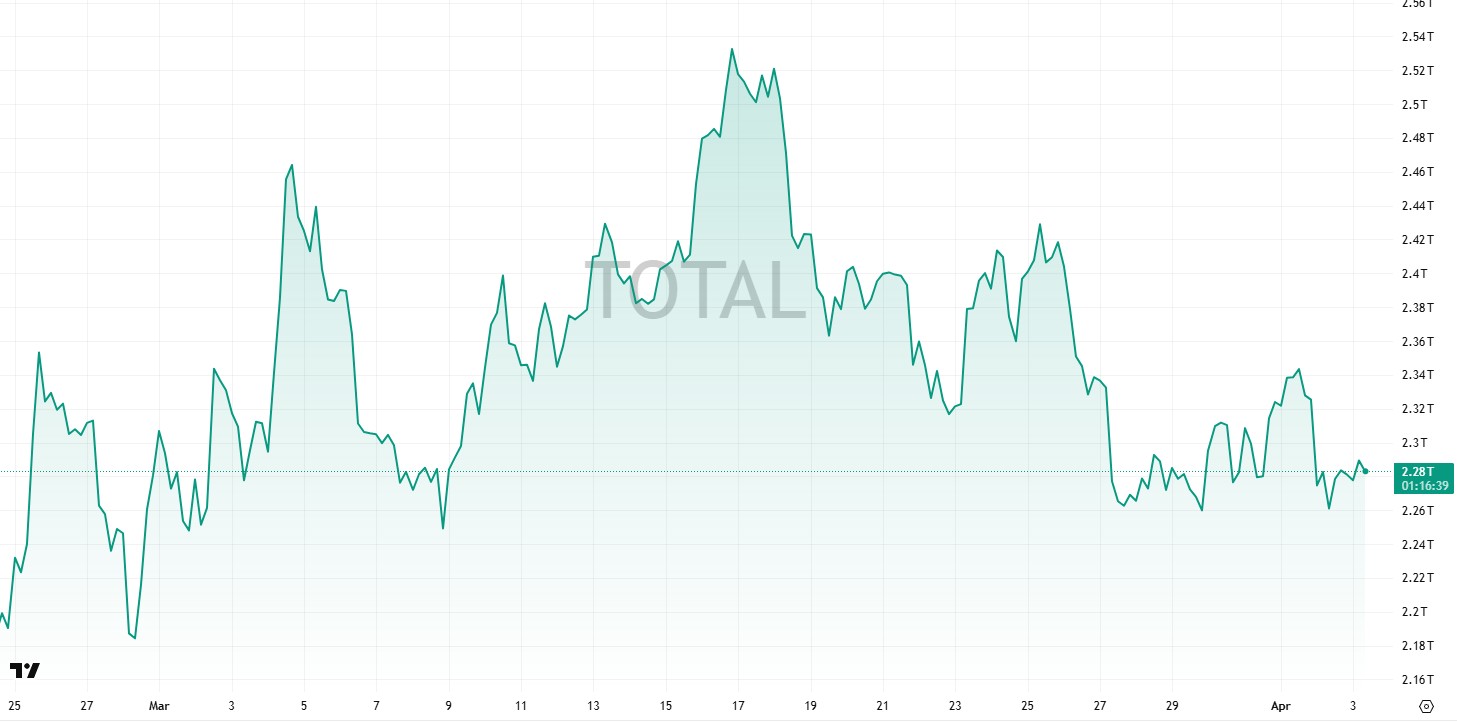
- Market Capitalization Last Week: $2.31 Trillion
- Market Capitalization This Week: $2.28 Trillion
Throughout the week, the market struggled to move higher, and a more volatile but downward-trending pattern emerged. In particular, the rally attempt in the middle of the week was short-lived, followed by a scenario where selling pressure returned. The total market capitalization is currently around $2.28 trillion, showing a slight decline compared to the previous week. There are attempts to reach new highs, but they lack sustainability.
Total 2
A similar picture is observed on the Total 2 side. Although there were a few attempts to reach the 970–980-billion-dollar range during the week, these levels could not be sustained. It is currently priced around 946 billion dollars. The fact that every upward move is met with selling indicates that appetite for altcoins remains weak.
Total 3
The Total 3 segment, which includes smaller-cap altcoins, is showing a more fragile structure. Downward pressure was more pronounced throughout the week. After attempts to approach the 720-billion-dollar level, sharp pullbacks followed, and it is currently around 698 billion dollars. Buyers remain more reluctant in this segment, and volatility continues to stay high.
Looking at the big picture, the market is attempting a recovery but can’t sustain it. Weakness is particularly evident in the altcoin sector. It’s hard to speak of a strong trend at this point. The market is currently more indecisive and fragile.
Bitcoin Dominance
Source: Tradingview
Weekly Change
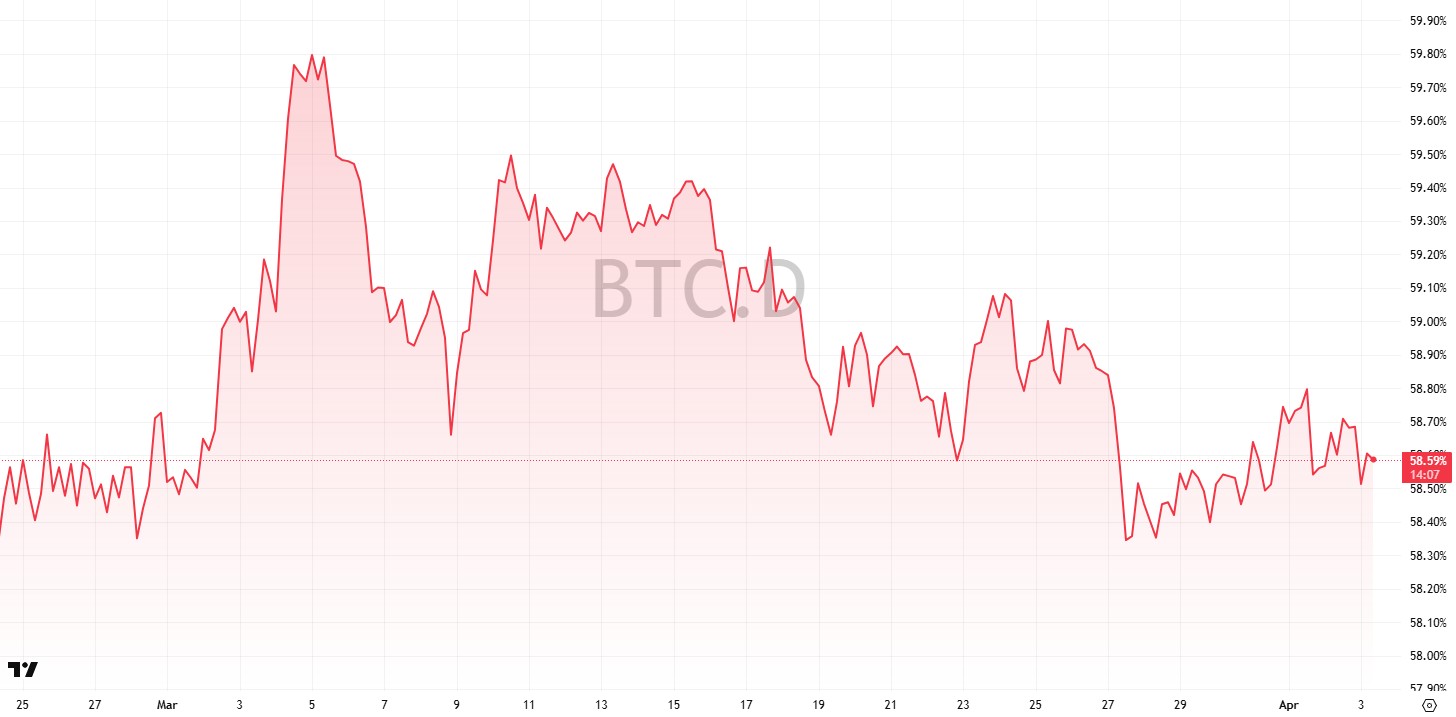
- Last Week’s Level: 58.64%
- This Week’s Level: 58.59%
Bitcoin dominance struggled to find a clear direction this week and mostly exhibited a sideways trend with a downward bias. Although there was an attempt to break above 59% at the start of the week, this move was short-lived and quickly reversed.
A gradual decline in dominance has been noticeable since mid-week. In particular, the pullback toward the 58.40% level indicated a weakening of Bitcoin’s market influence. Although there was a slight recovery following the rebound from this level, it is difficult to speak of a strong reversal.
Looking at the broader picture, there is no clear downward trend in Bitcoin dominance, but upward momentum remains weak. This suggests a limited opening for altcoins, though a strong altcoin season has not yet signaled itself.
In the short term, the 58.40% level continues to act as support. Above, the range between 59.20% and 59.50% represents a significant resistance zone. The price remains range-bound within this band, and it appears difficult to determine the direction without a clear breakout.
Bitcoin Spot ETF
Source: Darkex Research Department
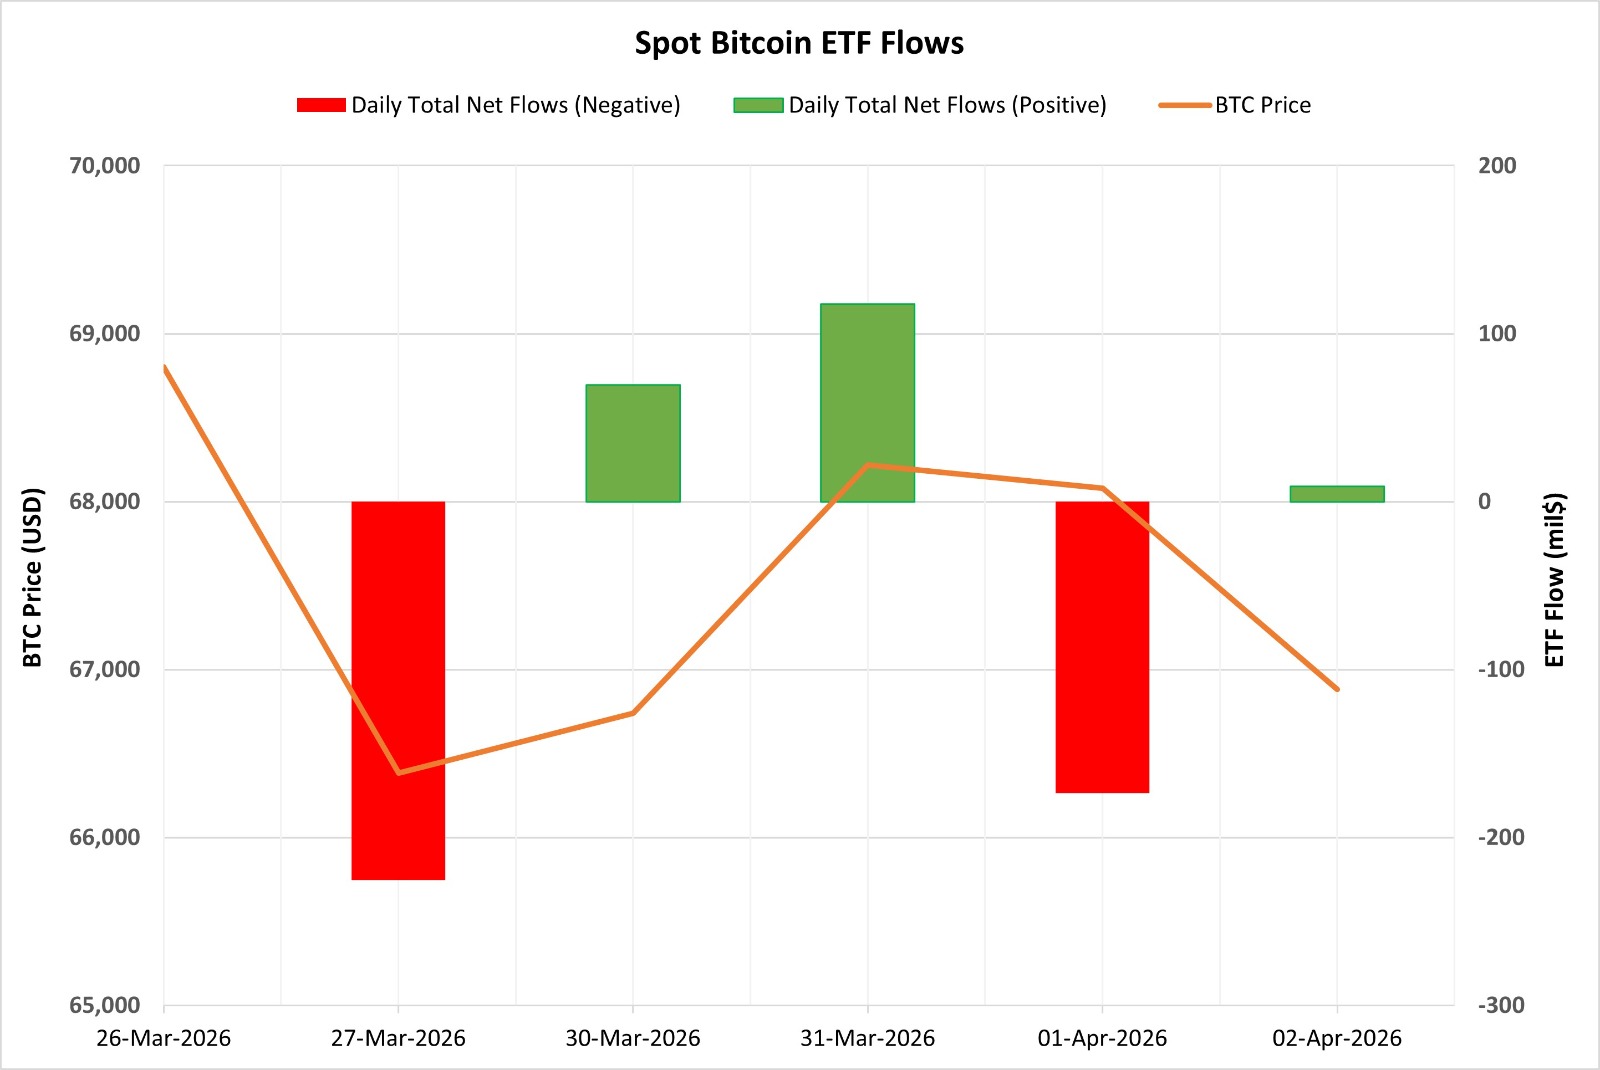
Between March 27 and April 2, 2026, there was a total net outflow of $203.3 million from Spot Bitcoin ETFs. While no clear direction emerged in ETF flows during this period, the overall picture took shape on the negative side. Strong outflows were the key factor in the formation of the negative outlook throughout the period. This pattern indicated that institutional investors maintained a cautious stance and that inflows struggled to sustain momentum. Looking at individual funds, outflows from BlackRock’s IBIT and Fidelity’s FBTC stood out. With these developments, the cumulative total net inflow of Spot Bitcoin ETFs fell to $55.93 billion by the end of the 556th trading day.
| Date | Coin | Price | ETF Flow (mil$) | ||
|---|---|---|---|---|---|
| Open | Close | Change % | |||
| March 27, 2026 | BTC | 68,803 | 66,384 | -3.52% | -225.5 |
| March 30, 2026 | BTC | 65,963 | 66,738 | 1.18% | 69.4 |
| March 31, 2026 | BTC | 66,738 | 68,218 | 2.22% | 117.5 |
| April 1, 2026 | BTC | 68,218 | 68,081 | -0.20% | -173.7 |
| April 2, 2026 | BTC | 68,081 | 66,882 | -1.76% | 9 |
| Total (March 27 – April 2, 2026) | — | — | — | -2.79% | -203.30 |
On the price front, Bitcoin opened at $68,803 on March 27 and closed at $66,882 on April 2. During this period, the BTC price declined by 2.79%. In particular, the sharp price pullbacks observed on March 27 and April 1, coinciding with ETF outflows, indicated that the correlation between ETF flows and price movements has regained strength in the short term. Overall, this period signaled a continuation of weak and volatile demand patterns in Spot Bitcoin ETFs. If stable and substantial inflows resume in the coming days, a recovery in the Bitcoin price could be observed. However, if the current negative outflow trend persists, downward pressure and volatility are likely to continue.
Spot Ethereum ETF
Source: Darkex Research Department
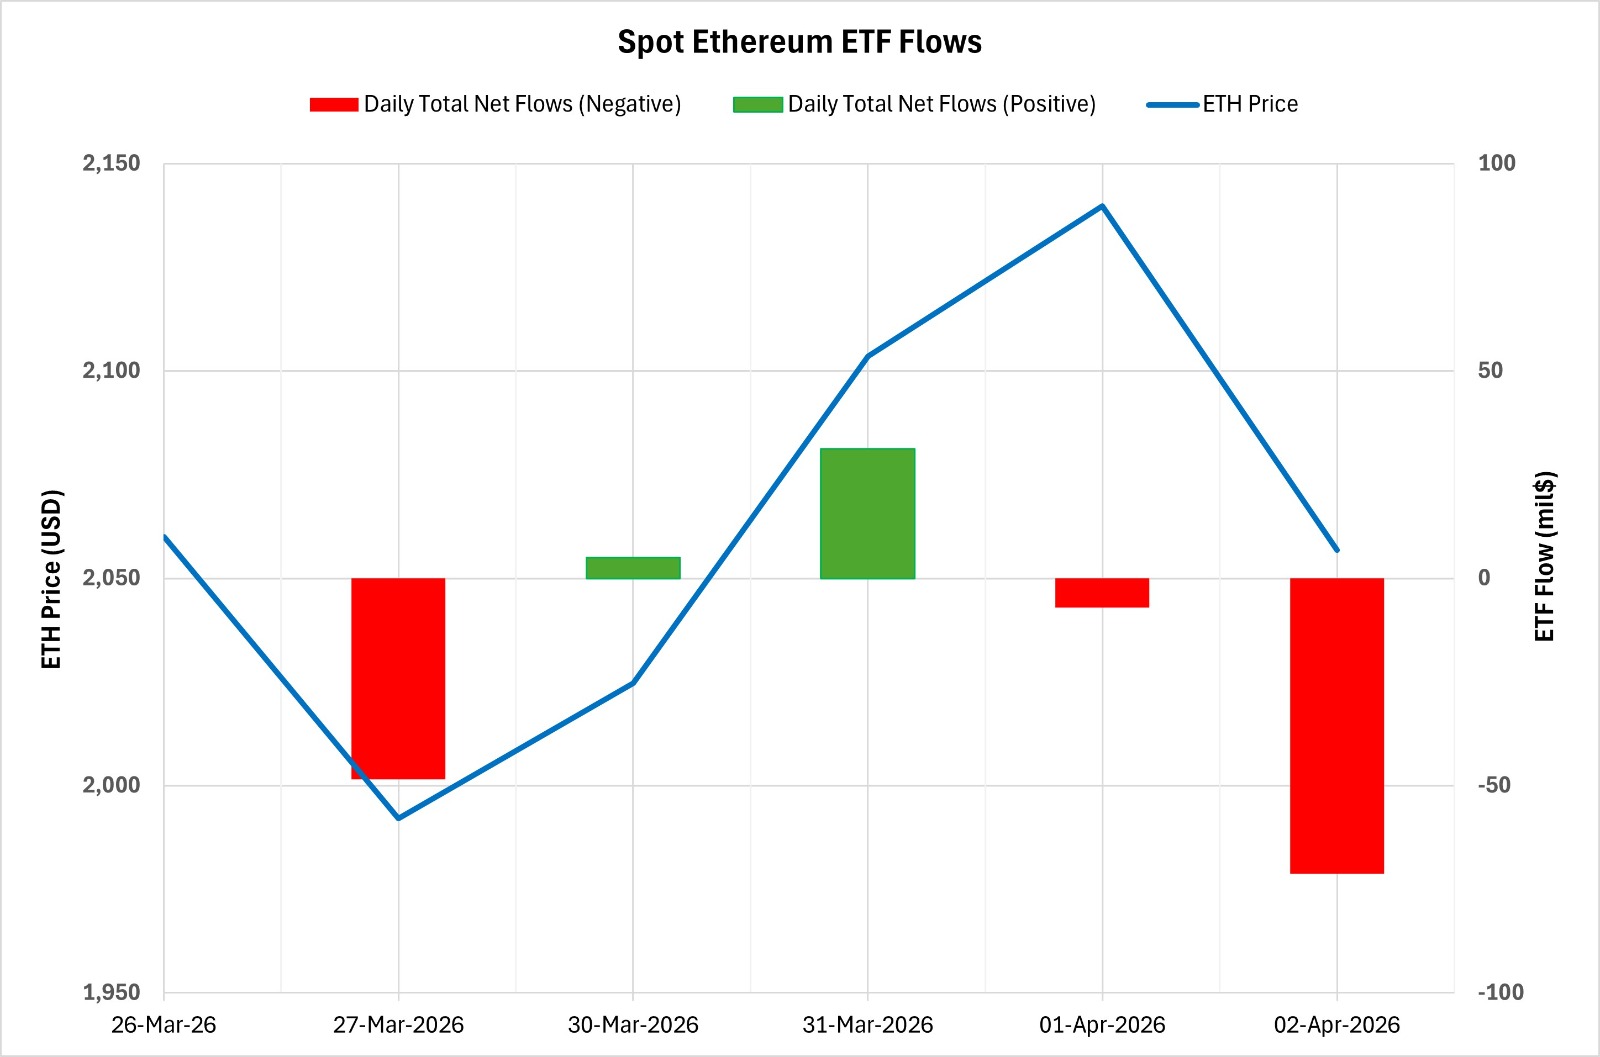
Between March 27 and April 2, 2026, there was a total net outflow of $90.6 million from Spot Ethereum ETFs. While ETF flows generally exhibited a volatile pattern during this period, the negative trend remained dominant. Although a brief recovery was observed on March 30 and 31 with net inflows of $5 million and $31.2 million, respectively, the strong outflows of $48.5 million on March 27 and $71.2 million on April 2 defined the overall negative trend for the period. This pattern indicated that institutional investors maintained a cautious stance and that inflows struggled to sustain momentum. Looking at individual funds, BlackRock ETHA saw a notable outflow. With these developments, the cumulative total net inflow for Spot Ethereum ETFs fell to $11.51 billion by the end of the 426th trading day.
| Date | Coin | Price | ETF Flow (mil$) | ||
|---|---|---|---|---|---|
| Open | Close | Change % | |||
| March 27, 2026 | ETH | 2,060 | 1,992 | -3.29% | -48.5 |
| March 30, 2026 | ETH | 1,983 | 2,025 | 2.09% | 5 |
| March 31, 2026 | ETH | 2,025 | 2,104 | 3.90% | 31.2 |
| April 1, 2026 | ETH | 2,104 | 2,140 | 1.72% | -7.1 |
| April 2, 2026 | ETH | 2,140 | 2,057 | -3.88% | -71.2 |
| Total (March 27 – April 2, 2026) | — | — | — | -0.15% | -90.6 |
On the price front, Ethereum opened at $2,060 on March 27 and closed at $2,057 on April 2. During this period, the ETH price experienced a limited decline of 0.15%. While a recovery in prices was observed, particularly on March 30–31 in line with ETF inflows, the final trading day saw both ETF outflows and a sharp 3.88% drop. Overall, this period indicated a continuation of negative and volatile flow patterns in Spot Ethereum ETFs, with institutional demand remaining weak and diverging across funds. While the persistence of ETF outflows remains a factor that could increase downward pressure on prices, a healthier recovery in the Ethereum price could be observed if strong and stable inflows resume.
Legal Notice
The investment information, comments, and recommendations contained in this document do not constitute investment advisory services. Investment advisory services are provided by authorized institutions on an individual basis, taking into account each person’s risk and return preferences. The comments and recommendations contained in this document are of a general nature. These recommendations may not be suitable for your financial situation or your risk and return preferences. Therefore, making an investment decision based solely on the information contained in this document may not result in outcomes that align with your expectations.
