TABLE OF CONTENT
hide
MARKET SUMMARY
Latest Situation in Crypto Assets
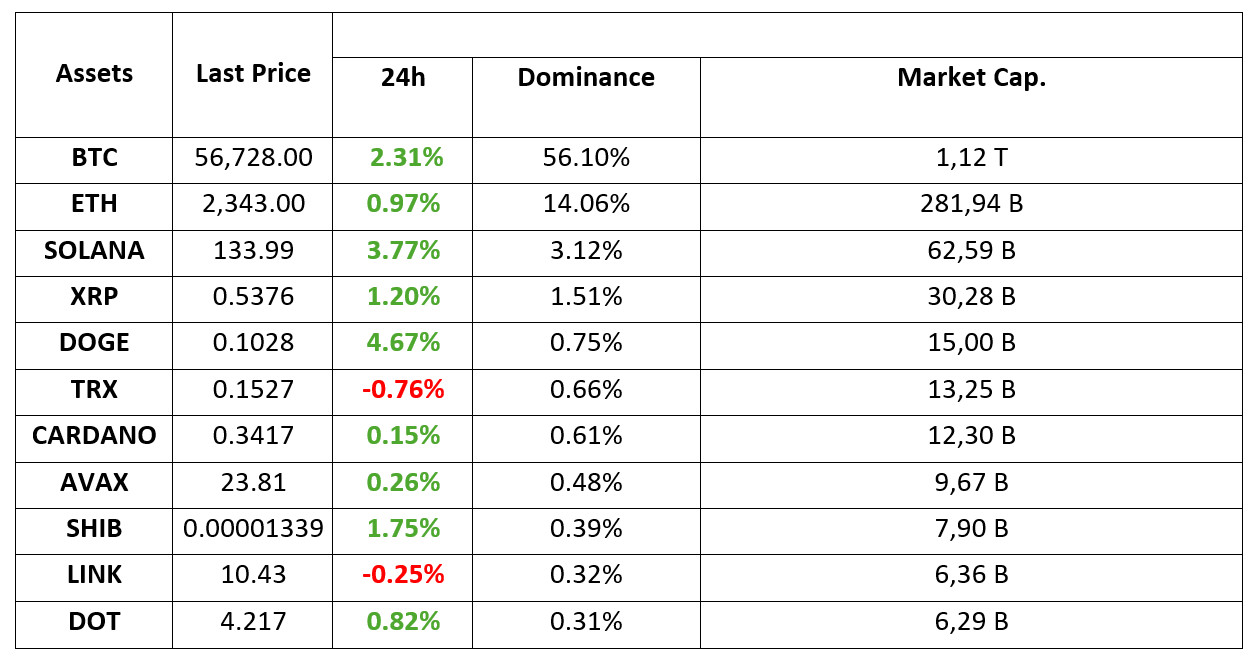
*Table prepared on 10.09.2024 at 14:00 (UTC)
WHAT’S LEFT BEHIND
Harris, Who Will Debate Trump, Didn’t Include Crypto Again
It was noteworthy that the policy position paper presented by US Vice President Kamala Harris on tonight’s debate with Donald Trump did not include any plans for cryptocurrencies.
FED’s Interest Rate Cut May Bring a Decline for Bitcoin
According to 10x Research, the possible interest rate cut by the US Federal Reserve on September 17 may cause a decline in Bitcoin contrary to expectations. Experts stated that a 50 basis point cut would have a negative impact.
Whales Continue to Collect Bitcoin at Low Prices
Large whale accounts continue to take advantage of the drop in Bitcoin prices. Overnight, three whales withdrew 900 BTC from Binance to newly opened wallets.
Japanese Company Metaplanet Buys Another 38.46 Bitcoin
Japan-based Metaplanet increased its Bitcoin holdings by another 38.46 BTC, bringing its total reserves to 398,832 BTC. The company continues its growth strategy in the cryptocurrency space.
Putin: Russia Leads the World in Bitcoin Mining
Russian President Vladimir Putin announced at the Eastern Economic Forum that Russia produced 54,000 Bitcoins in 2023 and is one of the world leaders in mining.
Tether and Tron Partner Against Crypto Crime
Tether, Tron and TRM Labs have announced a partnership to fight cryptocurrency crime. This partnership aims to increase security in the industry.
HIGHLIGHTS OF THE DAY

INFORMATION
*The calendar is based on UTC (Coordinated Universal Time) time zone. The economic calendar content on the relevant page is obtained from reliable news and data providers. The news in the economic calendar content, the date and time of the announcement of the news, possible changes in the previous, expectations and announced figures are made by the data provider institutions. Darkex cannot be held responsible for possible changes that may arise from similar situations.
MARKET COMPASS
The key dynamic that dominates prices continues to be the health of the US economy and expectations for monetary policy changes by the Federal Reserve (FED). In this regard, the focus will be on the US inflation indicators to be released tomorrow. Before that, the debate between US Presidential candidates Trump and Harris on a TV channel on Wednesday morning (01:00 UTC) will be closely watched. Recent polls indicate that the gap is closing in favor of Trump, albeit slightly.
As the pessimistic mood following the resurgence of recession concerns dissipated, digital currencies also found a breathing space. However, the fragility in risk appetite suggests that one should not be too eager for new strong rallies. This is also reflected in BTC, which has moved into sideways price changes after overcoming several tough resistances. While the belief that the FED will cut interest rates by 25 basis points on September 18 has increased again, the direction may become a little more clear after tomorrow’s inflation data. In addition, the fact that Trump and Harris will meet for the first time keeps the presidential race alive.
While we have experienced a similar pricing pattern in September as in early August, it is hard to say that we have yet to see any new signs that the worst is behind us. In this context, long positions need to be monitored as closely as short positions. The futures and options market is also not yet convinced that investors are brave enough to brave possible downturns. Therefore, we think that it will be useful to be careful against the risk aversion in this picture. We can say that the view that “it makes more sense to look for a long position”, which we underlined when the BTC price fell to 53 thousand levels, is no longer valid due to the horizontal movement and a more open outlook for short-term declines.
TECHNICAL ANALYSIS
BTC/USDT
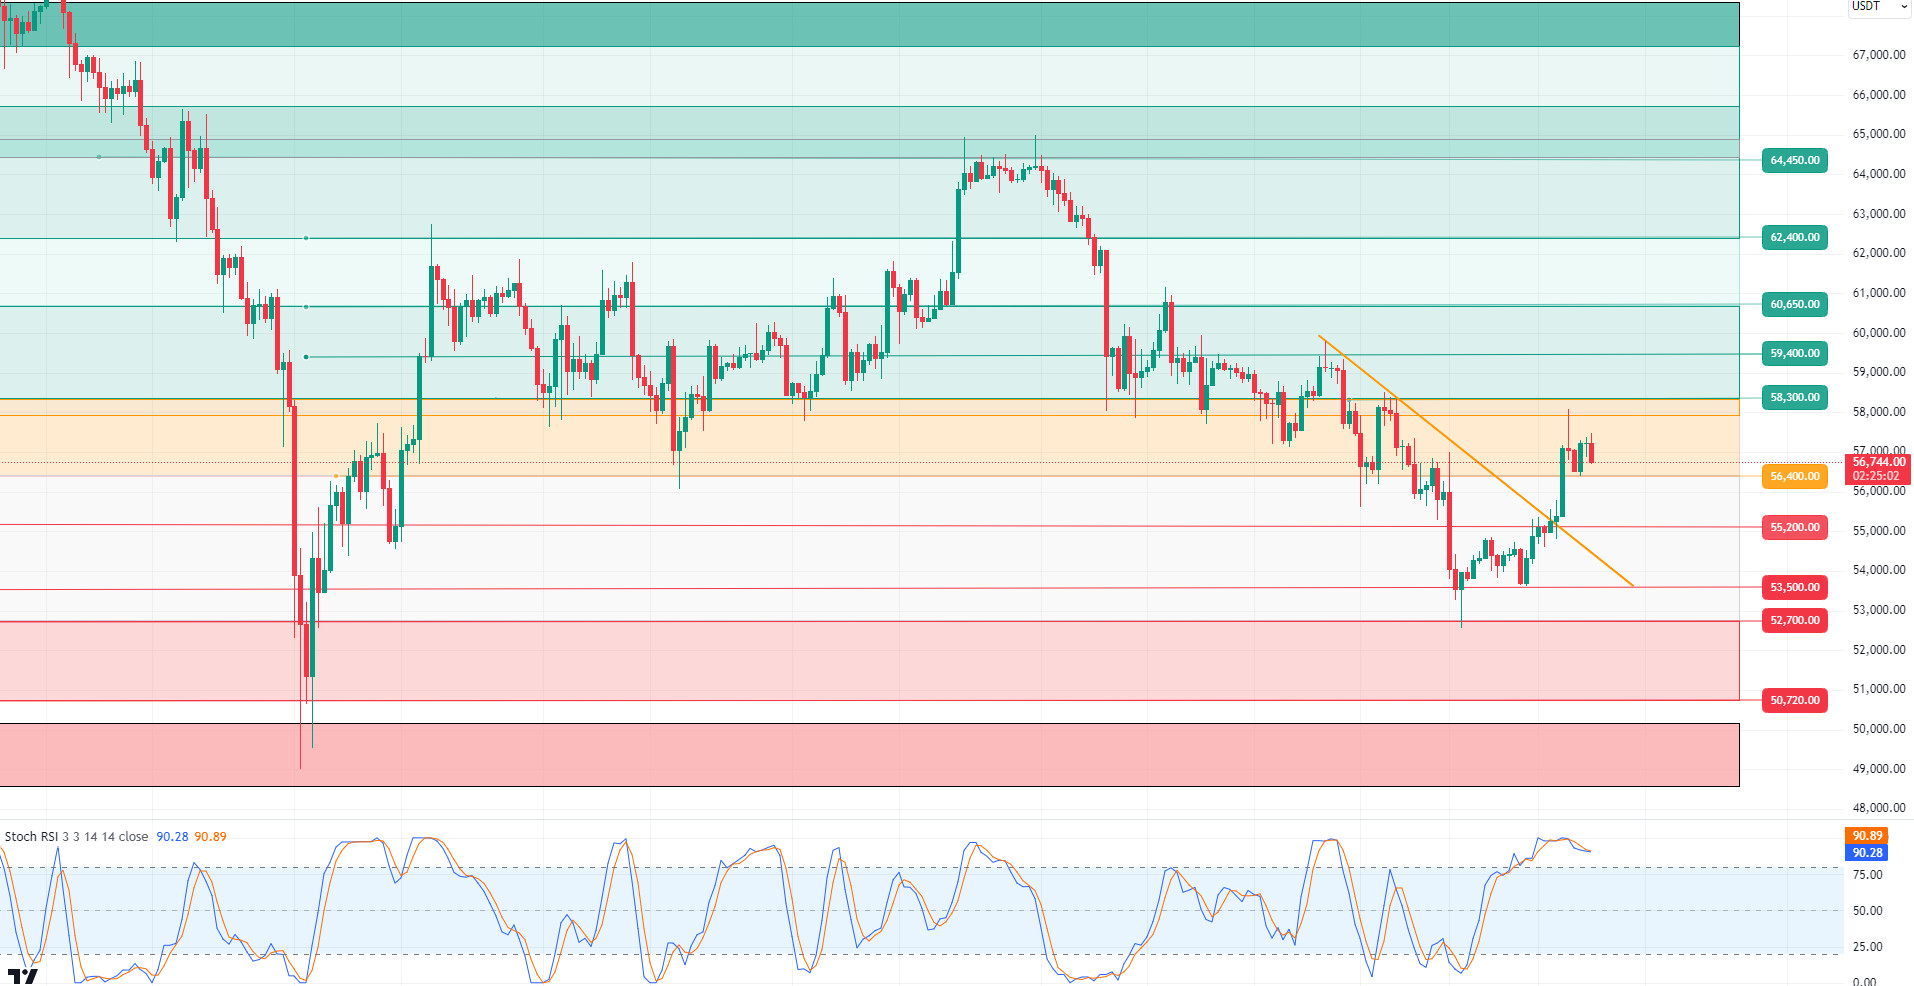
The course of Bitcoin ETFs is changing! Bitcoin ETFs saw a significant inflow of $28.72 million yesterday after eight days of net outflows. This development can be considered positive in terms of market dynamics. Although it is not a large inflow, an optimistic mood may prevail in the market with the change of course. Today, the development that we will keep an eye on will be the meeting of D. Trump and Kamala Harris in an interview. Developments that will bring D.Trump forward in the election polls at the end of the interview are critical for Bitcoin. In addition, with the inflation data coming from the US tomorrow, volatility may increase in the remaining days of the market. In the BTC 4-hour technical analysis, the price, which was stagnant during the day, is experiencing activity shortly before the US stock market opening sessions. BTC, which moved in a narrow band range during the day, could not exceed the 57,300 level and retreated a little and is currently trading at 56,750. If the retracement deepens, the 55,200 point may serve as support, and a retracement to this level may bring the bowl handle pattern to the agenda. The optimistic mood after the interview combined with enthusiasm and inflation data pointing to a higher rate of interest rate cut may increase the risk appetite in the market. In this direction, we see 58,300 as the resistance level. Our technical indicator RSI shows a negative mismatch with the market, which may indicate an increase in risk appetite.
Supports 55,200 – 56,400 – 53,500
Resistances 57,200 – 58,300 – 59,400
ETH/USDT
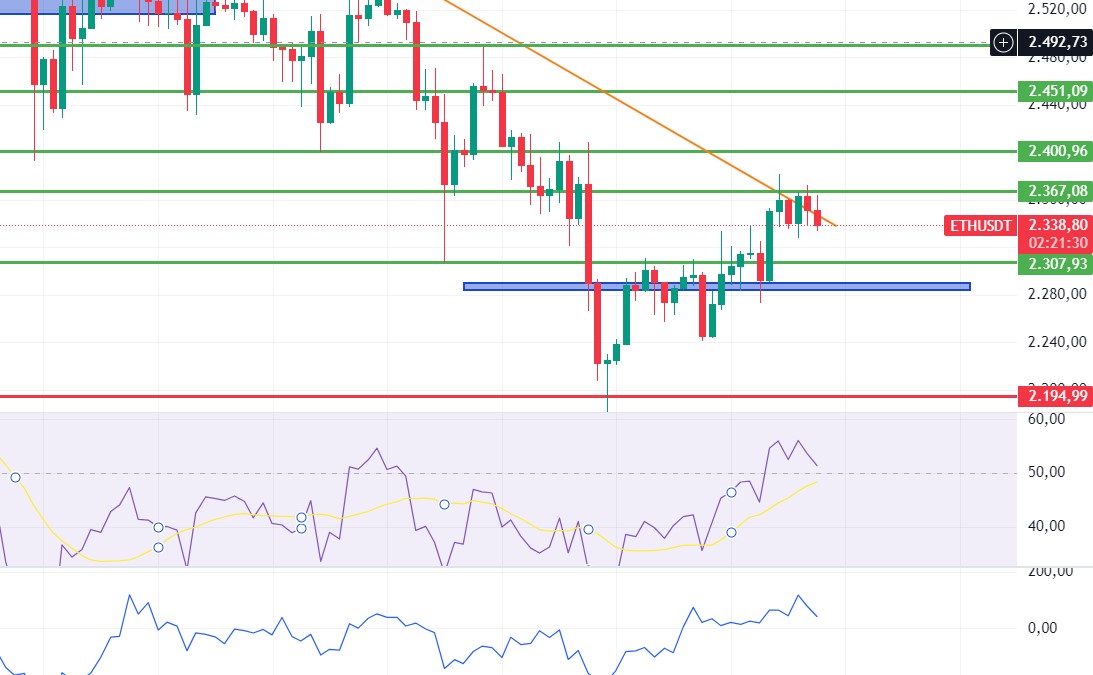
Rejected again from 2,367 resistance, Ethereum entered the downtrend. In order to talk about the positive structure again, it is of great importance to gain the 2,367 level. With the recent rise, it is seen that funding rates have turned positive again. This is no longer a problem with the price rising with spot purchases, but considering the amount of Ethereum held by Metalpha on exchanges, it would be correct to reduce the risk rates in transactions. Momentum and RSI are also seen to be heading down again. Under these conditions, if 2,367 cannot be broken with volume, a decline to 2,307 levels may come. If 2,367 is broken, 2,400 and then 2,450 levels may come.
Supports 2,289 – 2,194 – 2,112
Resistances 2,367 – 2,400 – 2,436
LINK/USDT
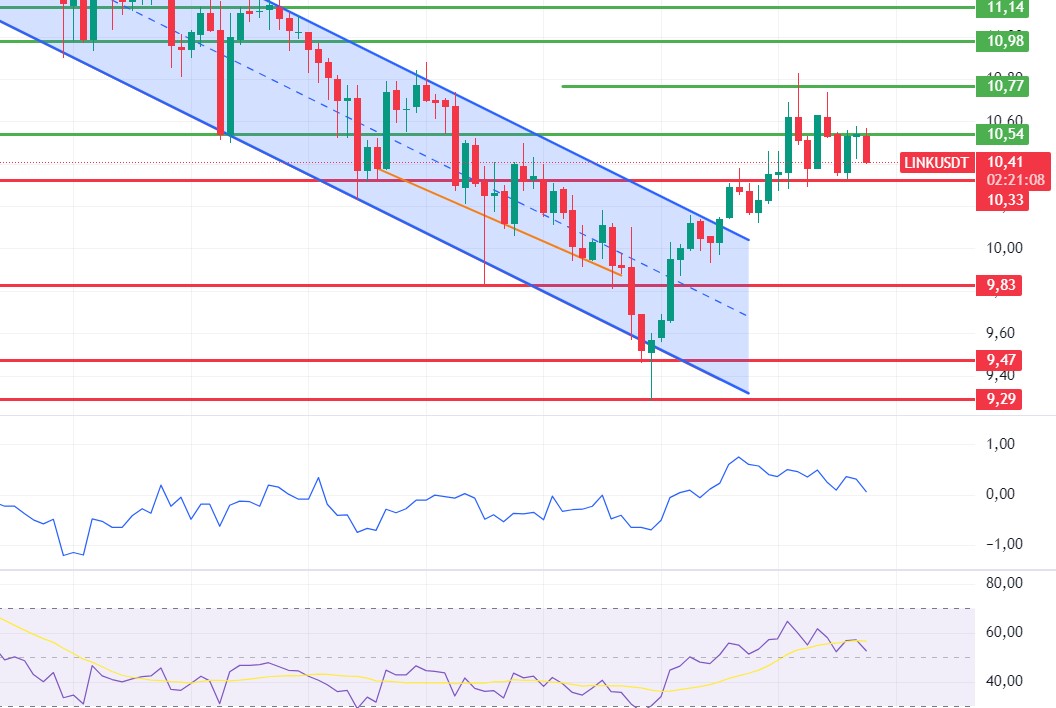
LINK, which had difficulty exceeding the 10.54 level, came to some down levels again. Momentum and RSI started to form negative structures. Provided that the 10.54 resistance level is not exceeded, it may start a negative movement. If 10.33 support is broken, the decline may deepen. Exceeding the 10.54 level may bring an increase up to 10.77.
Supports 10.33 – 9.82 – 9.47
Resistances 10.54 – 10.98 – 11.45
SOL/USDT
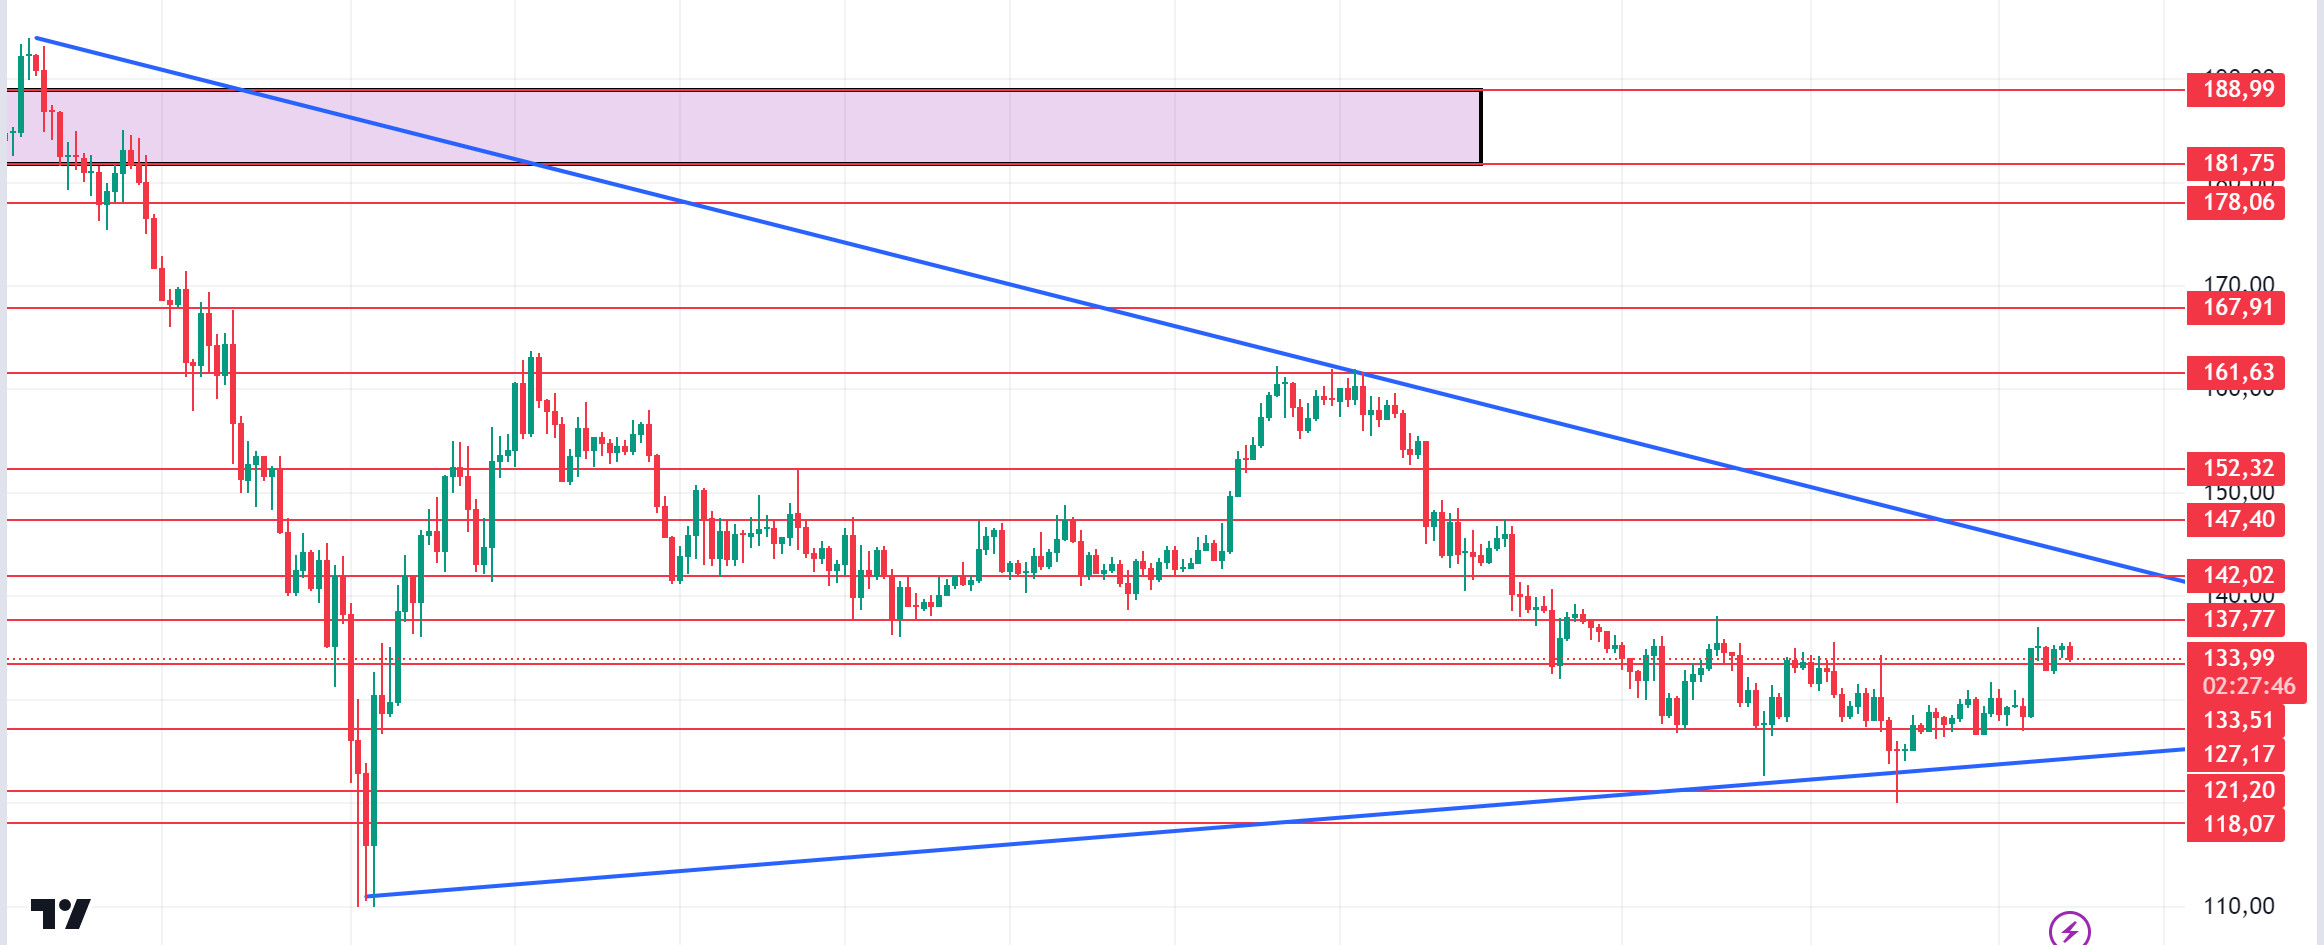
SOL has established a solid support level above $122 in recent months. Data shows that whale investors are accumulating more SOL amid the bearish trend. Data from CoinShares shows that Solana recorded a cash inflow of about $6.2 million last week. And just yesterday, data from Lookonchain shows that a whale bought 14,000 units of SOL worth about $1.84 million in the last 24 hours. Active addresses are on the rise, with about 5.4 million active addresses recorded in the last 24 hours. Technically, we see a narrowing triangle pattern. SOL, which has been accumulating in a certain band since April, may test 137.77 – 142.02 resistance levels if the rises continue due to the increase in volumes. In case of profit sales due to yesterday’s rises, support levels 133.51 – 127.17 should be followed.
Supports 133.51 – 127.17 – 121.20
Resistances 137.77 – 142.02 – 147.40
ADA/USDT
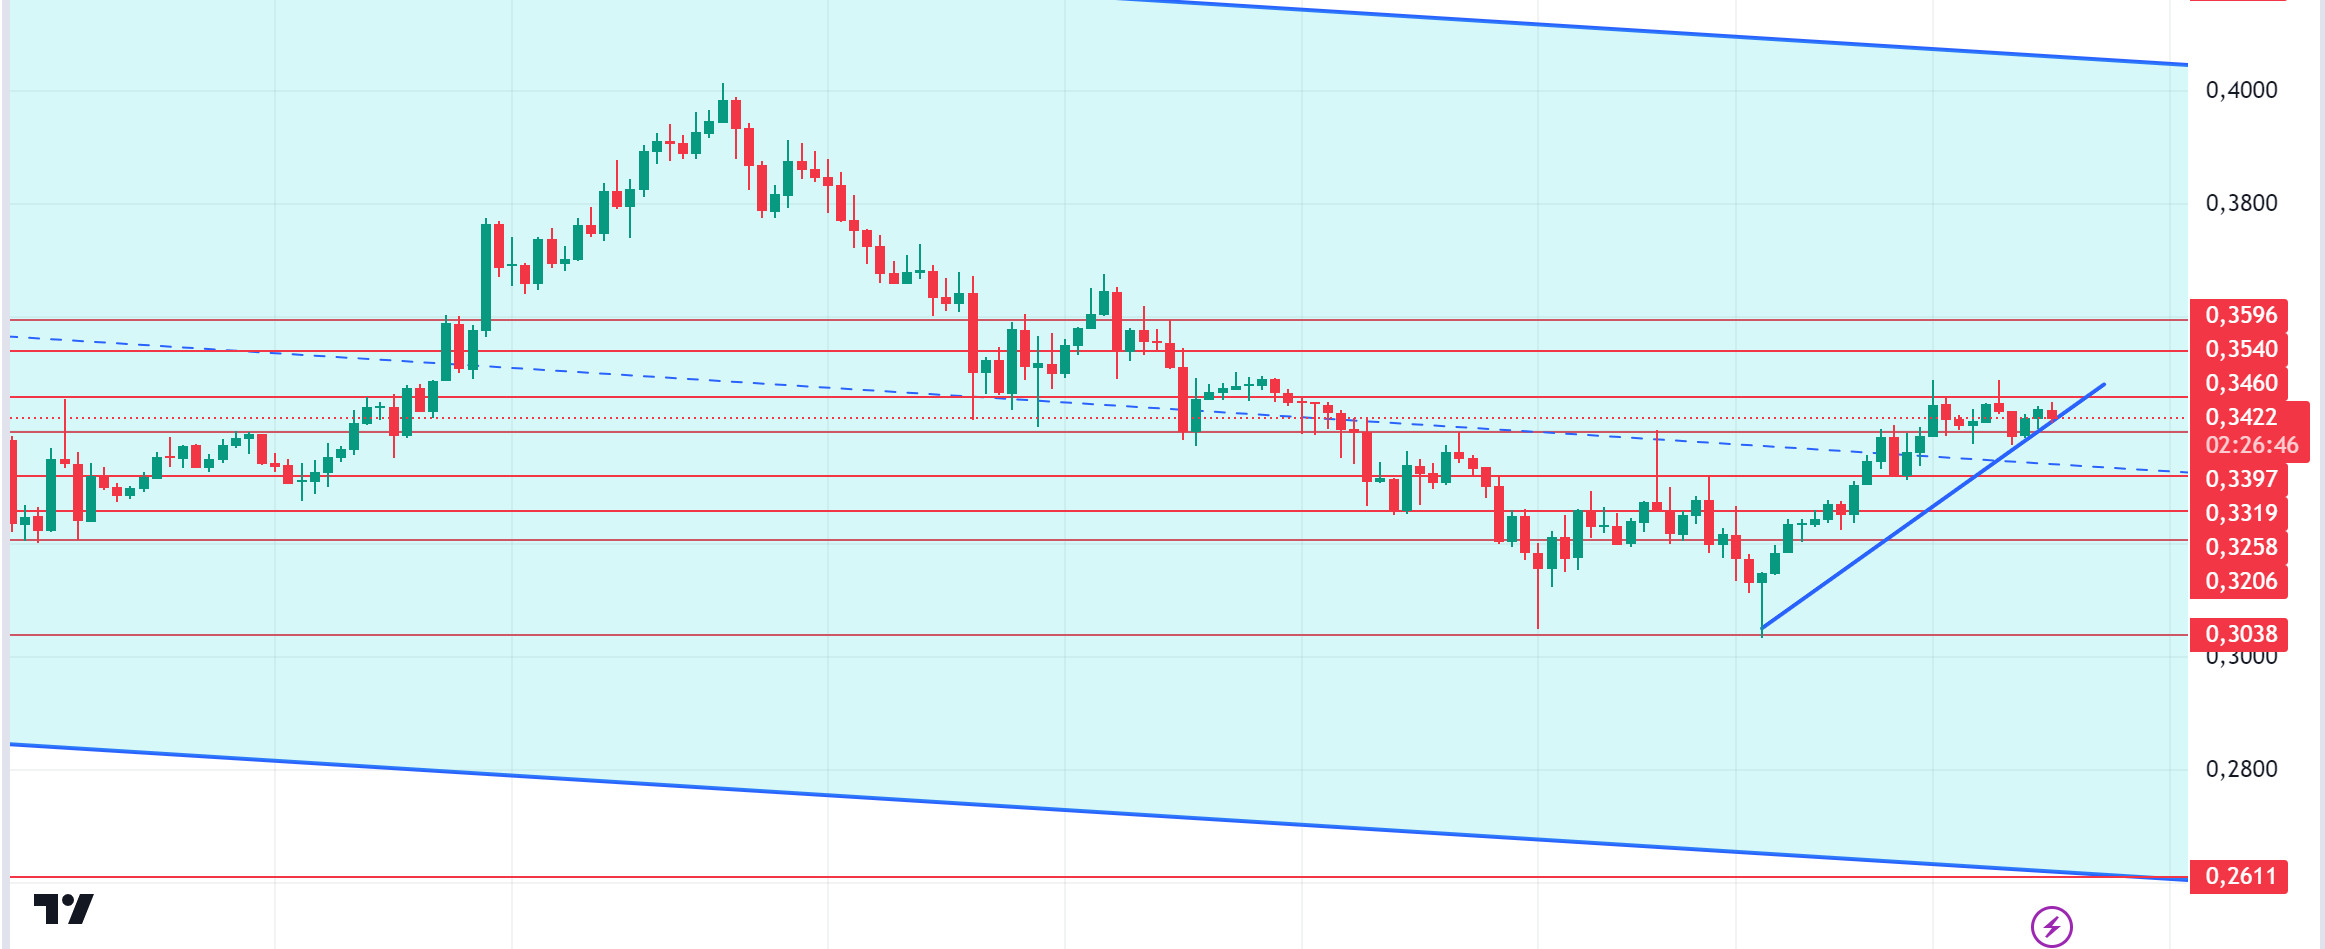
Will bitcoin gain some momentum this week, or will macroeconomic data push it lower? If we look at past timeframes, September has been a difficult month for bitcoin. But in October, it usually tends to rebound. ADA seems to be torn between rebounding or rallying. However, updates may mean that the rally is not far away. At the same time, the long-short ratio and stock market outflows indicate that it will increase. When we look at the chart of ADA, it is priced at the middle levels of the falling channel. ADA, which made a double bottom at 0.3038, continues to be priced with purchases by experiencing a rise due to the innovations brought by the update, which may bring the price to 0.3540 – 0.3596 levels. Due to the retracements, the support place to look at is 0.3397 – 0.3319 levels can be followed.
Supports 0.3397 – 0.3319 – 0.3258
Resistances 0.3460 – 0.3540 – 0.3596
AVAX/USDT
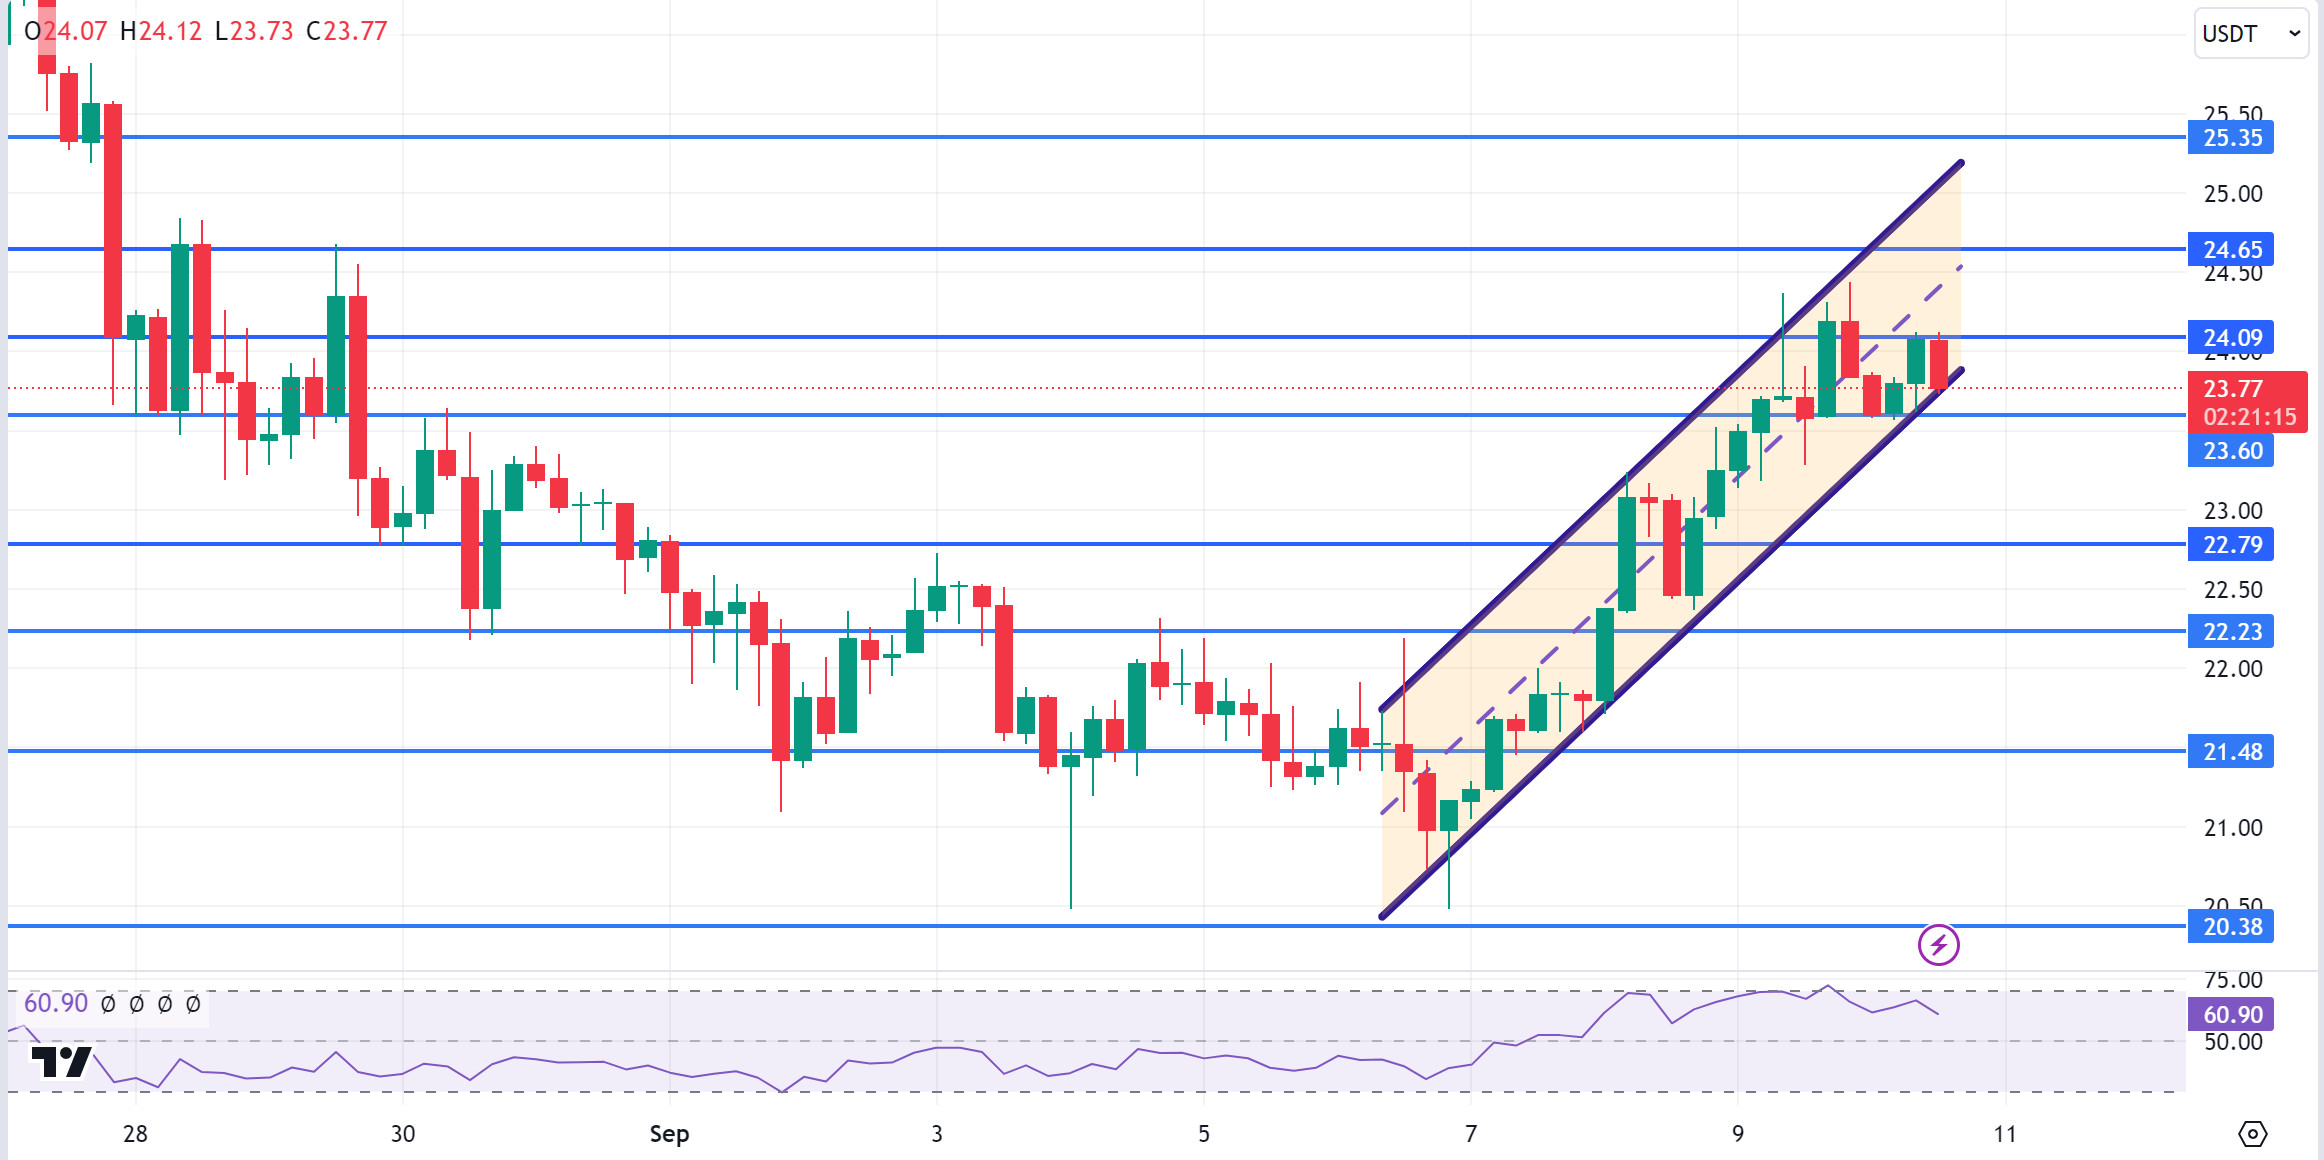
AVAX, which opened today at 23.85, is trading at 23.77 after the opening of the US stock markets. On the 4-hour chart, it continues its movement within the rising channel. It is in the lower band of the channel and may want to move towards the middle and upper band with the reaction it will receive from here. In such a case, it may test the 24.09 and 24.65 resistances. If it fails to get a reaction from the lower band of the channel and breaks the 23.60 support downwards, it may test the 22.79 and 22.23 supports. As long as it stays above 20.38 support during the day, we can expect it to maintain its upward demand. With the break of 20.38 support, sales may deepen.
Supports 23.60 – 22.79 – 22.23
Resistances 24.09 – 24.65 – 25.35
TRX/USDT
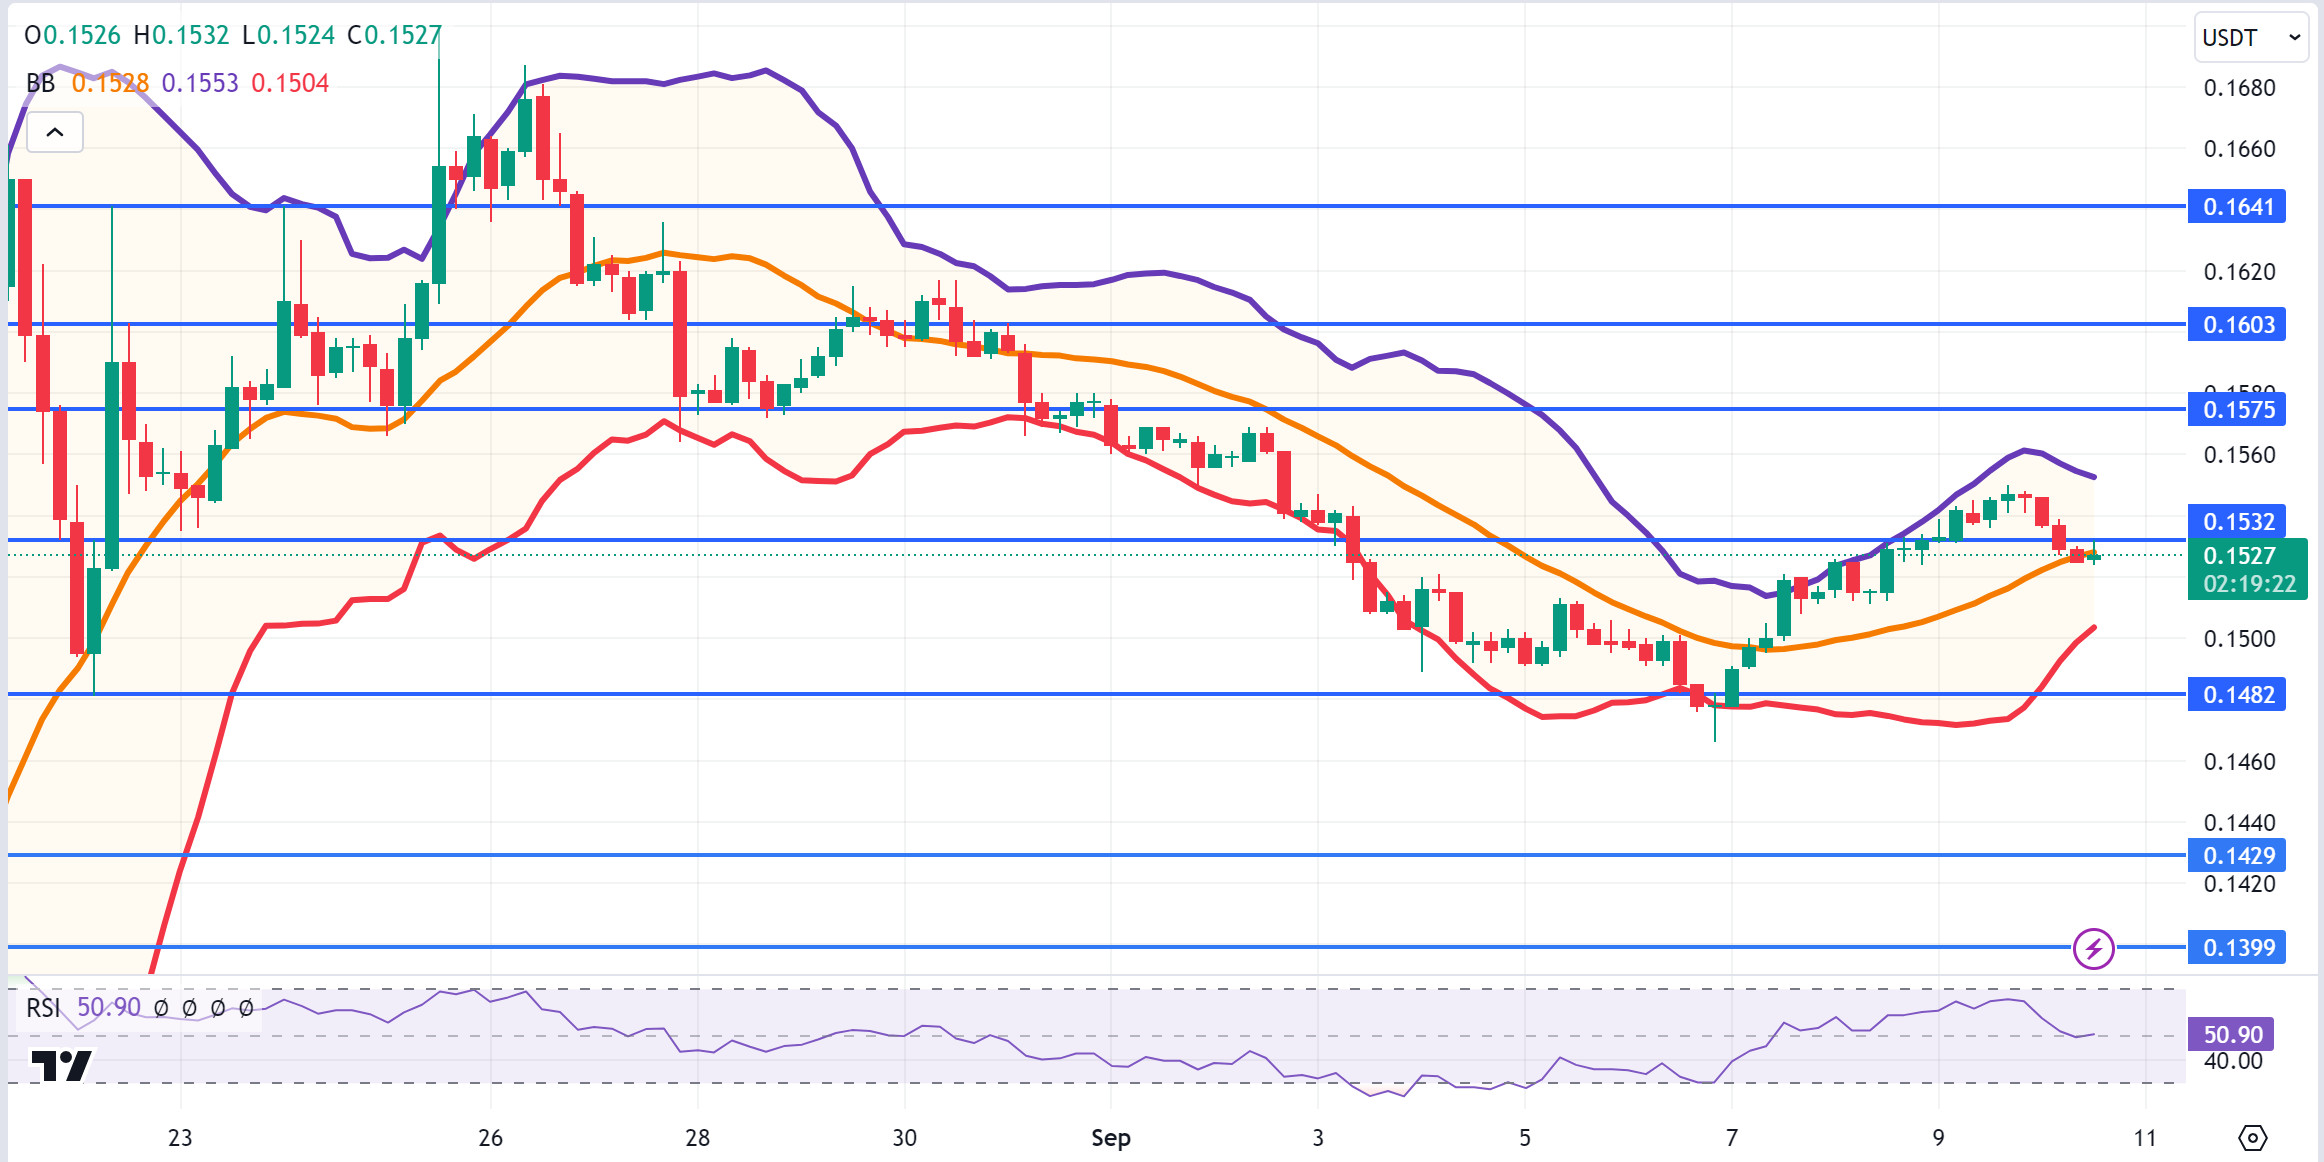
TRX, which started today at 0.1546, is trading at 0.1527, down about 1%. Since there is no planned data that will affect the markets during the day, volatility can be expected to be low as a result of low volumes. TRX is at the Bollinger mid-band on the 4-hour chart. Since 0.1532 support has broken downwards, it can be expected to move to the lower band. In such a case, it may want to test 0.1482 support. However, with a buying reaction from here, it may break the 0.1532 resistance and go to the Bollinger upper band. As long as TRX stays above 0.1482 support, it can be expected to continue its upward desire. If this support breaks down, selling pressure may increase.
Supports 0.1482 – 0.1429 – 0.1399
Resistances 0.1532 – 0.1575 – 0.1603
XRP/USDT
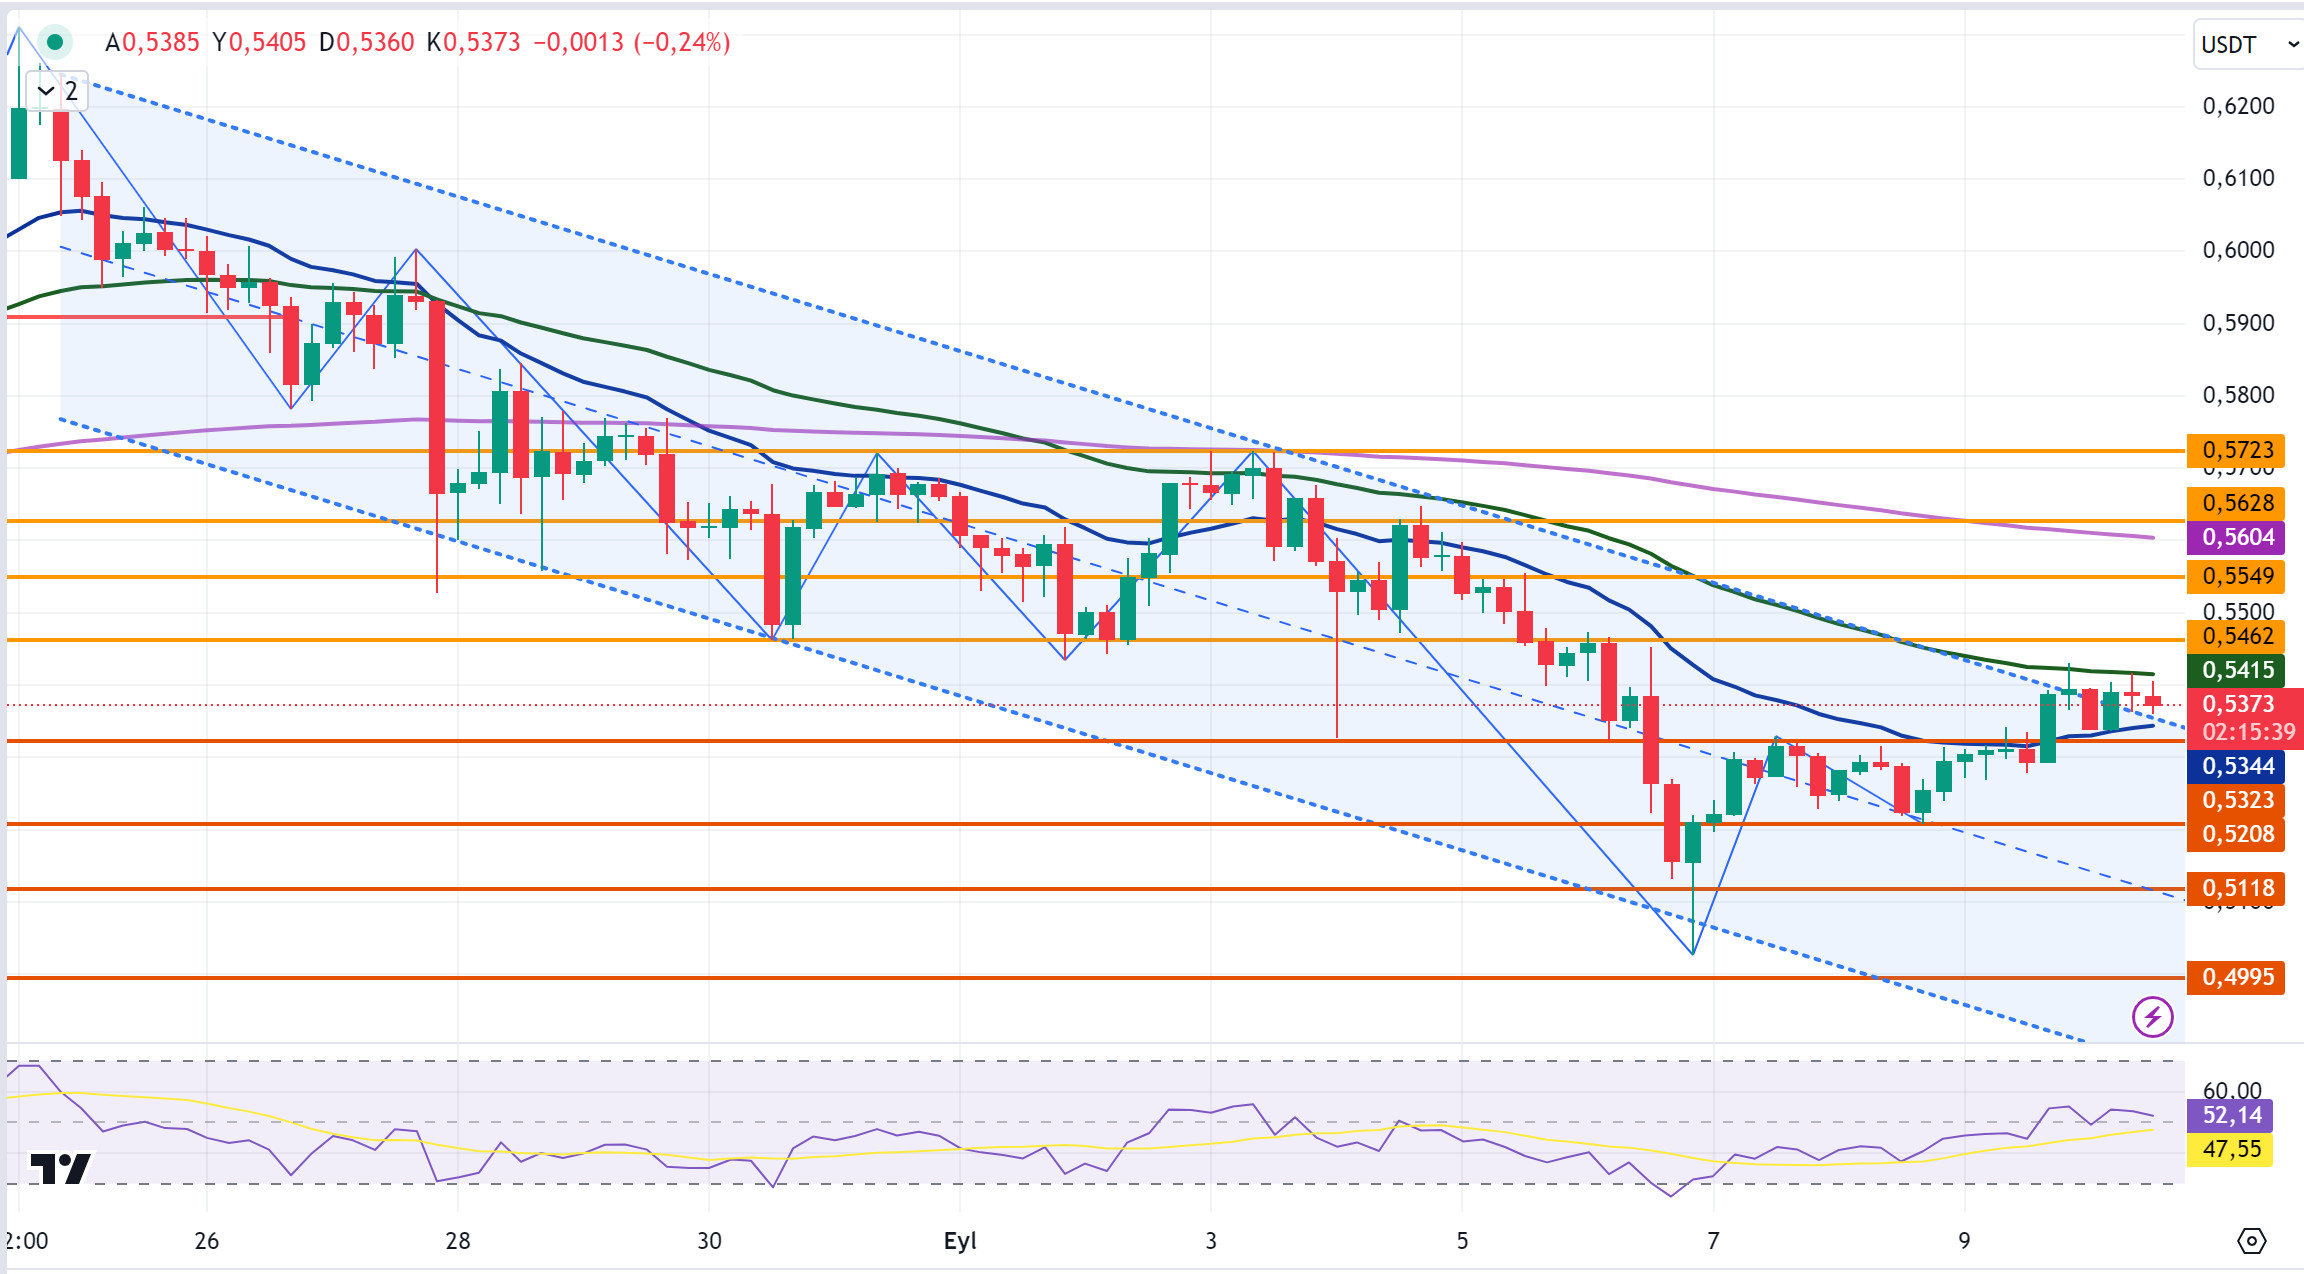
After starting today at 0.5392, XRP tested the EMA20 (Blue Color) level with the decline it experienced in the 4-hour analysis and then started to rise with the reaction purchases. XRP’s rise did not last long and during its rise, it tested the EMA50 (Green Color) level and failed to break it and went down. In the 4-hour analysis, XRP continues to move in a horizontal band between the EMA20 support level and the EMA50 resistance level and is currently trading at 0.5373.
In the 4-hour analysis, XRP may test the support levels of 0.5323-0.5208-0.5118 if it breaks the EMA20 level after retesting the EMA20 level with a decline and the decline continues. In the event that it turns bullish, it may test the resistance levels of 0.5462-0.5549-0.5628 in the continuation of the rise by retesting and breaking the EMA50 level.
If XRP retests and breaks the EMA20 level, it may continue to decline and offer a short trading opportunity. In the opposite scenario, if XRP retests and breaks the EMA50 level with a bullish retest, it may continue to rise and offer a long trading opportunity.
Supports 0.5323 – 0.5208 – 0. 5118
Resistances 0.5462 – 0.5549 – 0.5628
DOGE/USDT
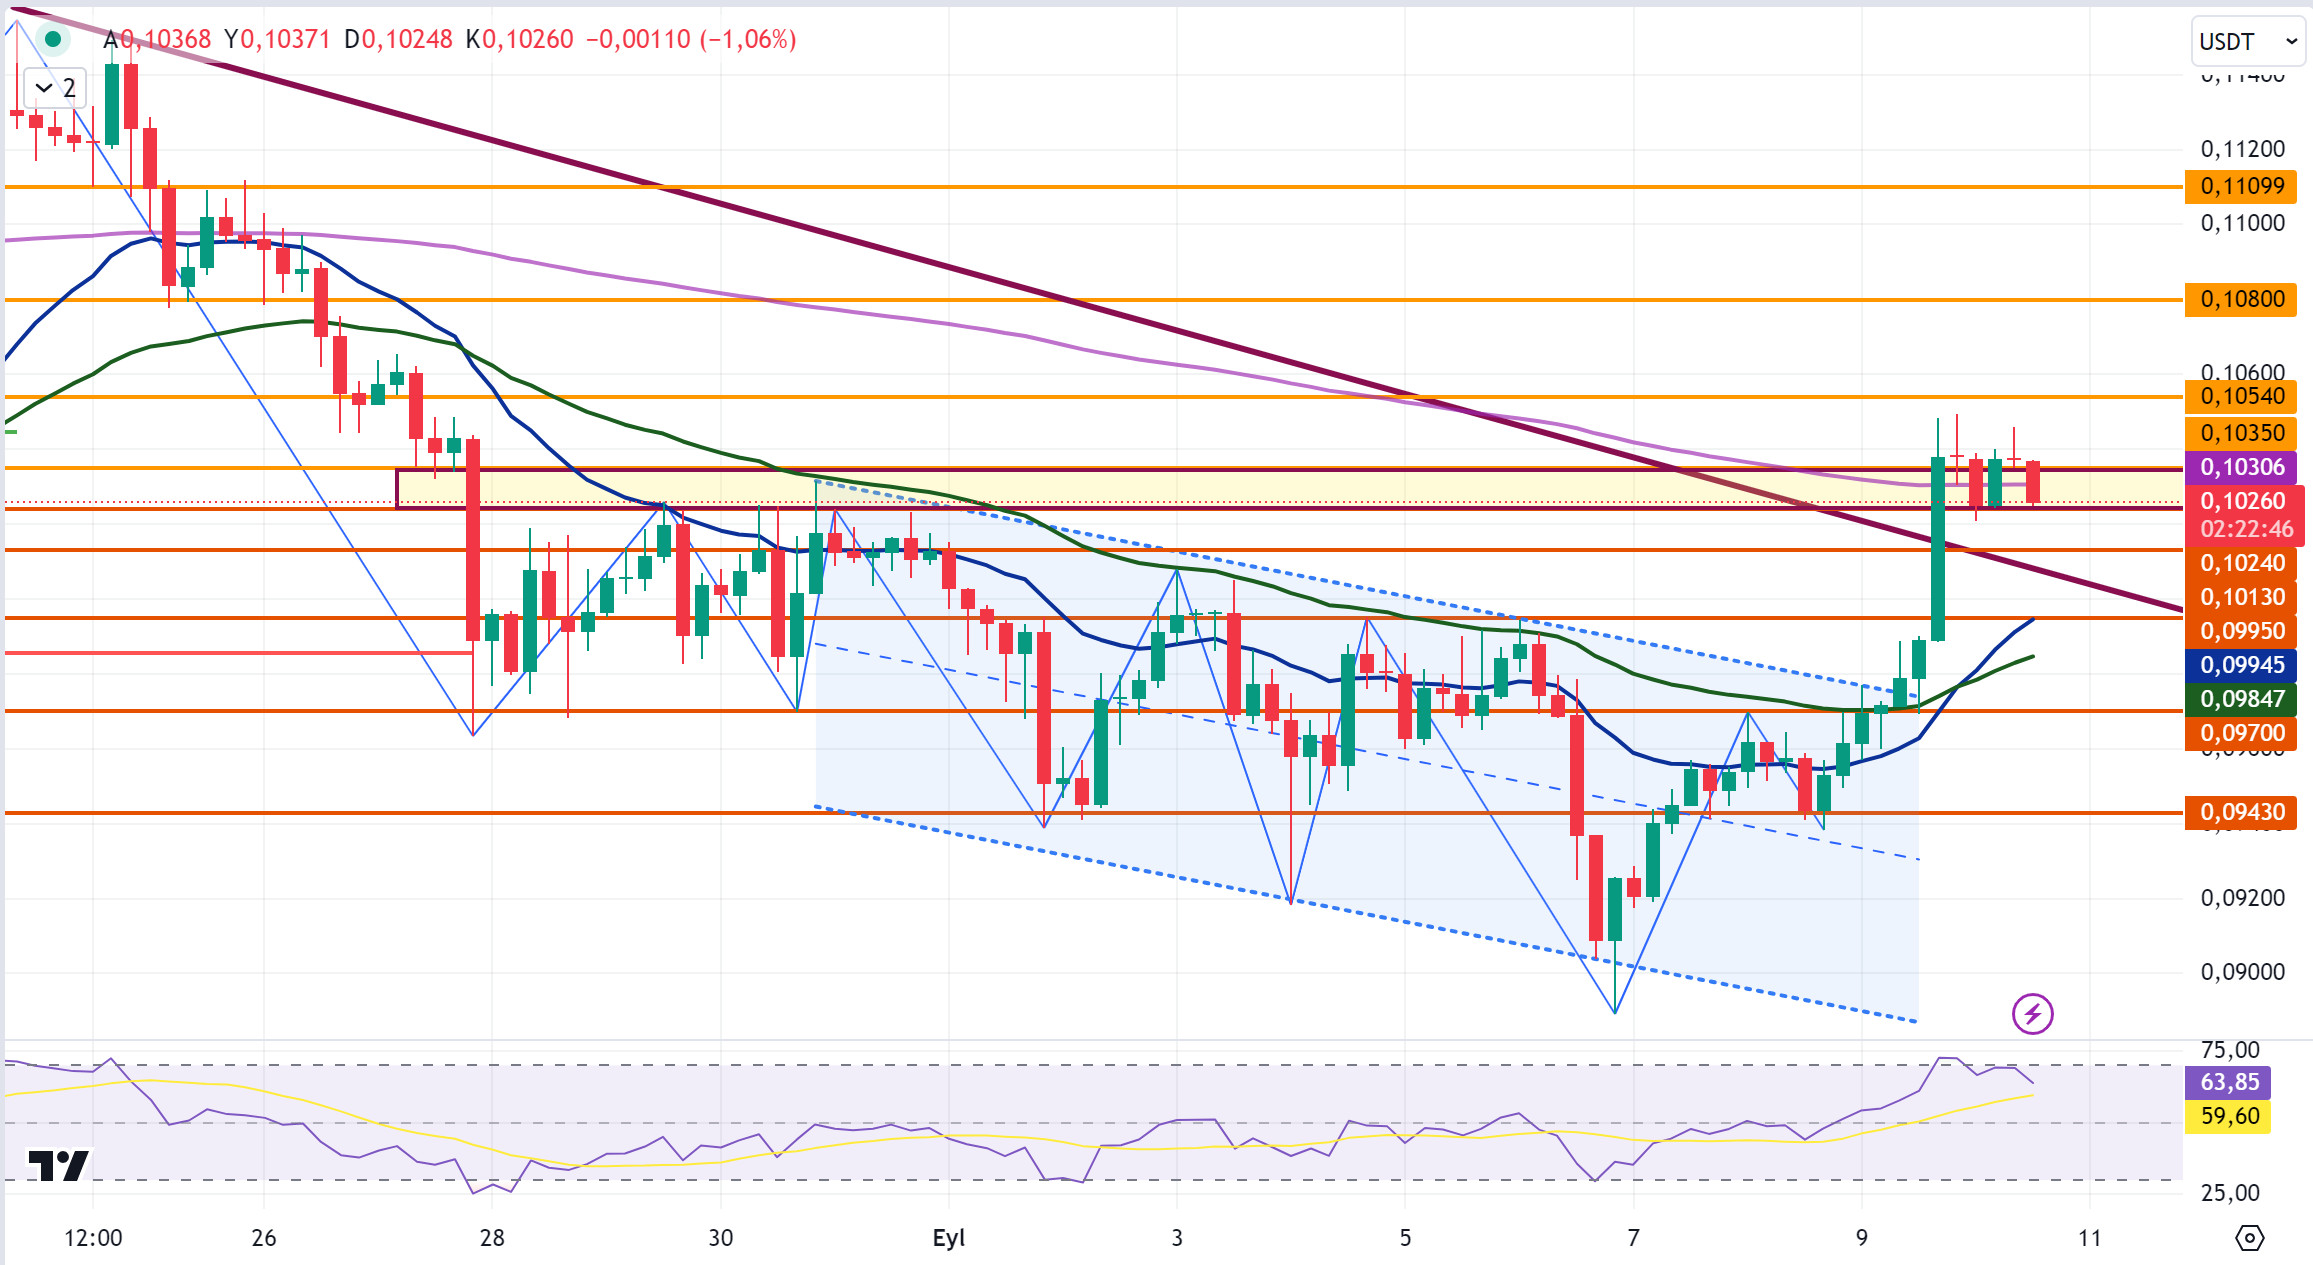
After starting today at 0.1037, DOGE fell in the first candle in the 4-hour analysis and tested the 0.1024 level and started to rise with the reaction purchases. With its rise, it broke the 0.1035 level at first and traded above it, then declined to 0.1024-0.1035 horizontal band with a decline.
In the 4-hour analysis, DOGE, which tested the 0.1024 level again with the decline it experienced in the last candle, could not break this level and is currently trading at 0.1026 within the 0.1024-0.1035 horizontal band. DOGE may test the 0.1024 level again with the decline and if it breaks it, it may test the 0.1013-0.0995-0.0970 support levels in the continuation of the decline. If it cannot break the 0.1024 level and the decline gives way to the rise, it can test and break the 0.1035 level and test the 0.1054-0.1080-0.1109 resistance levels in the continuation of the rise.
The live debate between US election rivals Donald Trump and Kamala Harris on ABC may cause volatility in the markets. Future information on the economy may provide short and long trading opportunities.
Supports 0.1013 – 0.0995 – 0.0970
Resistances 0.1054 – 0.1080 – 0.1 109
DOT/USDT
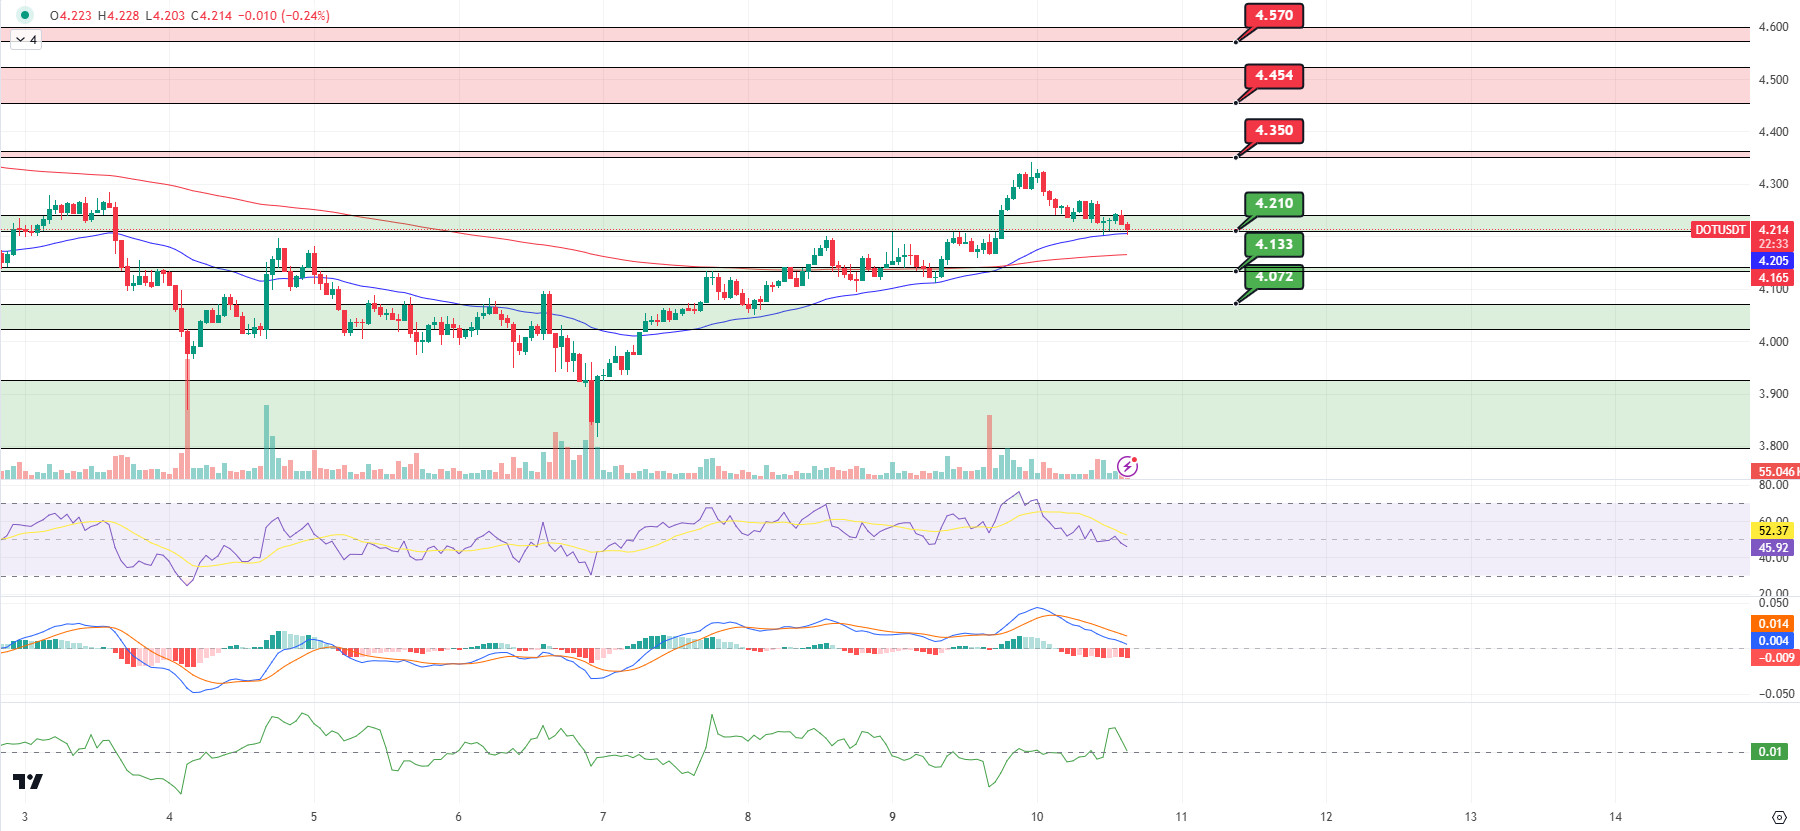
When we examine the Polkadot (DOT) chart, the price seems to have reacted from the 4,210 support band. On the MACD oscillator, we can say that the selling pressure increased compared to the previous hour. If the price fails to hold at this level, we may see a decline towards the EMA200. If the price does not get a reaction from the EMA200, it may move towards the support level of 4.133. On the CMF oscillator, we can say that buyer pressure prevails. In a positive scenario, the price may want to break the selling pressure at the 4,350 resistance band with the reaction from the 4,210 support.
(Blue line: EMA50, Red line: EMA200)
Supports 4,210 – 4,133 – 4,072
Resistances 4.350 – 4.454 – 4.570
SHIB/USDT
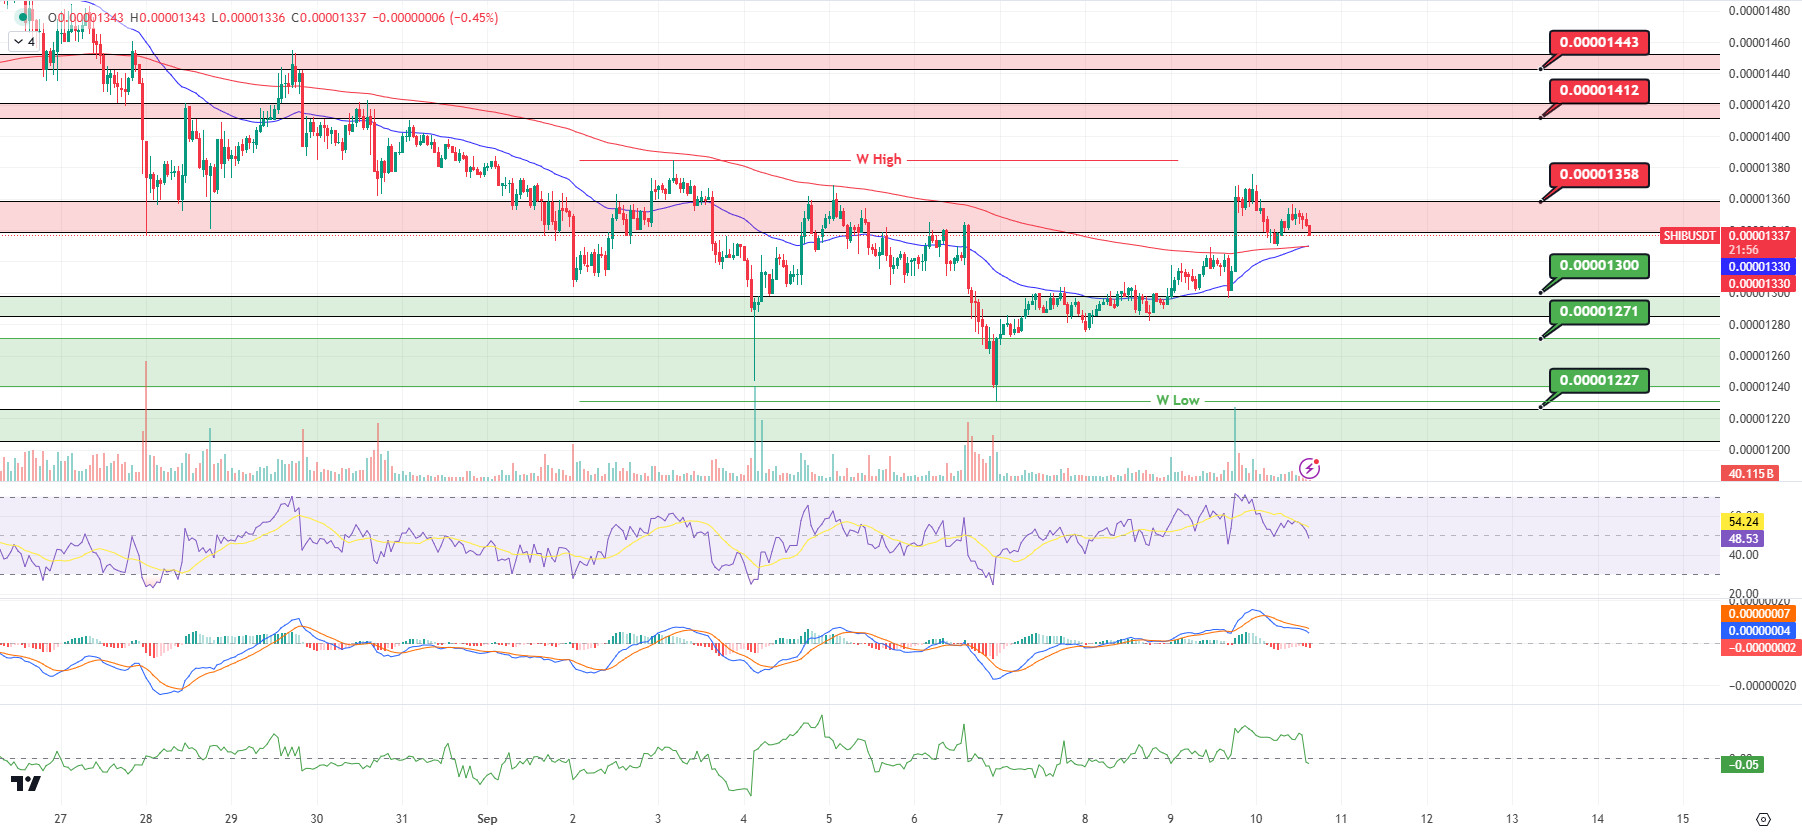
Shiba Inu (SHIB) traded $170 million in the last 24 hours with a volume increase of 43%. Analyzing the chart, we see that the EMA50 broke the EMA200 upwards (Golden Cross). In the positive scenario, if the price breaks the selling pressure at 0.00001358 resistance, it may move towards 0.00001412 resistance. When we analyze the MACD and CMF oscillators, we see that the selling pressure continues. If the price breaks down the EMA50 and EMA200 respectively, we may see a retracement towards 0.00001300 levels.
(Blue line: EMA50, Red line: EMA200)
Supports 0.00001300 – 0.00001271 – 0.00001227
Resistances 0.00001358 – 0.00001412 – 0.00001443
LEGAL NOTICE
The investment information, comments and recommendations contained herein do not constitute investment advice. Investment advisory services are provided by authorized institutions on a personalized basis, taking into account the risk and return preferences of individuals. The comments and recommendations contained herein are of a general nature. These recommendations may not be suitable for your financial situation and risk and return preferences. Therefore, making an investment decision based solely on the information contained herein may not produce results in line with your expectations.


