MARKET SUMMARY
Latest Situation in Crypto Assets
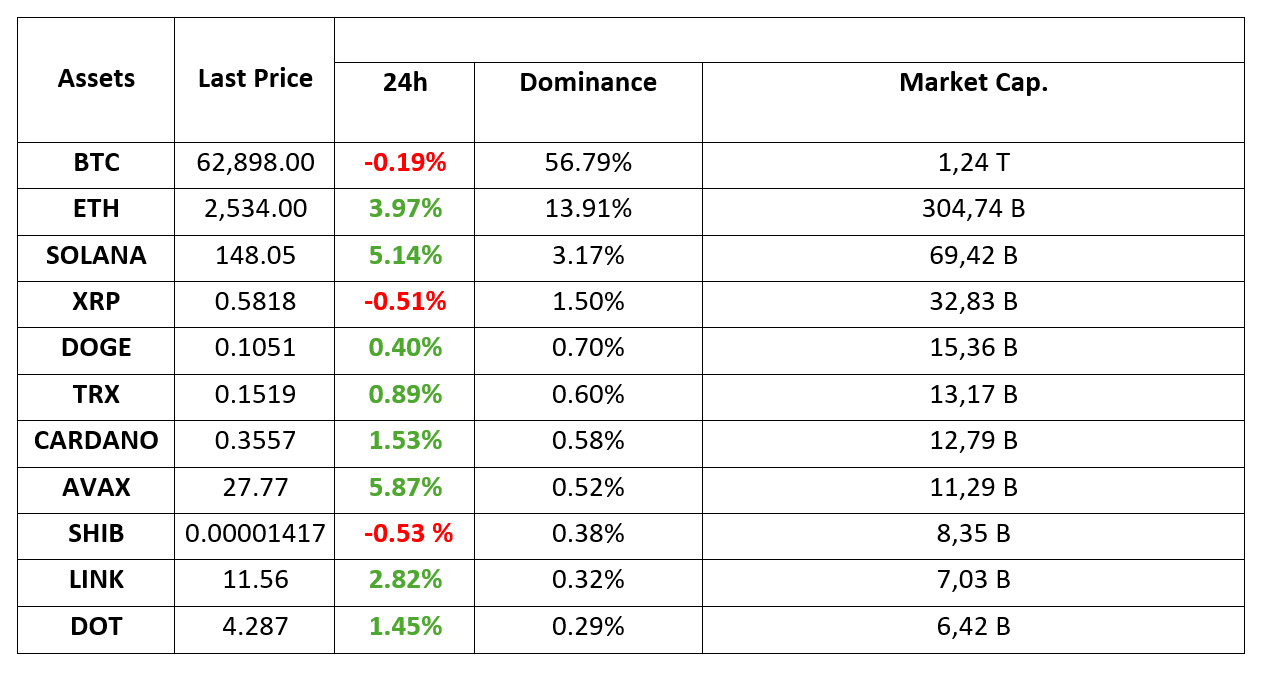
*Prepared on 20.09.2024 at 14:00 (UTC)
WHAT’S LEFT BEHIND
MicroStrategy completes bond sale
MicroStrategy, the world’s largest Bitcoin holding company, announced that it has completed the sales in its recently announced bond issue with a capital of 1 billion dollars. The company aims to make new Bitcoin purchases after paying off its debts with some of the money from here.
5 wallets from the Satoshi era
Five wallets that were mining during the years when Satoshi Nakamoto, the creator of Bitcoin, was active, were activated at the same time and about 15.6 years later. It is not known whether the wallets are linked or belong to the same person. 50 BTC per wallet and 250 BTC in total were transferred to new addresses.
Attack on crypto exchange BingX
Cryptocurrency worth $43 million was stolen in an attack on crypto exchange BingX. The stolen assets include $13.25 million in ether, $2.3 million in BNB and $4.4 million in USDT. The hacker moved the stolen assets to decentralized exchanges.
HIGHLIGHTS OF THE DAY

INFORMATION
*The calendar is based on UTC (Coordinated Universal Time) time zone. The economic calendar content on the relevant page is obtained from reliable news and data providers. The news in the economic calendar content, the date and time of the announcement of the news, possible changes in the previous, expectations and announced figures are made by the data provider institutions. Darkex cannot be held responsible for possible changes that may arise from similar situations.
MARKET COMPASS
After yesterday’s sharp rises on the back of the US Federal Reserve’s 50 basis point rate cut, the country’s stock markets started today with slight profit sales. In Europe, the declines are a bit deeper before ending the week. Also, today is the “triple witching” day in the US, when index futures and options and stock options expire at the same time. Such days tend to increase volatility in the markets.
After the positive mood following the increase in risk appetite, investors turned to take some money off the table. In line with this, we also saw a pullback in digital assets after the recent upward trend, in line with the nature of the market. We maintain the view we mentioned in our morning analysis and think that we may spend the weekend (and perhaps the first days of the week) with a similar texture, unless a new dynamic emerges to dominate the markets before the new week begins.
TECHNICAL ANALYSIS
BTC/USDT
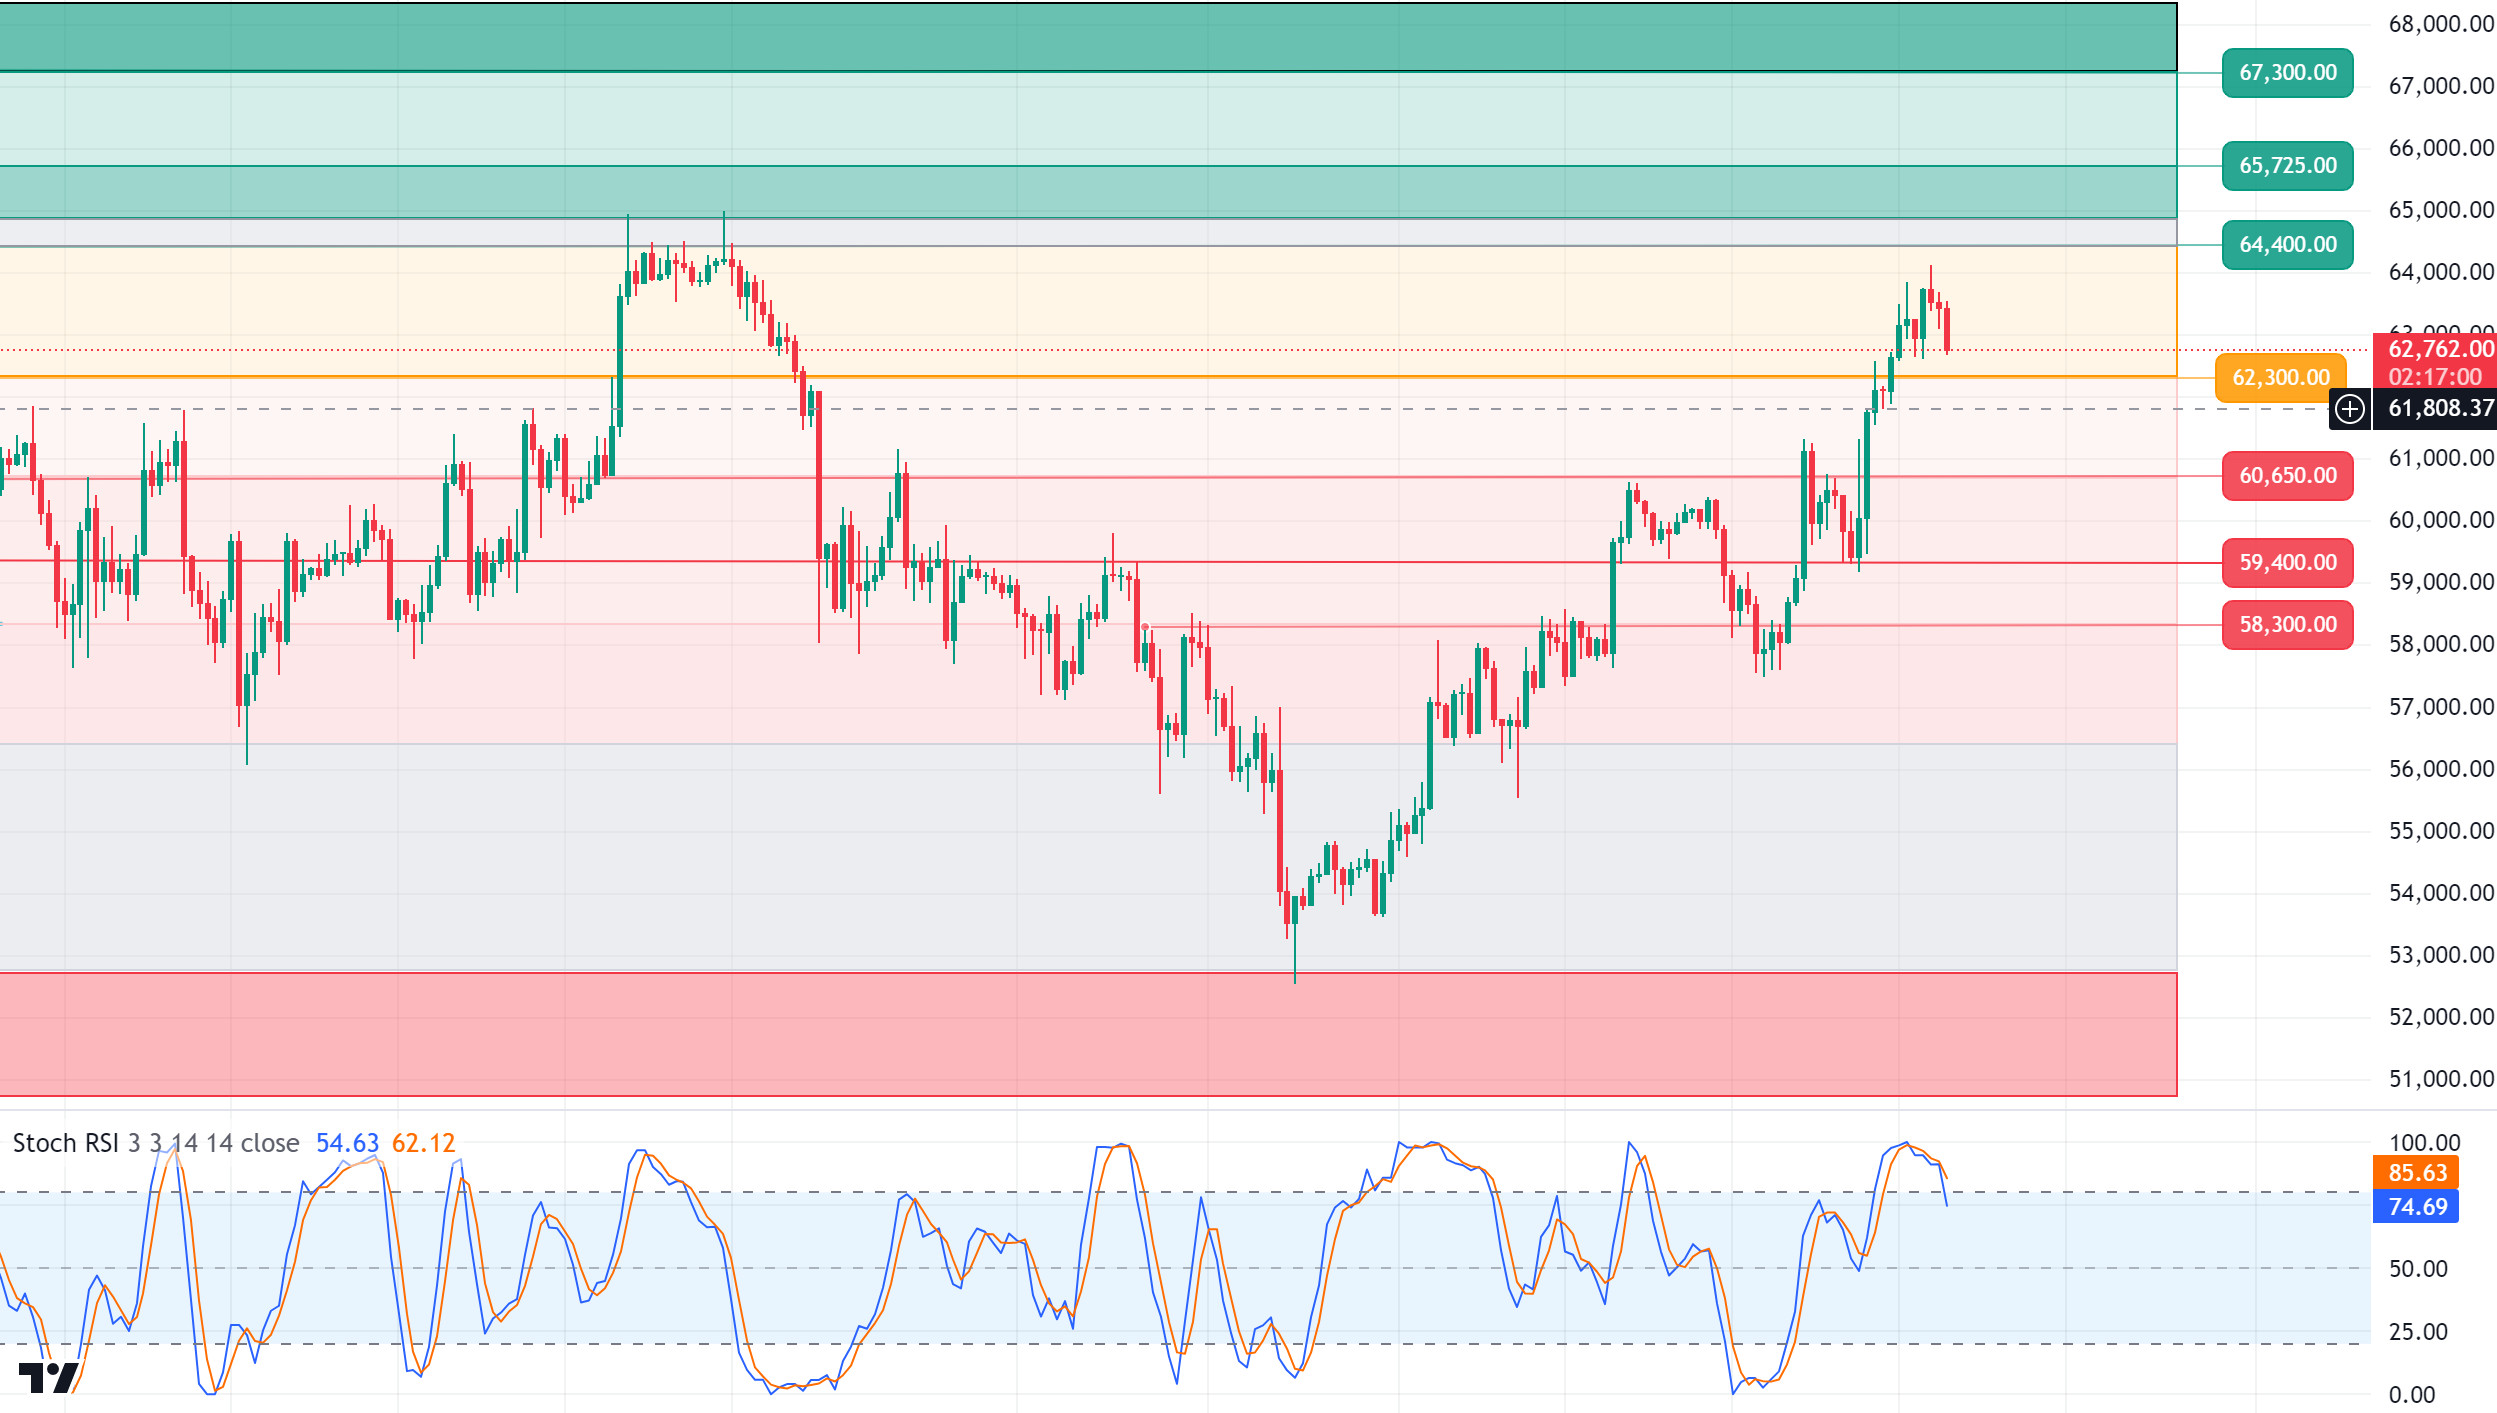
Bitcoin correction! The impact of the FED’s surprise interest rate cut continues to have an impact on the Bitcoin price. Momentum may be necessary to initiate a new upward movement in Bitcoin, which has maintained a strong stance near the 64,000 level for a long time. One of the events affecting the strong stance came from MicroStrategy during the day. The company, which completed the sale of bonds and said it would buy Bitcoin from the sales, continues to increase its interest in Bitcoin. On the BTC 4-hour chart, technical indicators point to a correction during the day, while at the time of writing the technical analysis, we see that the price has reached the 62,700 level and the expected retracement has begun. With the optimistic mood, it can be expected that the declines will remain limited, and the cumulative bullish movement will continue, and it should be noted that volatility has increased considerably in pre-bull periods. In case the decline deepens, the support level we will encounter is 62,300 points. Unless a trend-changing event occurs, we can expect the positive mood in the crypto market to continue.
Supports 62,300 – 60,650 – 59,400
Resistances 64,450 – 65,725 – 67,300
ETH/USDT
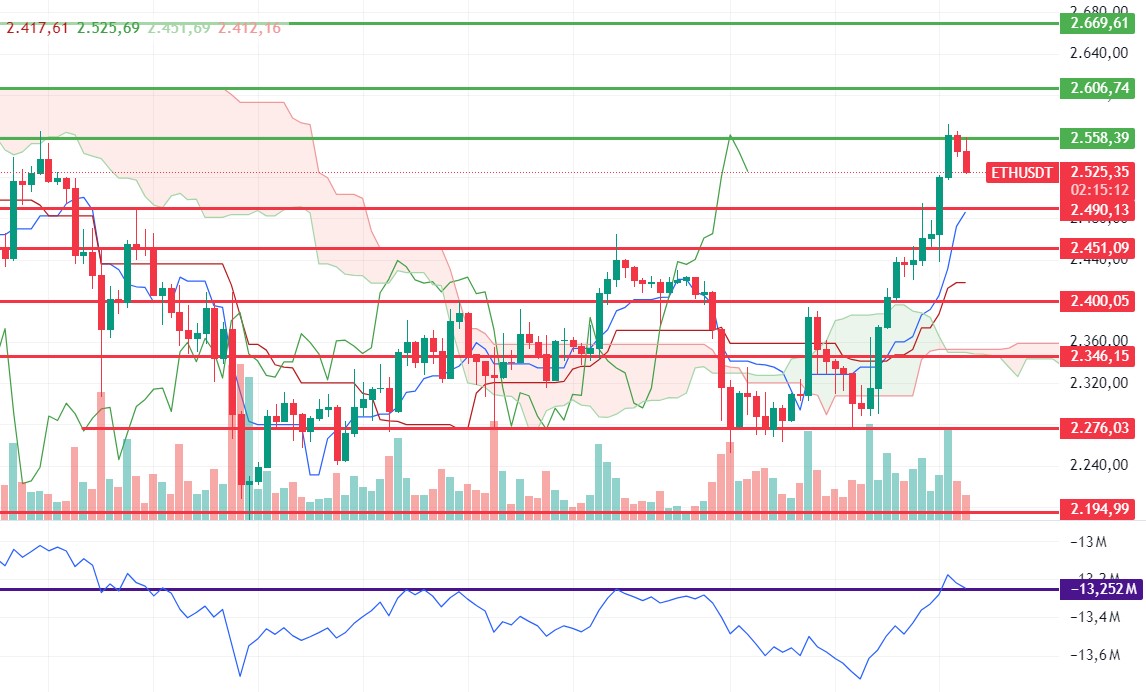
Ethereum, which could not exceed the 2,558 level, experienced some retracement. The positive structure in OBV seems to have strengthened again. However, with the failure to break the 2,558 level with volume, a bowl handle formation structure may form and retreats to 2,490 levels may occur. The most important support level to be considered is 2,490. Closures below this level may bring some further correction.
Supports 2,490 – 2,451 – 2,400
Resistances 2,558 – 2,606 – 2,669
LINK/USDT
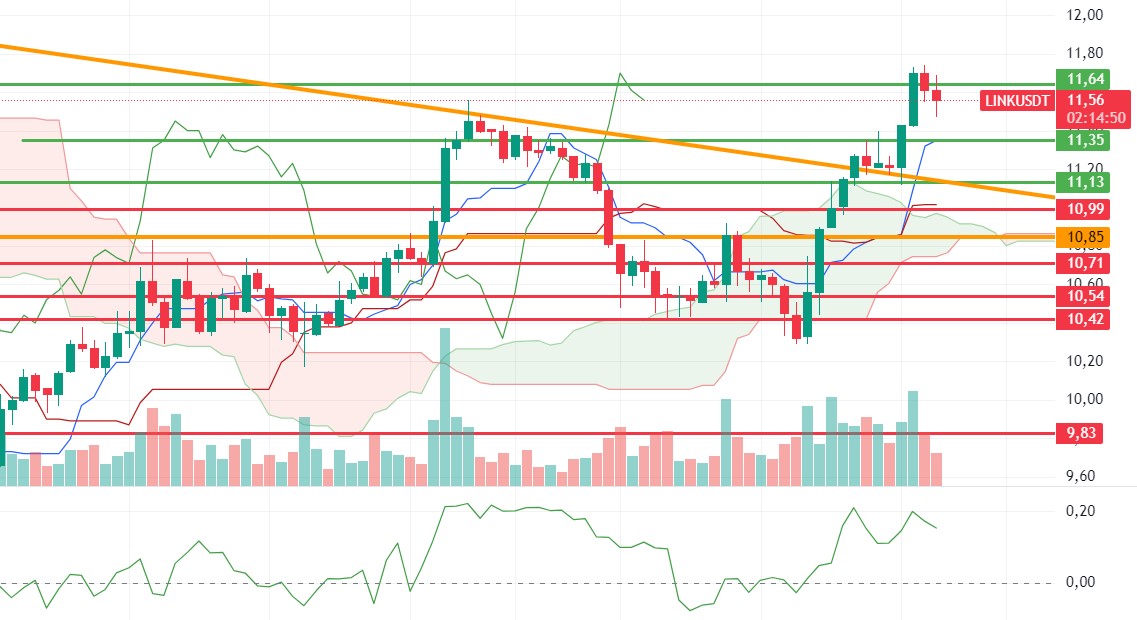
LINK continues to push the daily kumo resistance 11.64 level. LINK, which looks strong on the on-chain side, maintains its positive structure on the technical side. With 11.35 support maintained, upward pricing may continue. If the 11.35 level is broken, a correction to 10.85 levels may come.
Supports 11.35 – 10.85 – 10.54
Resistances 11.64 – 12.19 – 12.42
SOL/USDT
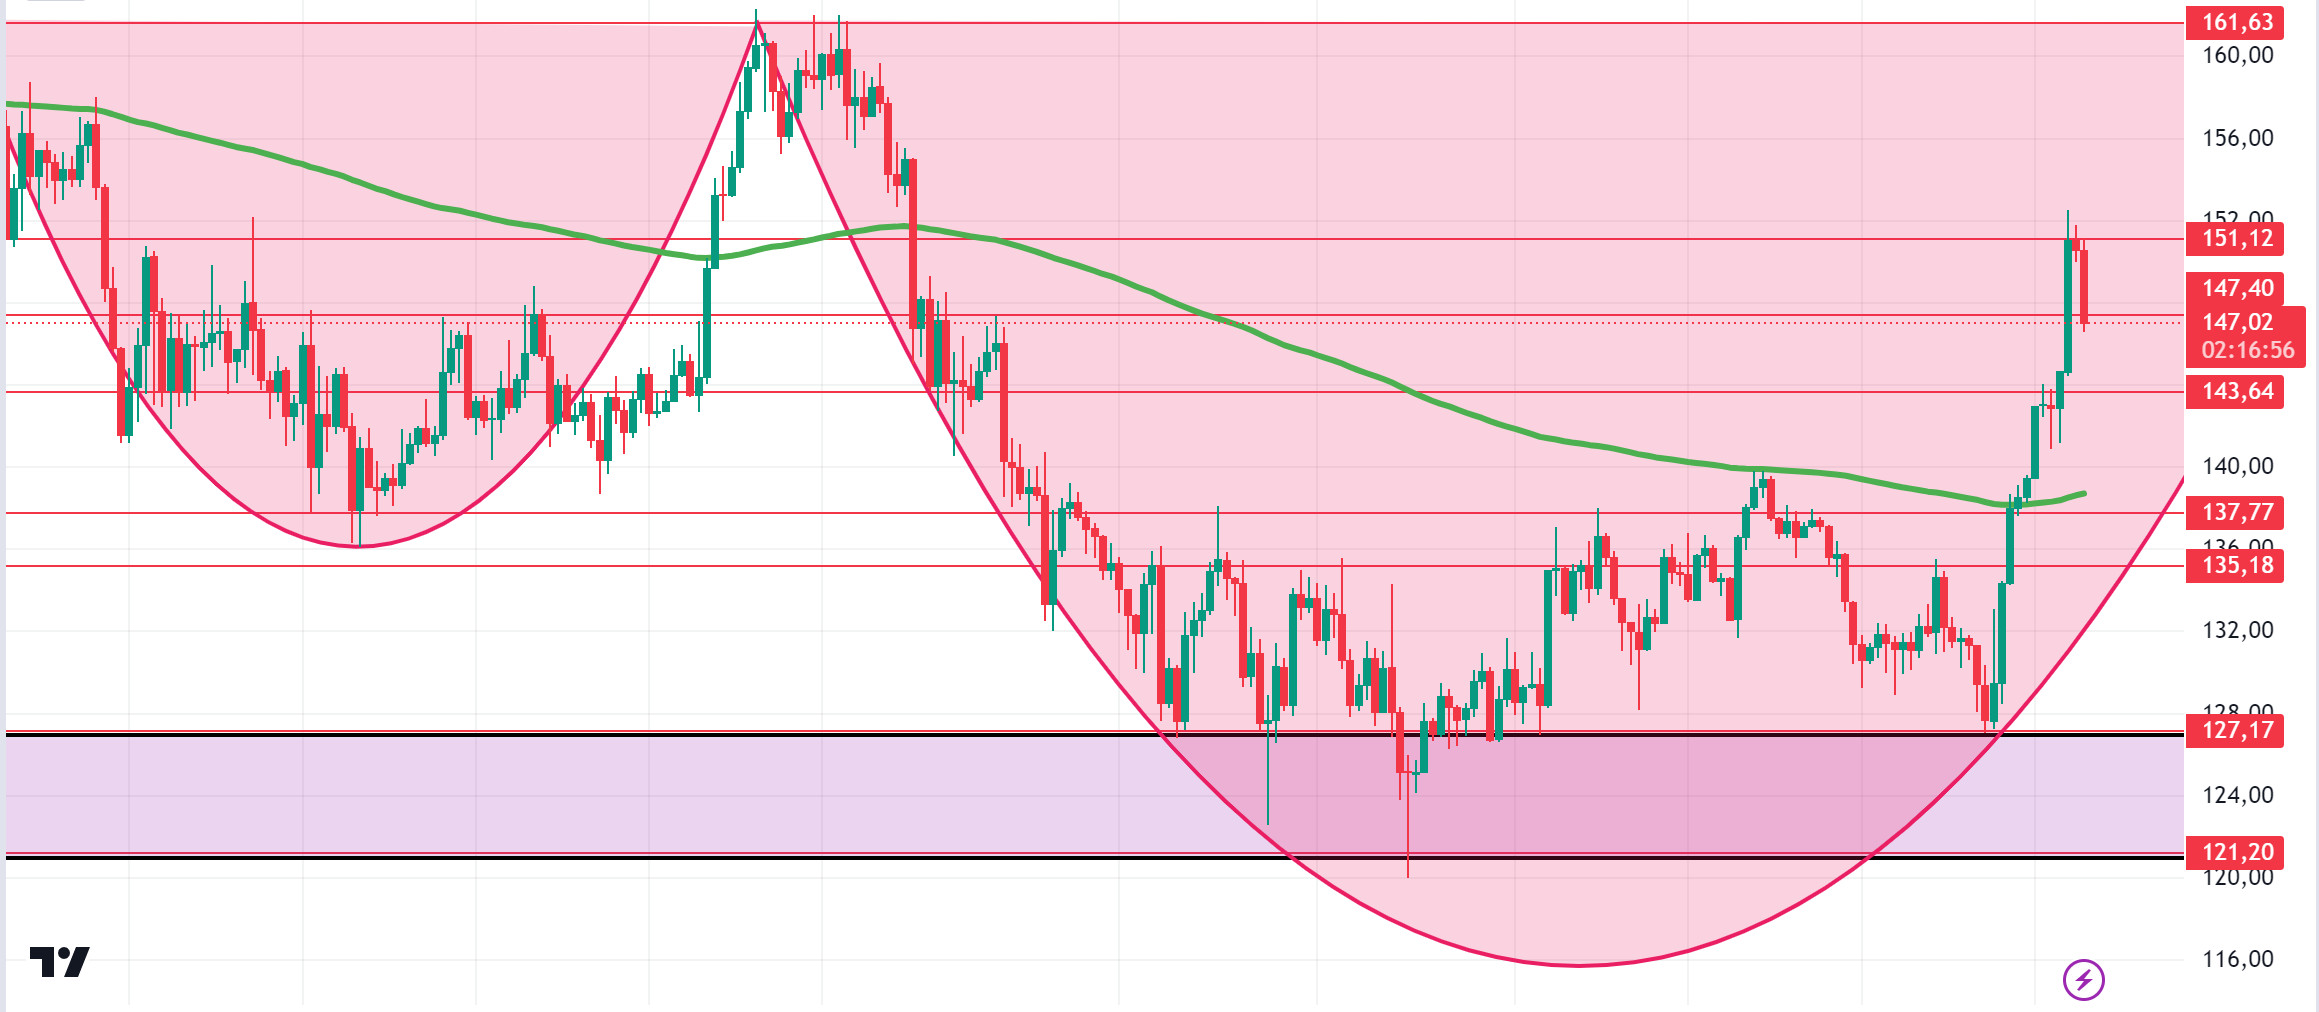
With the crypto market surpassing a market capitalization of $2.20 trillion and the start of the Breakpoint event, the Solana token is on the rise. In the Solana ecosystem, Franklin Templeton will launch an on-chain investment fund on Solana. The asset manager suggested that Solana’s cost-effectiveness led to this decision. Citibank is also considering using Solana to facilitate payment transfers. Technically, it successfully broke the $150 level with a trading volume of $3.283 billion, rising over 7.08% in the last 24 hours. Also, Fed rate cuts are likely to help the token break the consolidation it has been sustaining since around April. However, the upcoming profit sales may prevent it from breaking the consolidation zone yet. On the other hand, a cup-and-handle pattern seems likely. In the rises driven by both macroeconomic conditions and innovations in the Solana ecosystem, 151.12 – 161.63 levels appear as resistance. If it rises above these levels, the rise may continue. It can support the 200 EMA average in the pullbacks that will occur if investors make profit sales. 147.40 – 143.64 levels can be followed as support. If it comes to these support levels, a potential rise should be followed.
Supports 147.40 – 143.64 – 137.77
Resistances 151.12 – 161.63 – 167.96
ADA/USDT
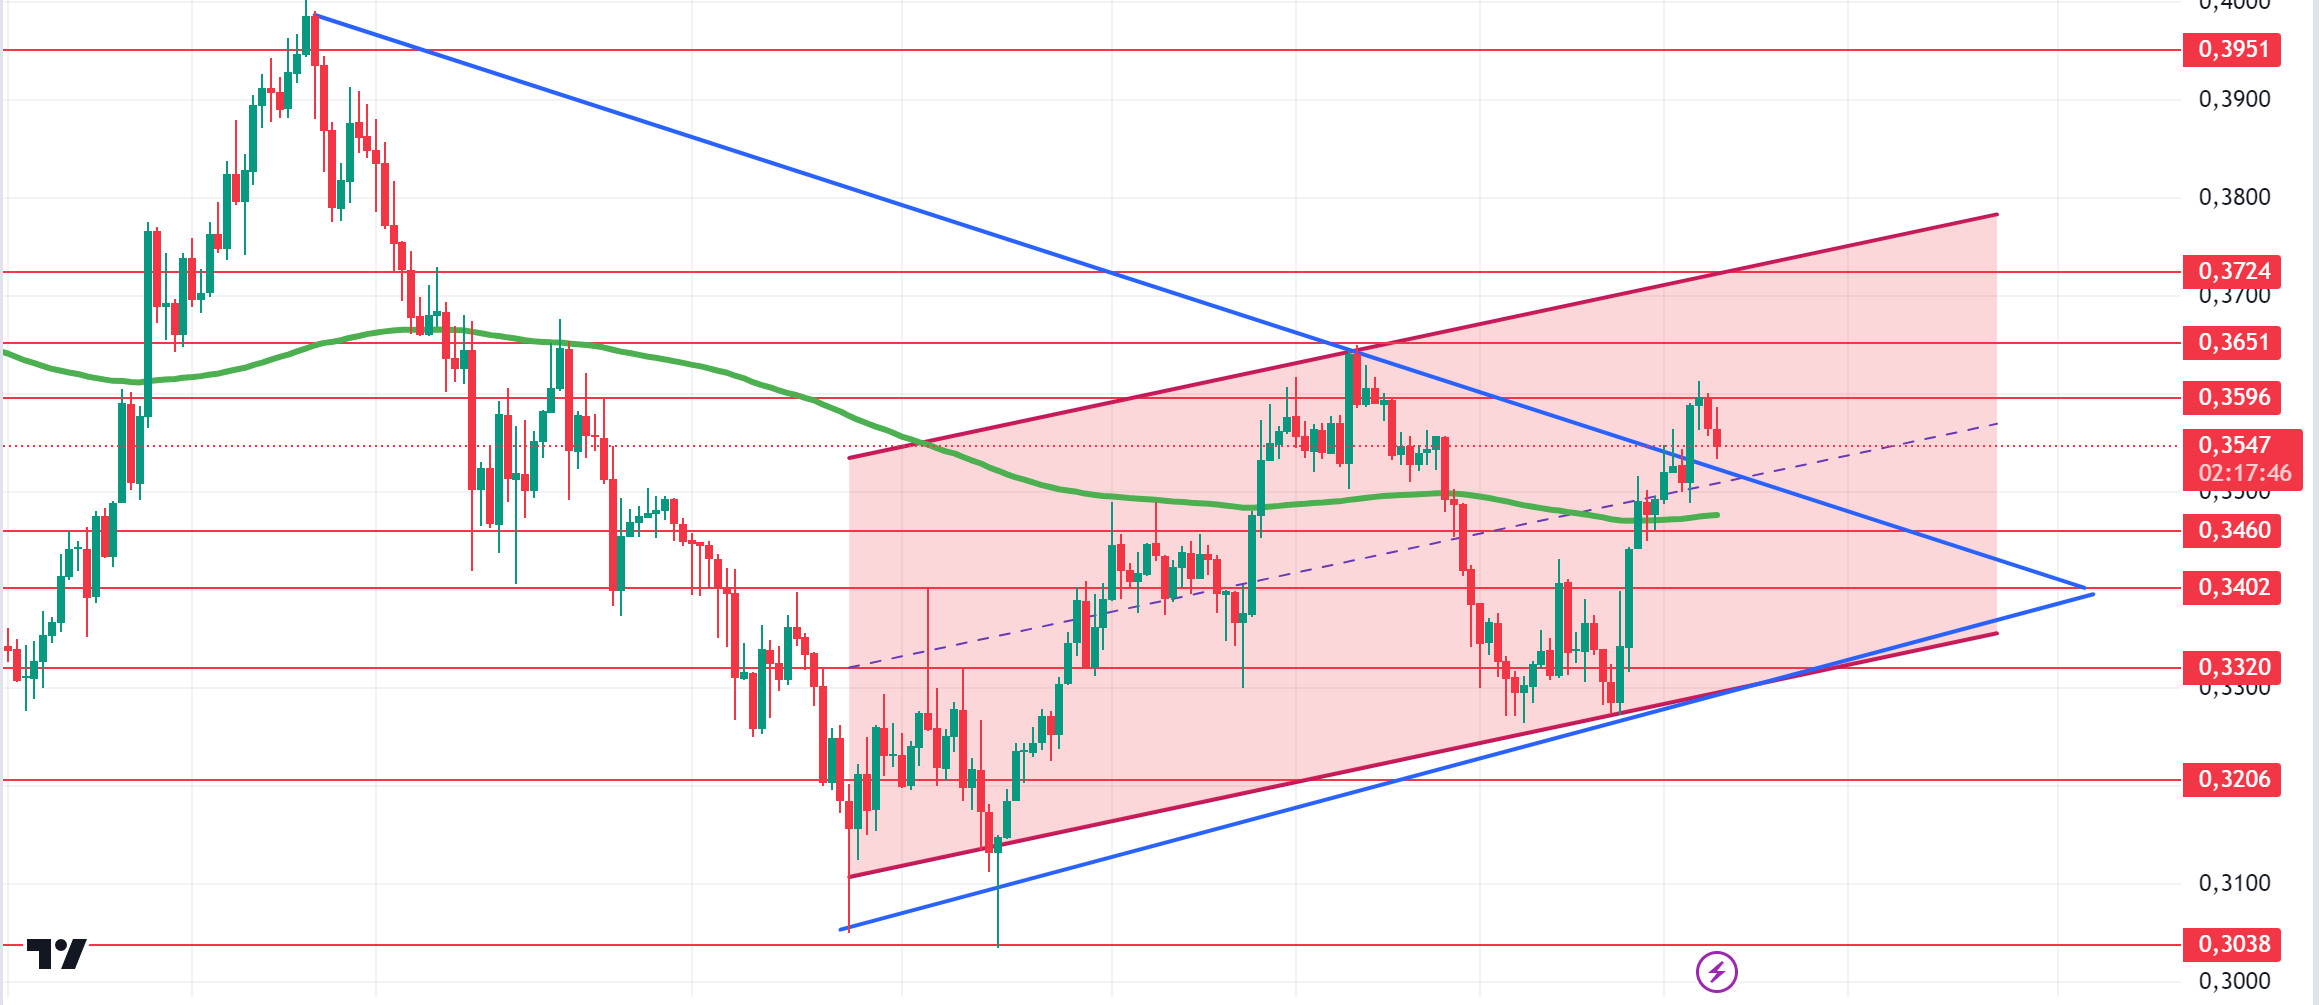
ADA, which has experienced a slight pullback since our analysis in the morning, fell by 1%. In the last 24 hours, it continued to rise and broke the resistance of the symmetrical triangle pattern. At the same time, this rise is priced from the upper zone of the rising channel formed since September 4. In retracements due to possible profit sales, it may gain momentum from the 200 EMA average. In this scenario, 0.3460 – 0.3402 levels appear as support. As the interest rate cut continues to be priced in, 0.3596 – 0.3651 levels can be followed as resistance levels in the rises that will take place with the continuation of the positive mood.
Supports 0.3460 – 0.3320 – 0.3288
Resistances 0.3596 – 0.3651 – 0.3724
AVAX/USDT
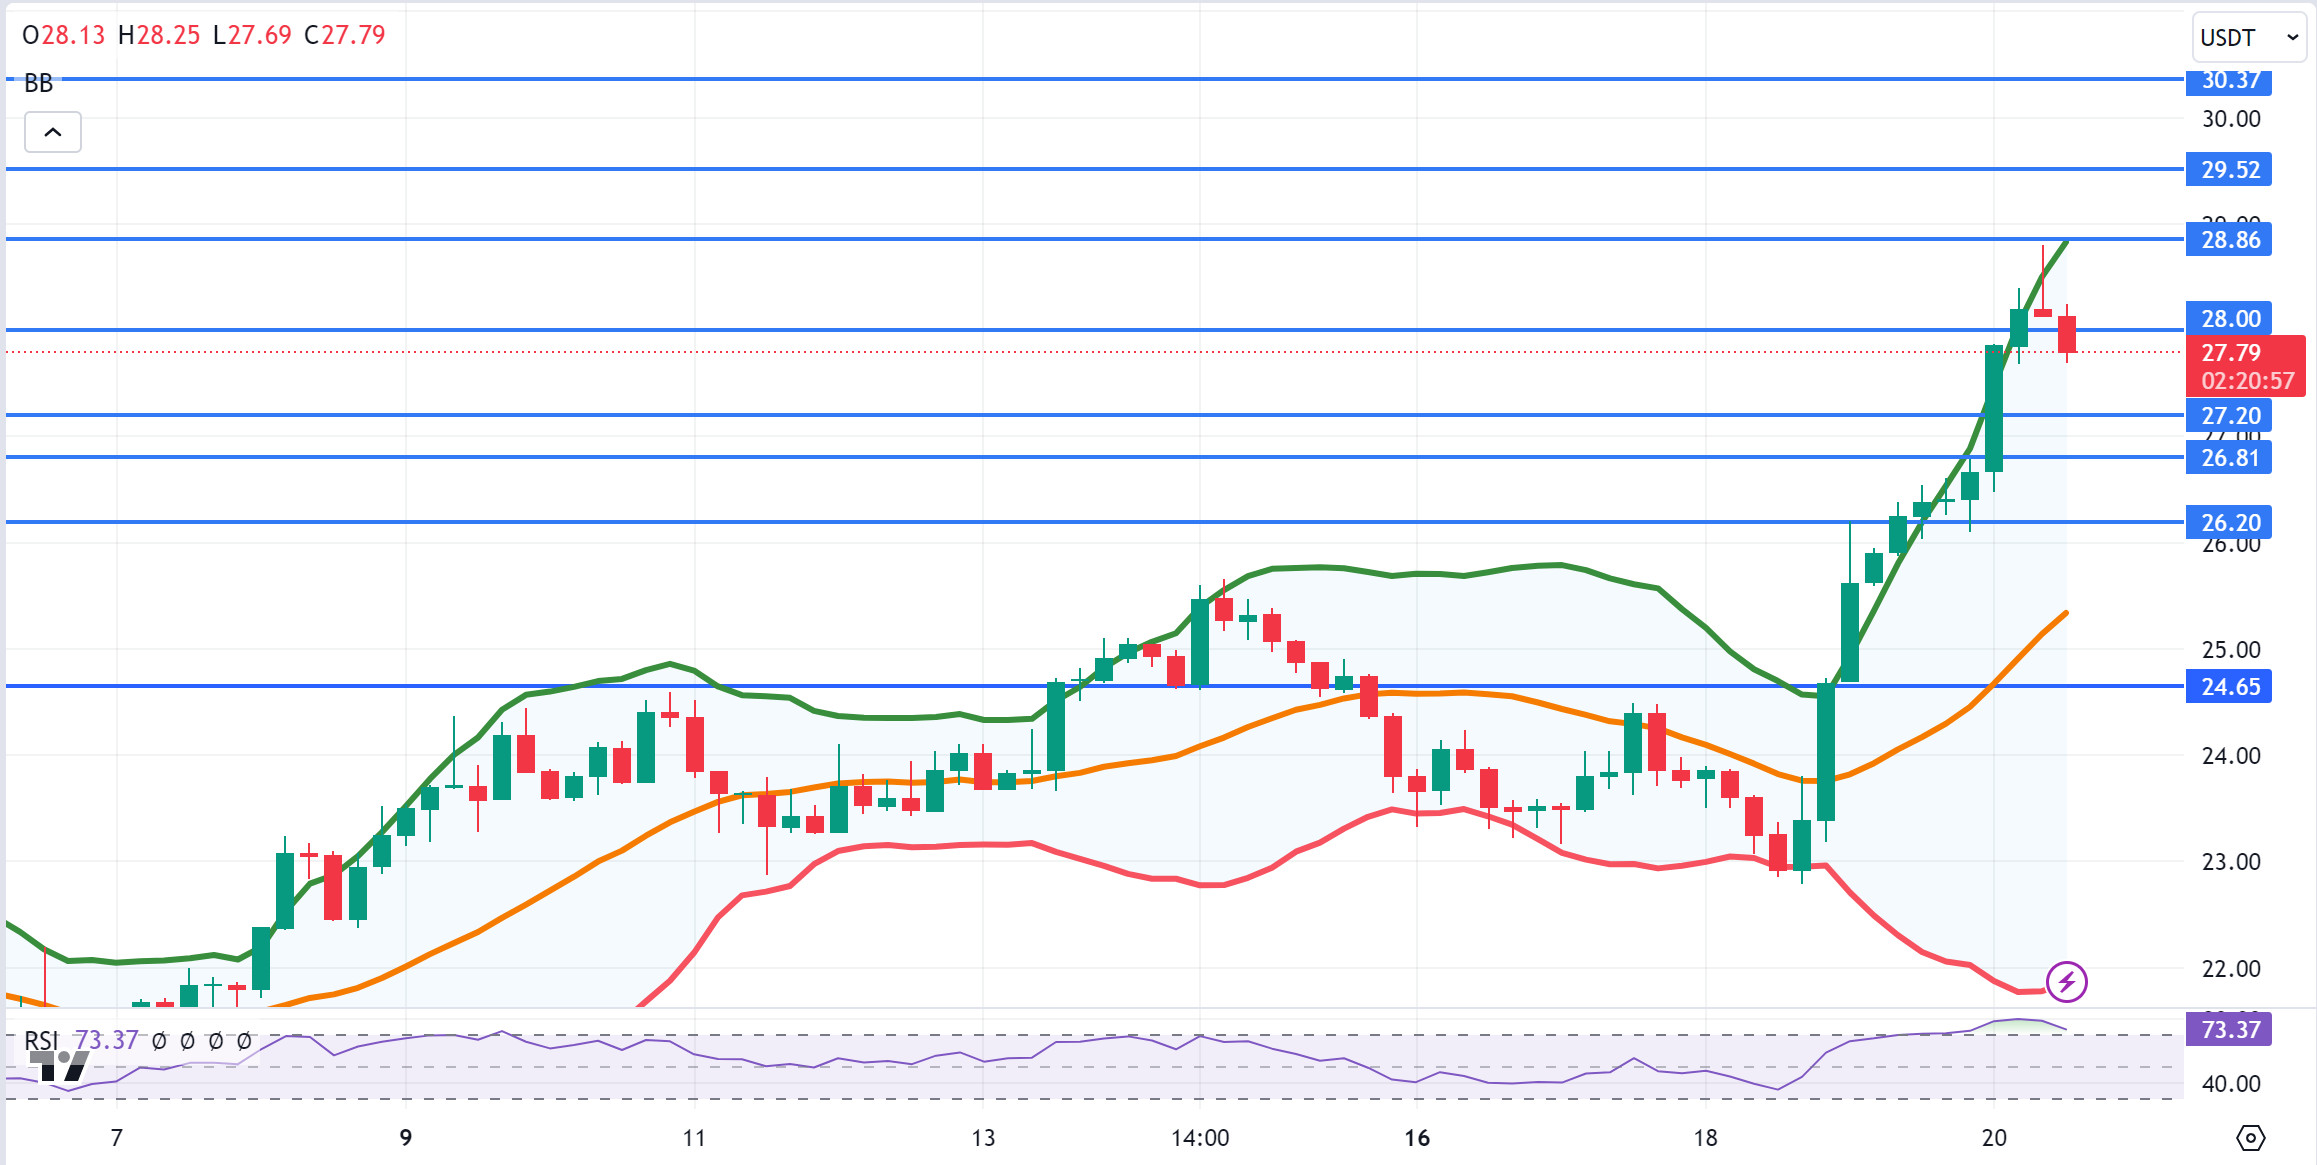
AVAX, which opened today at 26.67, is trading at 27.79, up about 4% during the day.
It is currently at the Bollinger upper band on the 4-hour chart. AVAX, which is in the overbought zone with RSI 73, may receive a sales reaction from these levels. It is currently trying to break the 28.00 support. If it fails to close the candle below this support, it may test 27.20 and 26.81 supports. With the candle closure above 28.00 support, it may want to test the 28.86 resistance by making some more upside. As long as it stays above 24.65 support during the day, the desire to rise may continue. With the break of 24.65 support, selling pressure may increase.
Supports 28.00 – 27.20 – 26.81
Resistances 28.86 – 29.52 – 30.37
TRX/USDT
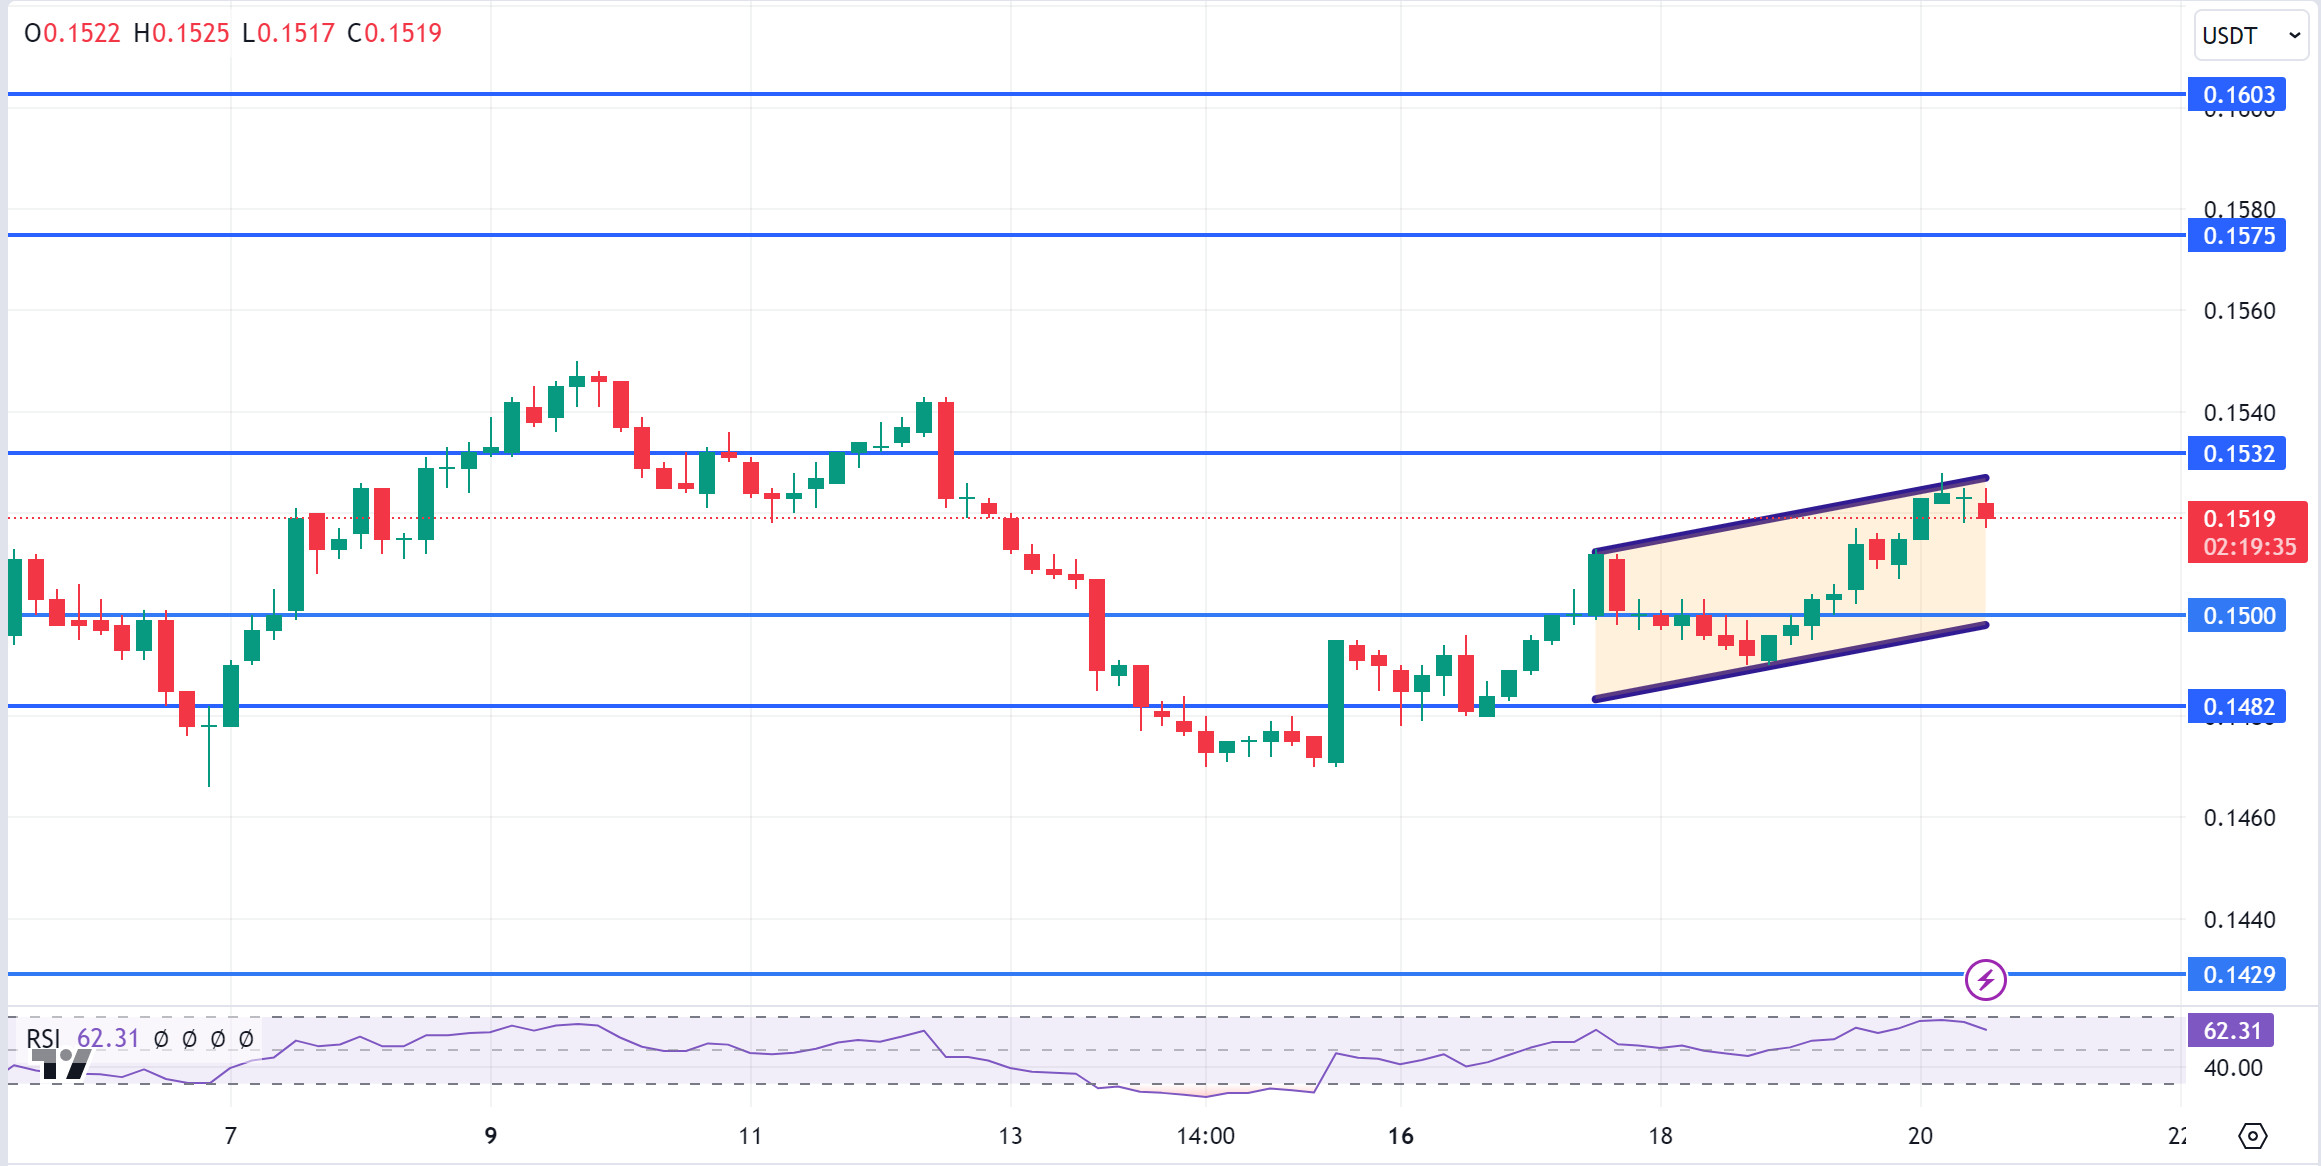
TRX, which started today at 0.1515, rose slightly during the day and is trading at 0.1519. It is currently moving within the ascending channel on the 4-hour chart. It is in the upper band of the rising channel and a sales reaction can be expected from here. In such a case, it may move to the lower band of the channel and test the support of 0.1500. If it breaks the channel upwards with volume purchases from the upper band of the channel, it may want to test the 0.1575 resistance by passing the 0.1532 resistance. TRX may continue to be bullish as long as it stays above 0.1482 support. If this support breaks down, sales can be expected to increase.
Supports 0.1500 – 0.1482 – 0.1429
Resistances 0.1532 – 0.1575 – 0.1603
XRP/USDT
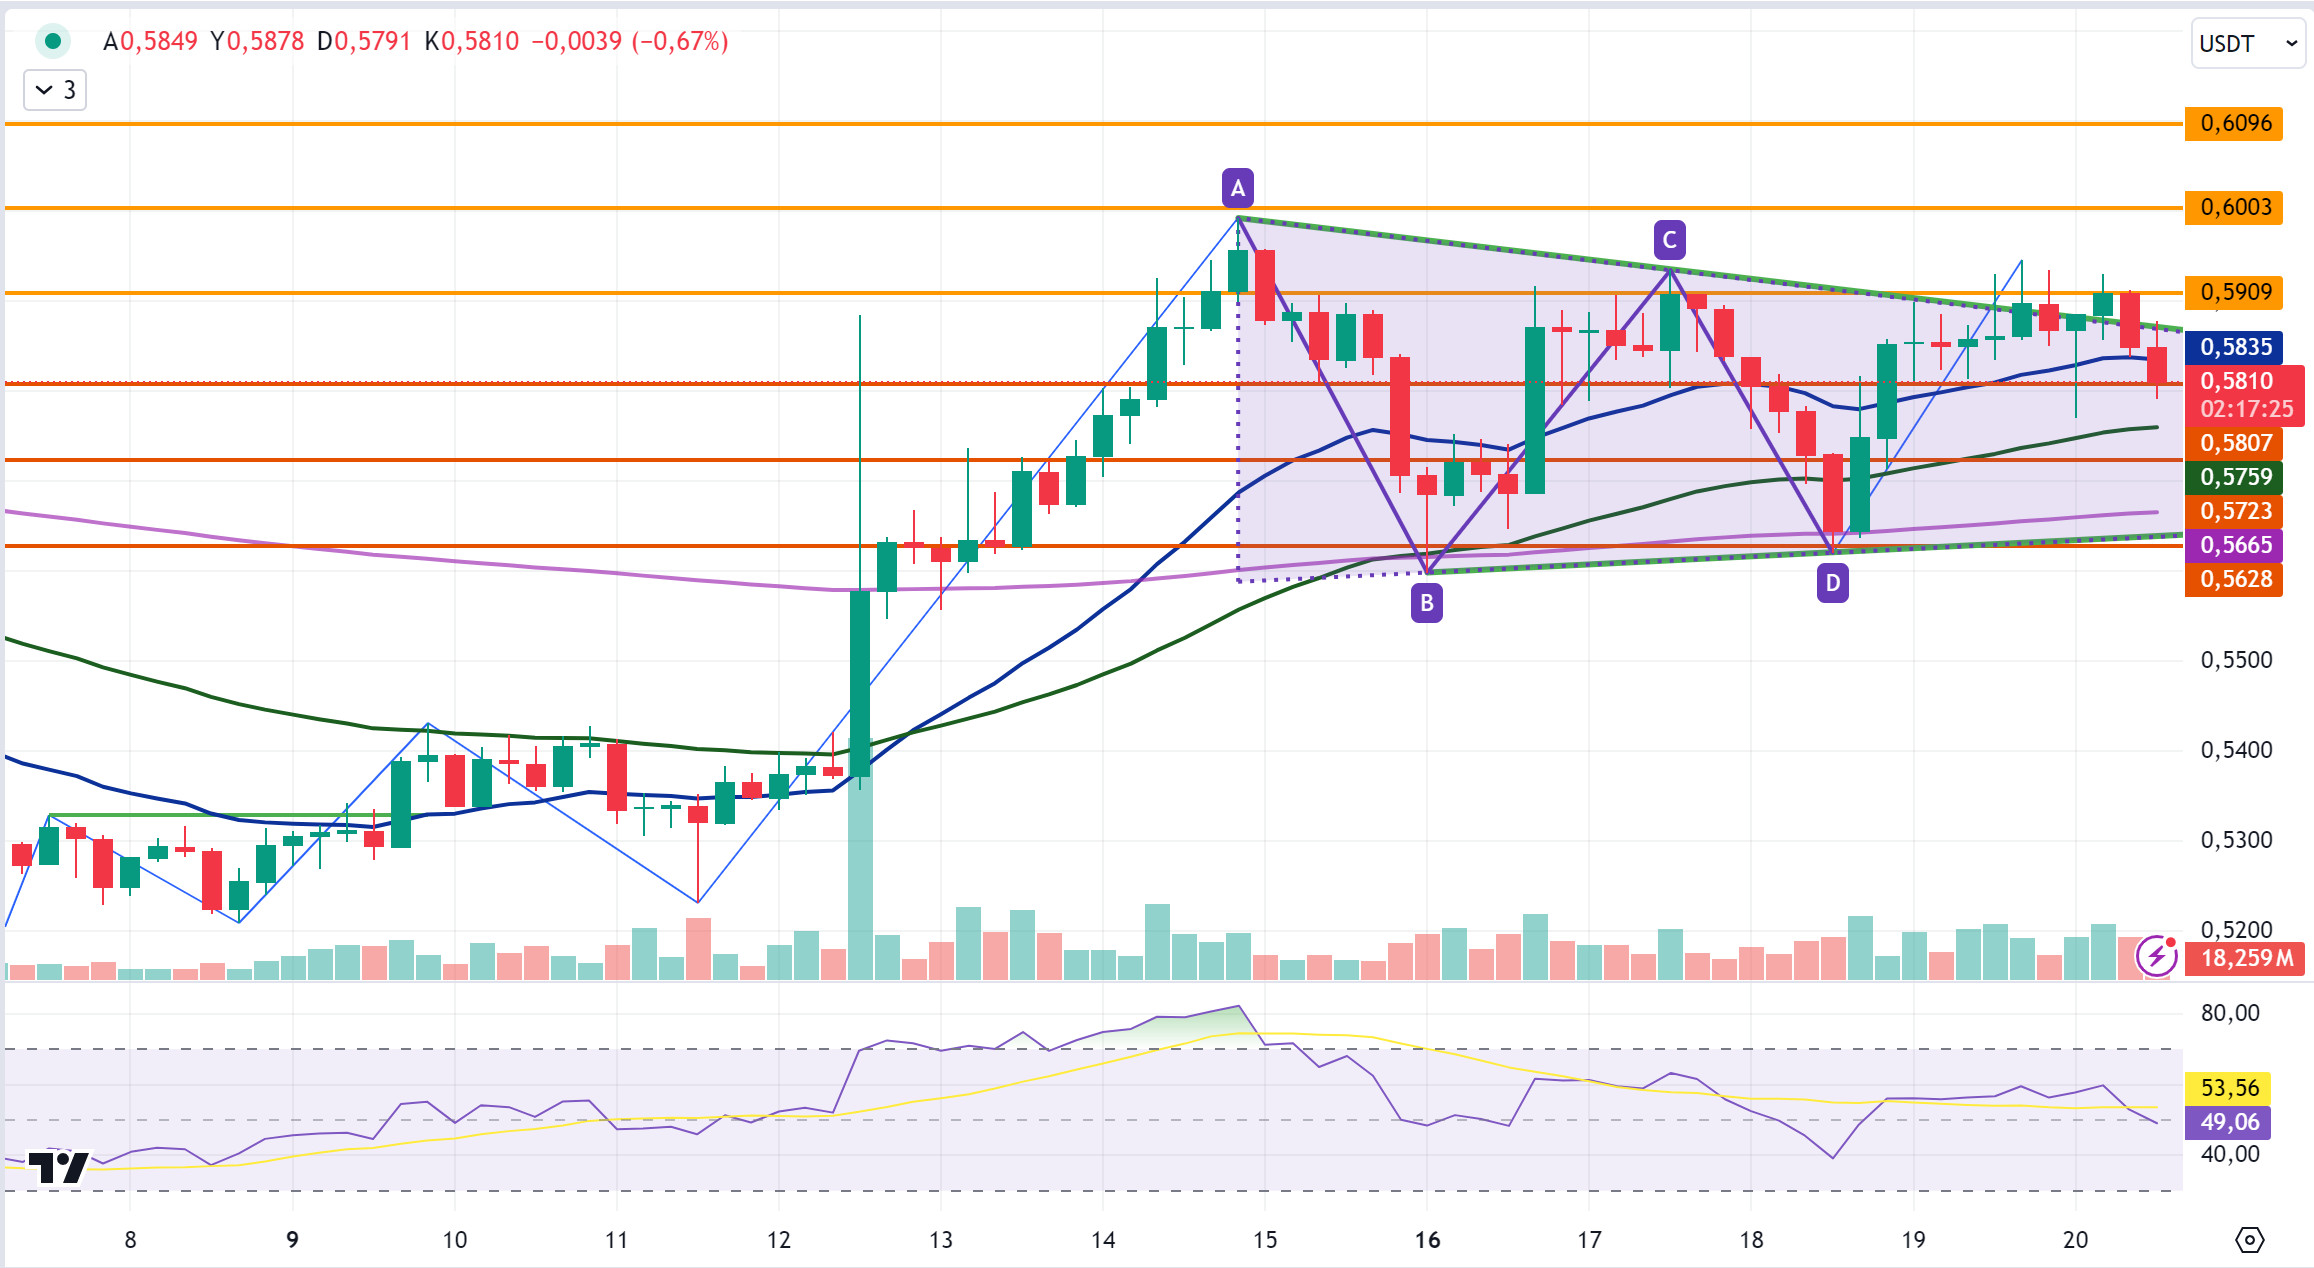
XRP is currently trading at 0.5810, down about 1% today. In the 4-hour analysis, XRP fell today, failing to break the 0.5909 resistance level after testing the 0.5909 resistance level multiple times in its rise and fell to 0.58. XRP, which has been trading between the EMA20 and the 0.5807 support level in the last candle, may test the 0.5723-0.5628 support levels in the continuation of the decline if it continues its decline and breaks the 0.5807 support level. If the EMA20 and 0.5807 support level cannot be broken and XRP is bullish, it may test the 0.5909 resistance level and if it breaks it may test the 0.6003-0.6096 resistance levels in the continuation of the rise.
In the continuation of the decline, XRP may rise with the purchases that may come at the EMA50 level and may offer a long trading opportunity. If it breaks the EMA50 level downwards, the decline may deepen and offer a short trading opportunity.
EMA20 (Blue Line) – EMA50 (Green Line) – EMA200 (Purple Line)
Supports 0. 5807 – 0.5 723 – 0.5628
Resistances 0.5909 – 0.6003 – 0.6096
DOGE/USDT
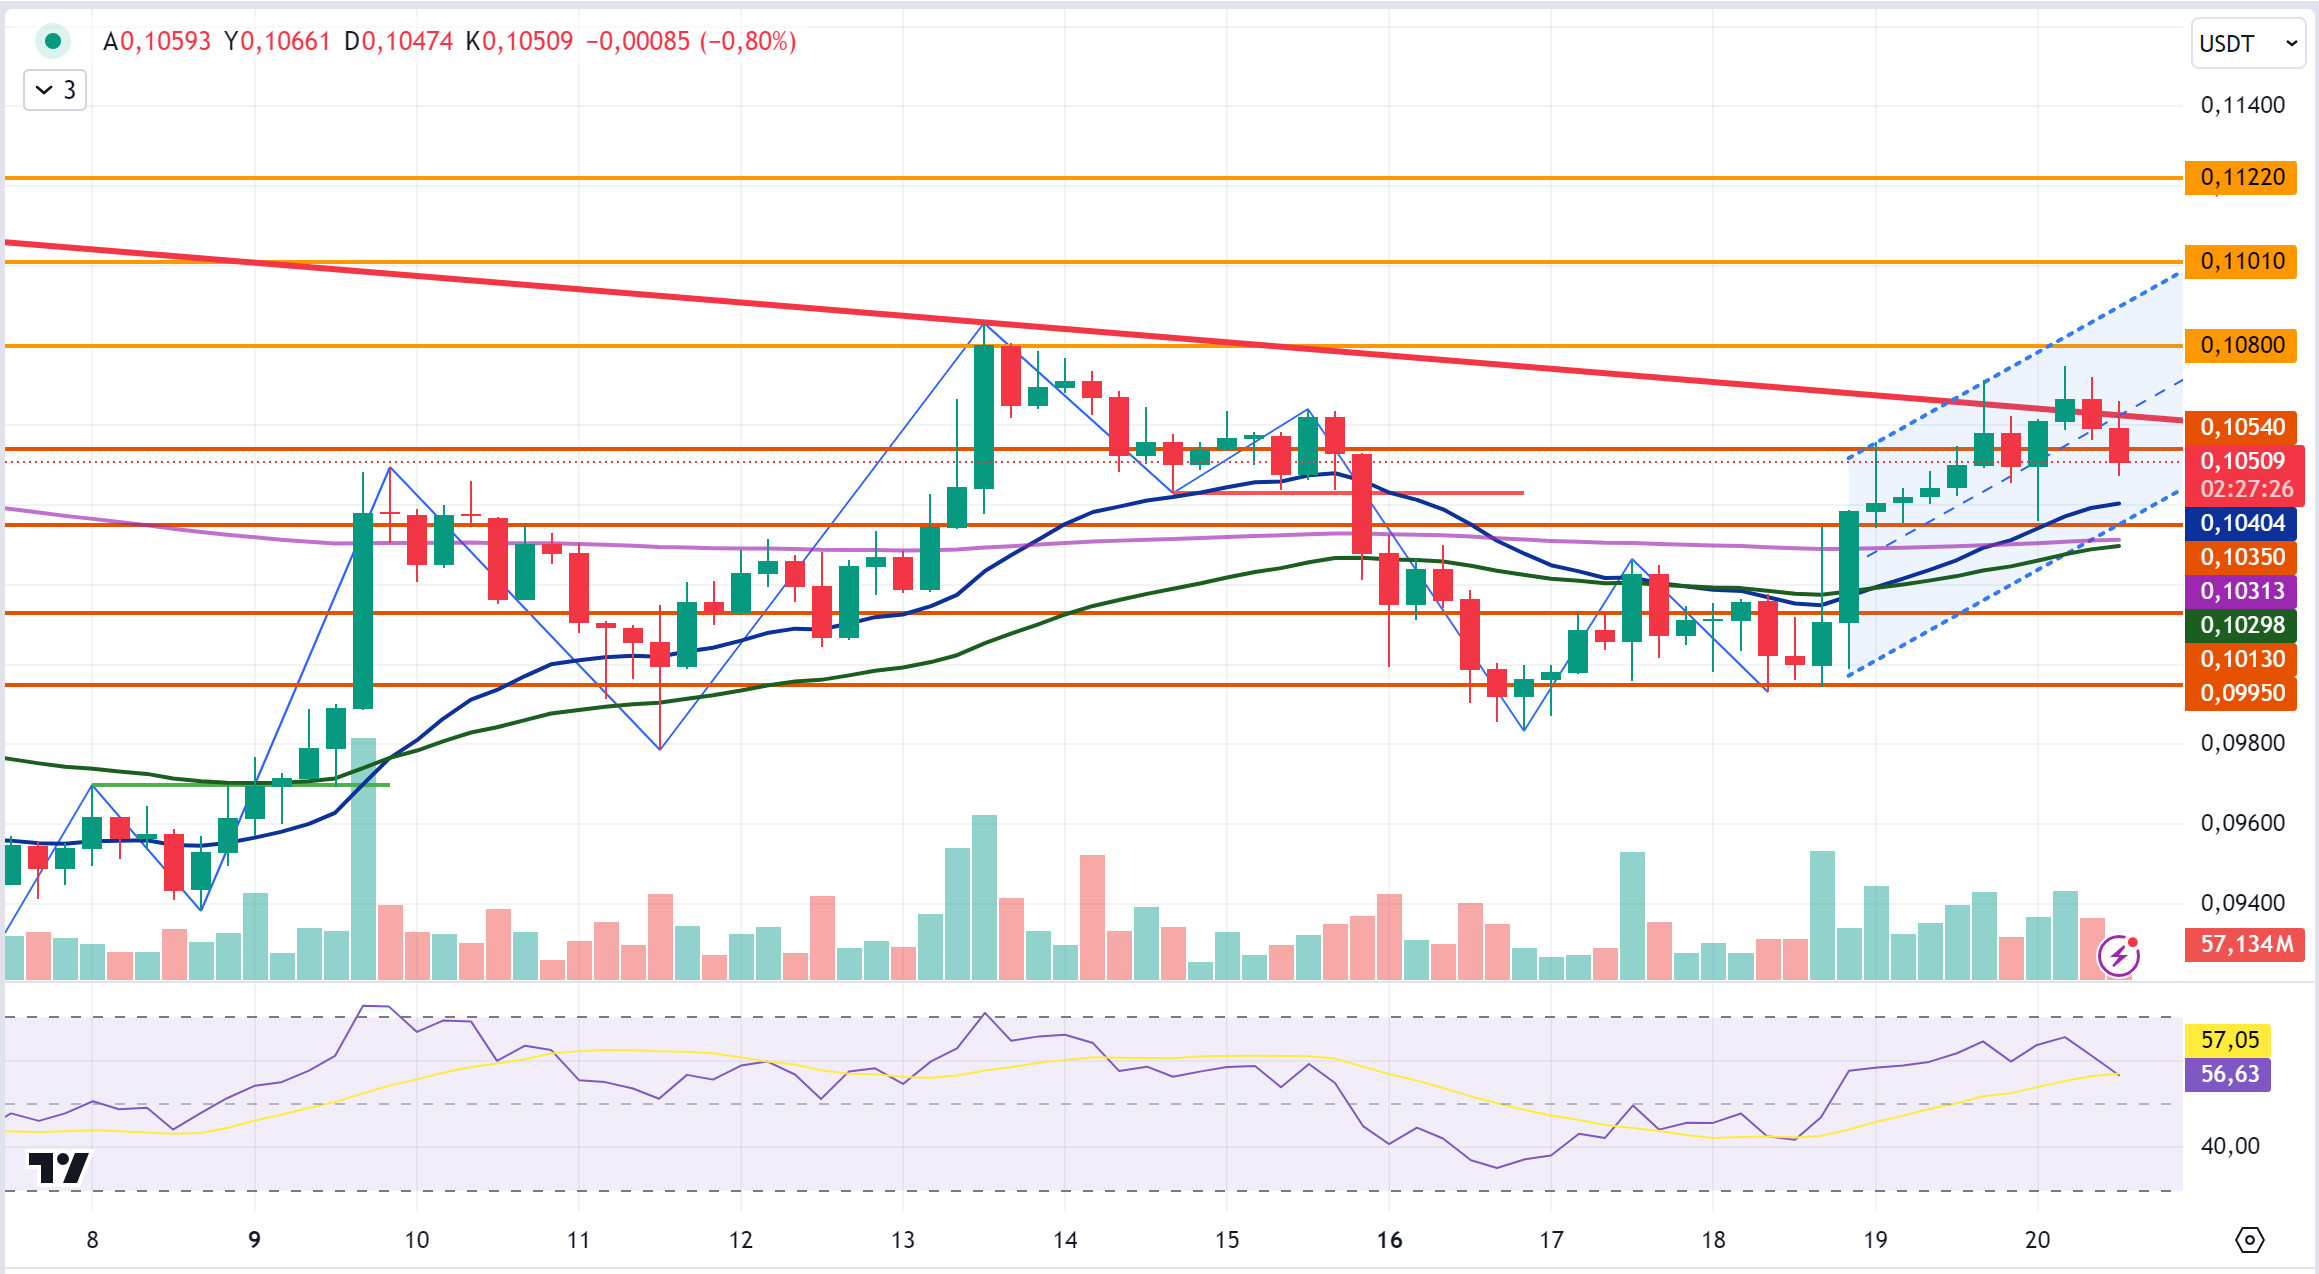
DOGE, which started today at 0.1049, declined with sales after the rise it experienced in the first 2 candles in the 4-hour analysis and is currently trading at 0.1050 in the starting level band of the day. DOGE experienced a decline in its rise within the rising channel, unable to break the downtrend. DOGE, which is trading below the 0.1054 support level in the last candle with its decline, may test the 0.1035-0.1013 support levels if it continues to decline. If the 0.1054 support level cannot be broken with the possible purchases and starts to rise, it may test the resistance levels of 0.1080-0.1109-0.1122.
When DOGE continues to decline, it may rise with the purchases that may come at the EMA20 level and may offer a long trading opportunity. In case of a downward break of the EMA20 level, the decline may deepen and offer a short trading opportunity.
EMA20 (Blue Line) – EMA50 (Green Line) – EMA200 (Purple Line)
Supports 0.1054 – 0.1035 – 0.1013
Resistances 0.1 080 – 0.1109 – 0.1122
DOT/USDT
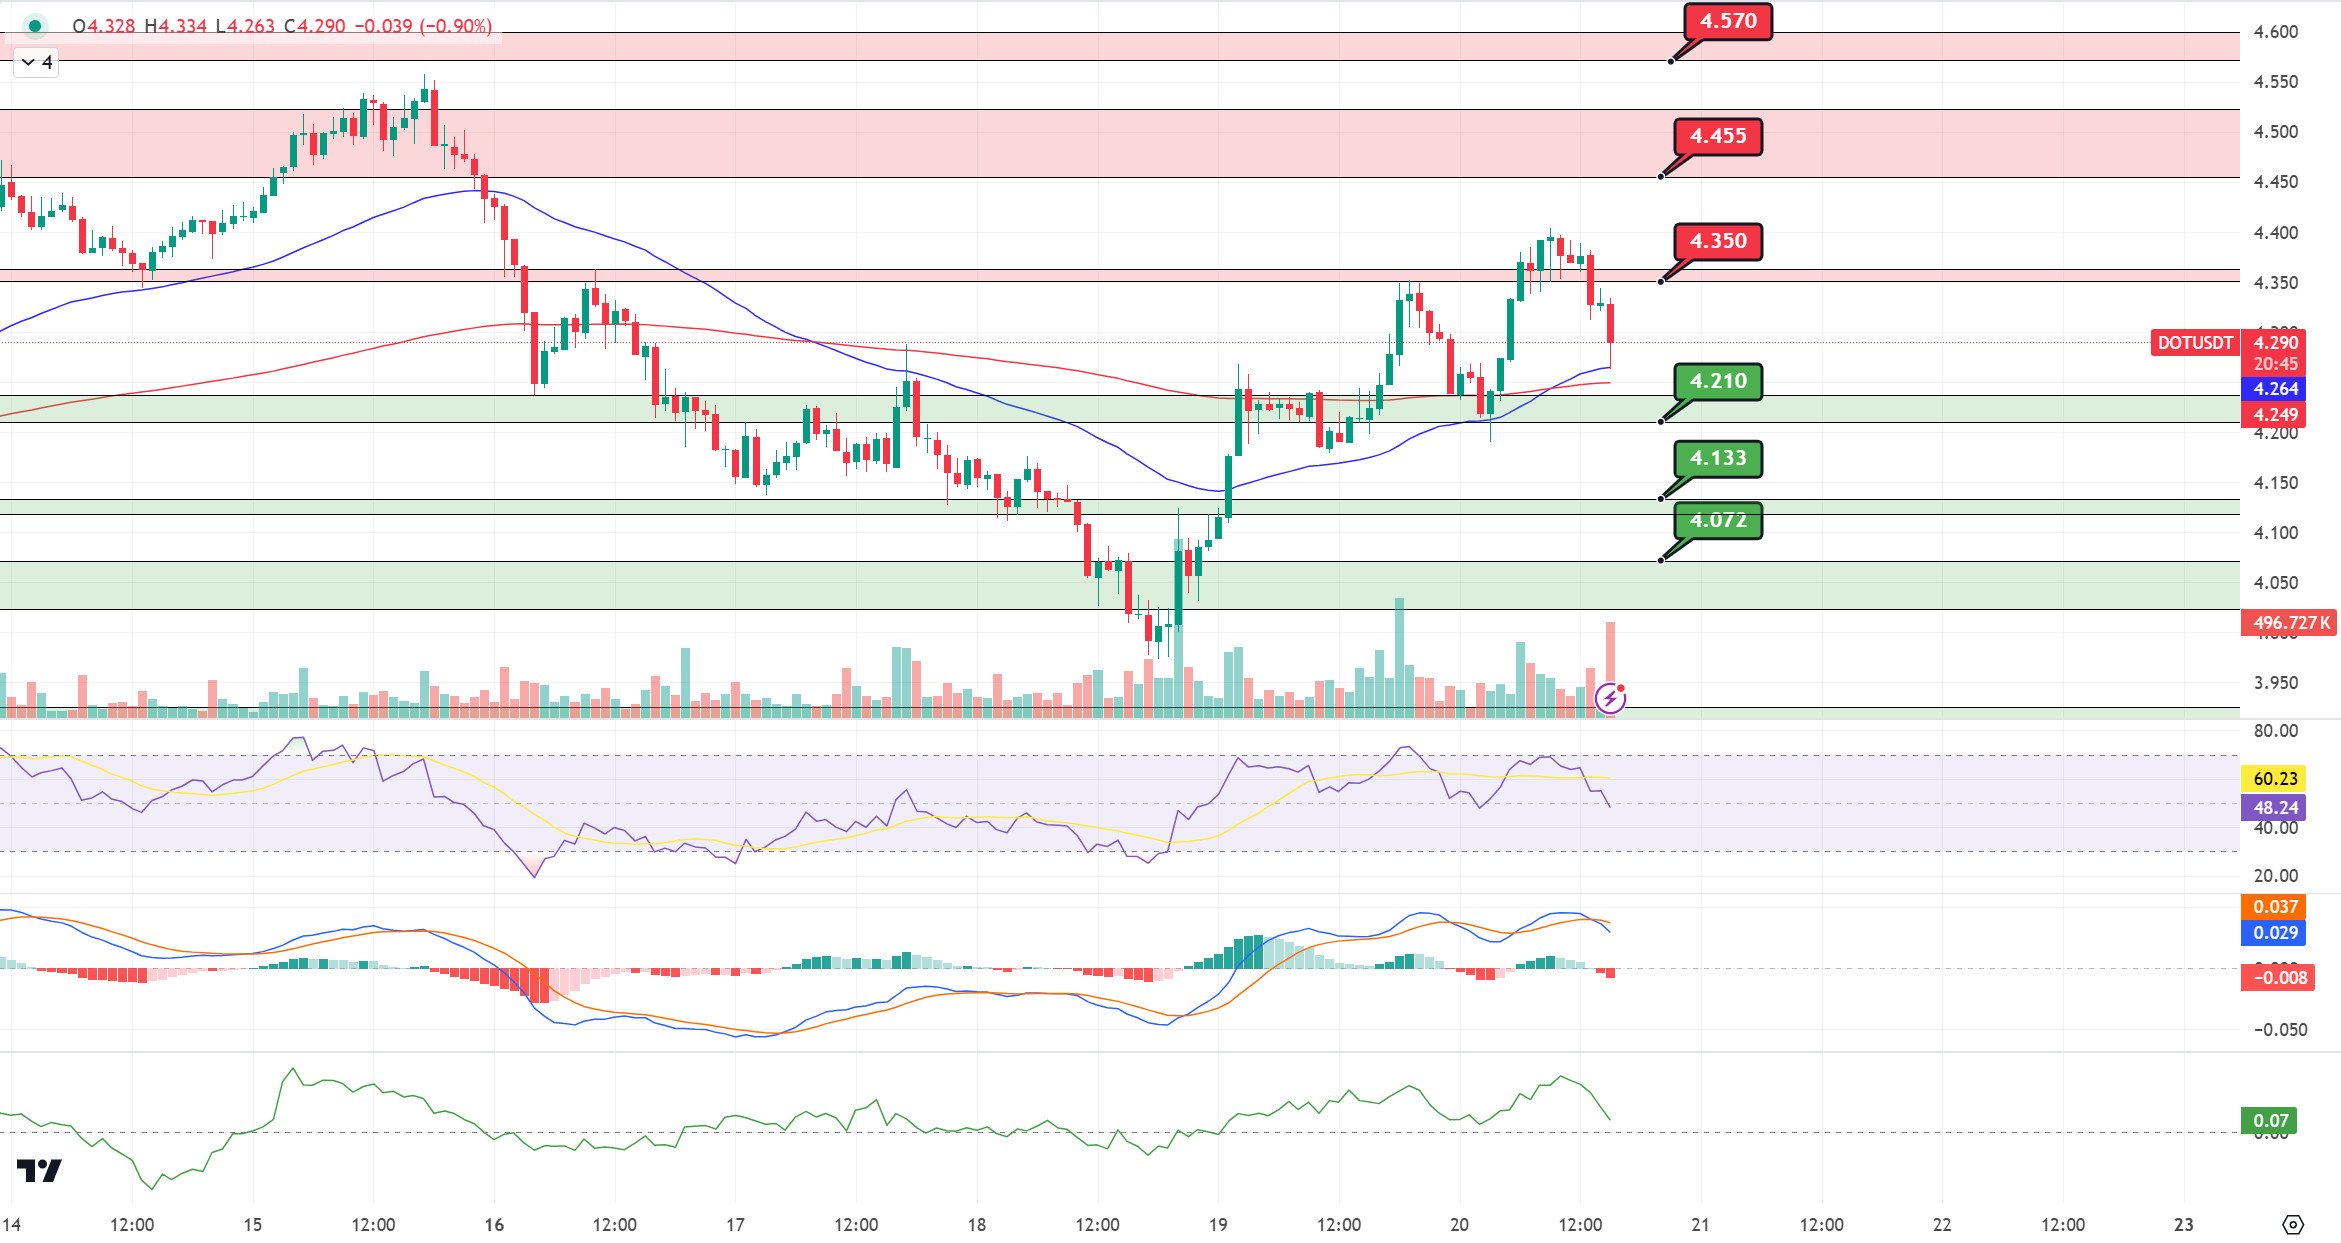
When we examine the Polkadot (DOT) chart, we see that a sharp selling pressure occurred after the negative mismatch between the RSI and the price we mentioned in our previous analysis. If the price, which reacts from the EMA50, fails to persist above the EMA50, the next reaction point may be 4,210 levels. On the other hand, if the price can sustain above the EMA50, the price may want to break the selling pressure at the 4,350 level.
(Blue line: EMA50, Red line: EMA200)
Supports 4,210 – 4,133 – 4,072
Resistances 4.350 – 4.455 – 4.570
SHIB/USDT
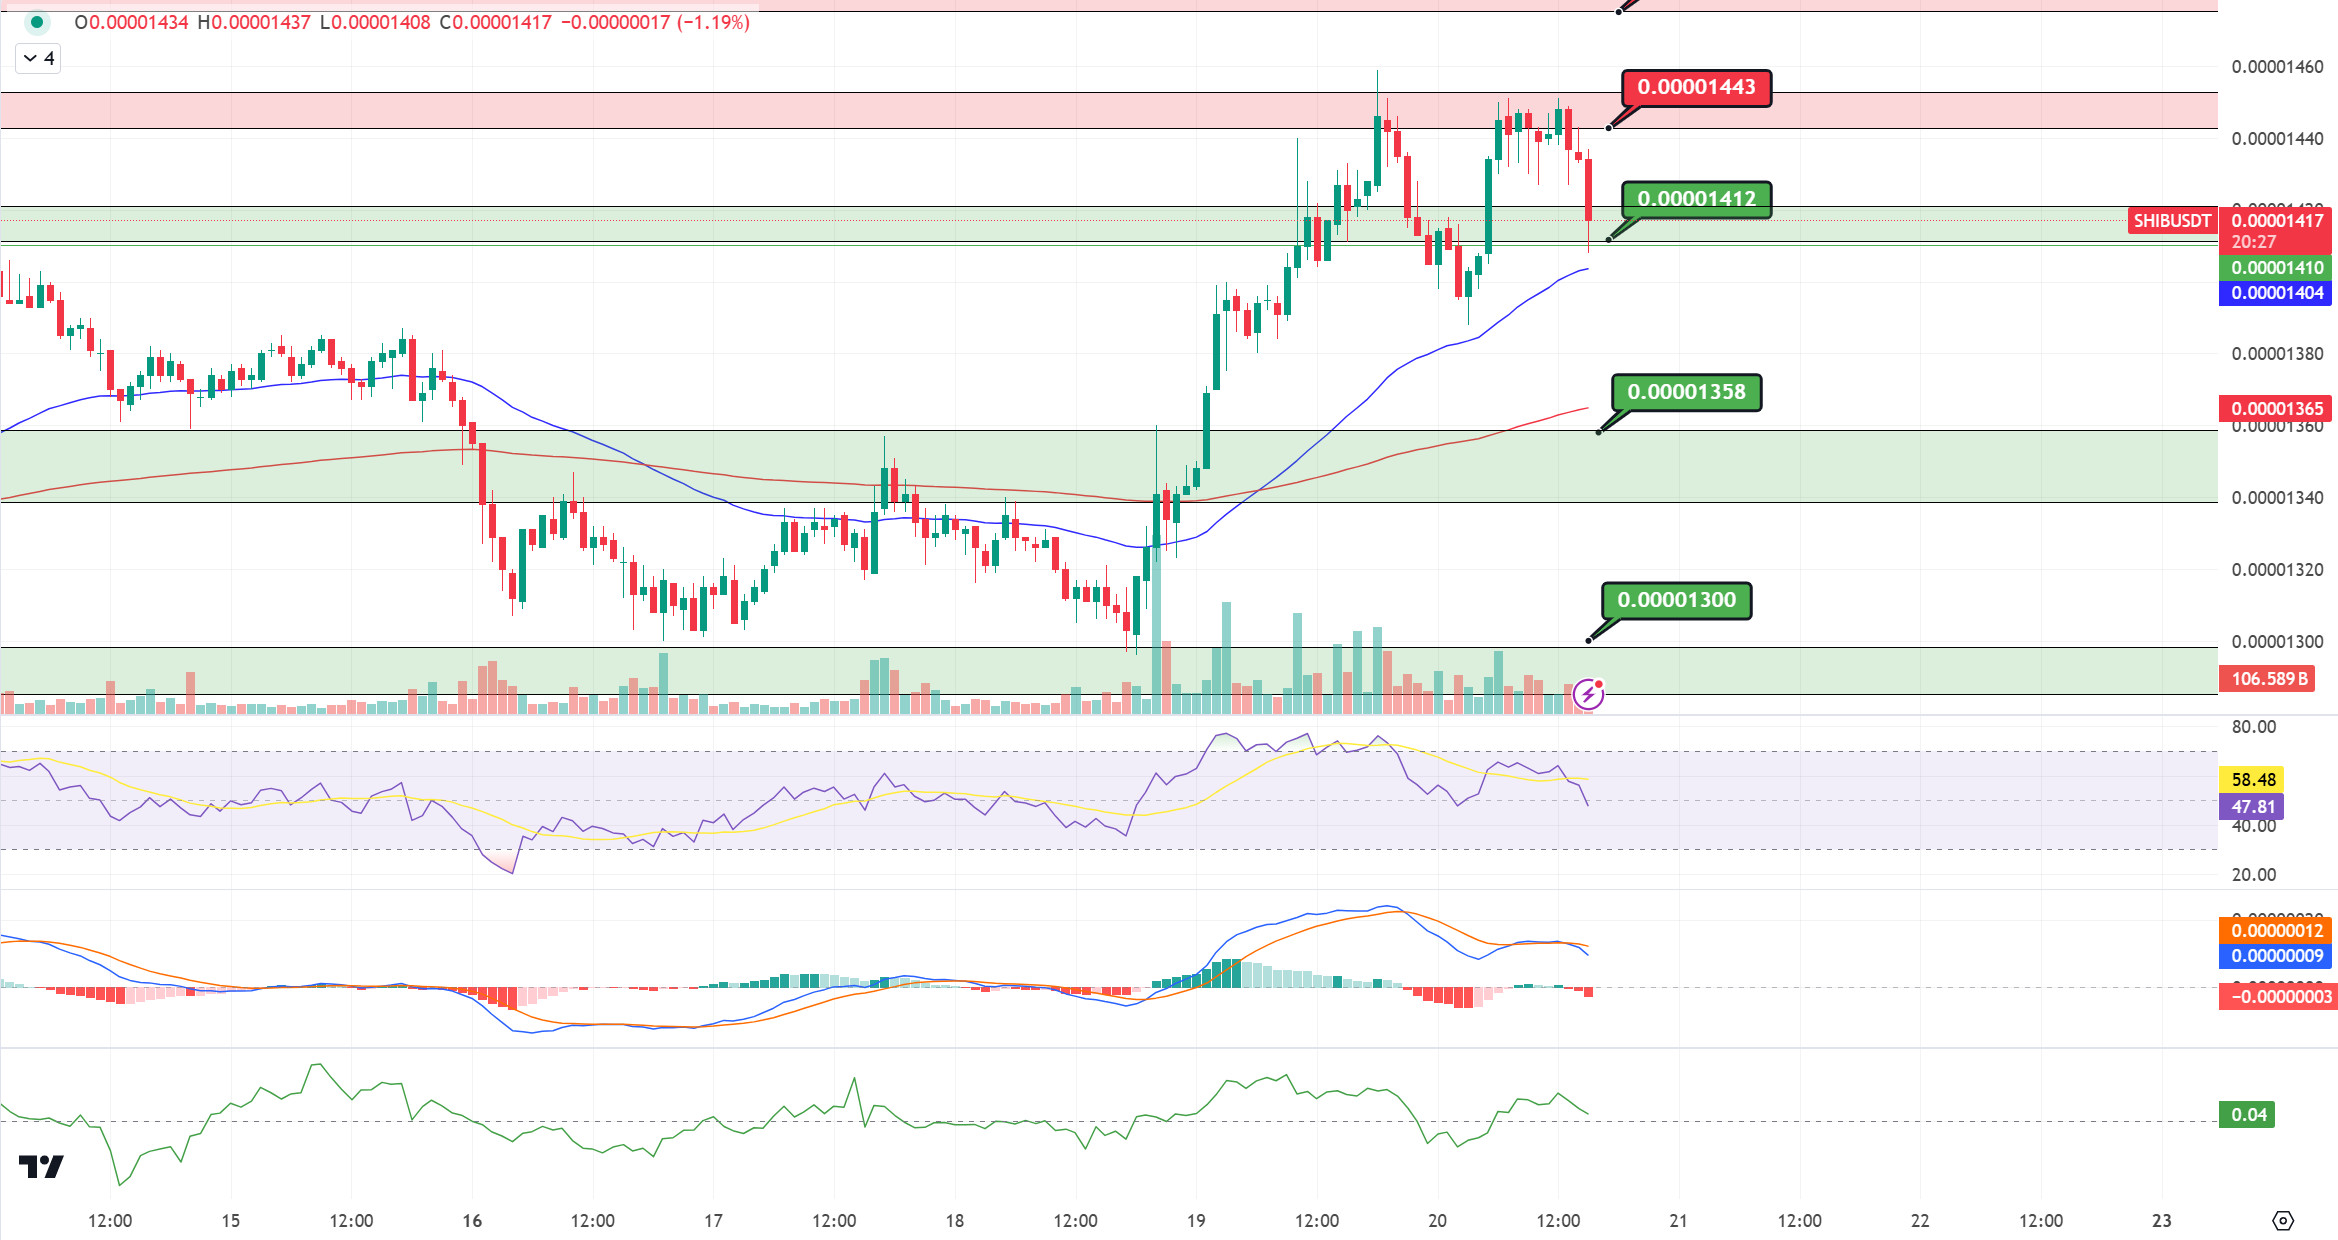
When we examine the chart of Shiba Inu (SHIB), the price corrected from the 0.00001443 resistance level and retreated to the EMA50 levels. We can say that if the price persists above the EMA50, it will test the 0.00001443 resistance level again. On the other hand, if the price is persistent below the EMA50, we can expect it to retreat to 0.00001358 support levels.
(Blue line: EMA50, Red line: EMA200)
Supports 0.00001412 – 0.00001358 – 0.00001300
Resistances 0.00001443 – 0.00001475 – 0.00001507
LEGAL NOTICE
The investment information, comments and recommendations contained herein do not constitute investment advice. Investment advisory services are provided individually by authorized institutions taking into account the risk and return preferences of individuals. The comments and recommendations contained herein are of a general nature. These recommendations may not be suitable for your financial situation and risk and return preferences. Therefore, making an investment decision based solely on the information contained herein may not produce results in line with your expectations.


