MARKET SUMMARY
Latest Situation in Crypto Assets
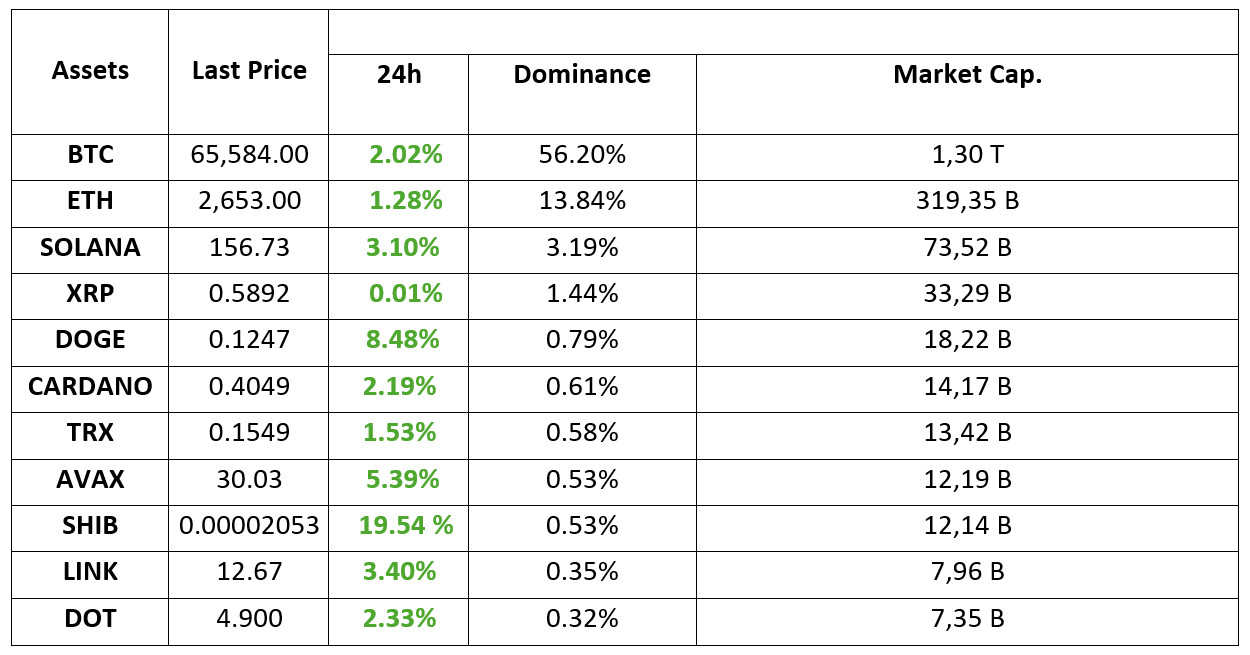
*Prepared on 27.09.2024 at 14:00 (UTC)
WHAT’S LEFT BEHIND
Core PCE released in the US
Core personal consumption expenditures (PCE) data for August was announced in the US. PCE, which is one of the data that the Fed pays the most attention to the course of inflation, has been unprecedentedly low since February 2021 and came in below expectations.
Bloomberg: Interest Rate Cuts Support Bitcoin’s Historic Rise
Loosening US monetary policy and global interest rate cuts have supported Bitcoin’s strong rise. Bitcoin has performed historically, rising more than 10% in September. US election results could shape cryptocurrency regulations.
Bitcoin ETFs in six days of positive flow
Spot bitcoin exchange traded funds (ETFs) in the US recorded daily net inflows of $365.57 million, the highest since late July.
Ethereum Whale Sold 31.6 Million Dollars!
The Ethereum whale sold $31.6 million worth of ETH. The sale questioned whether there was a change in market perception. This move, which may create uncertainty among investors, may lead to short-term price fluctuations.
HIGHLIGHTS OF THE DAY

INFORMATION
*The calendar is based on UTC (Coordinated Universal Time) time zone. The economic calendar content on the relevant page is obtained from reliable news and data providers. The news in the economic calendar content, the date and time of the announcement of the news, possible changes in the previous, expectations and announced figures are made by the data provider institutions. Darkex cannot be held responsible for possible changes that may arise from similar situations.
MARKET COMPASS
The positive sentiment in global markets continues to be driven by the fact that the central banks, which manage the monetary policies of major economies, have started their interest rate cut cycle. Finally, the core PCE Price Index, one of the US data released today, was announced as 0.1%, below the expectations of 0.2%, indicating that inflation pressure may continue to decline in the country. After the data, a decline was observed in the dollar index. After this indicator, which points to the continuation of the pricing that the US Federal Reserve (FED) may continue its “rapid” interest rate cuts, we also saw a rise in digital assets, albeit quite small.
As traditional markets prepare to end the trading week, stock market indices are holding on to gains. The outlook for digital assets is the same. However, investors, who are eagerly waiting to see whether the bullish streak will continue, will of course closely monitor the rest of the day and the weekend. We are getting clues that the recent gains in cryptocurrencies are starting to be somewhat limited. Due to the nature of the market, it would not be surprising to see slight pullbacks that may occur horizontally or only within the limits of the correction. Before the US employment data on October 4 makes the picture a little clearer, the rise may slow down with investors who may want to take the gains of the rises off the table. After this possible consolidation, the main direction is still up, but we will continue to keep the data and news flow that may be decisive under our lens.
TECHNICAL ANALYSIS
BTC/USDT
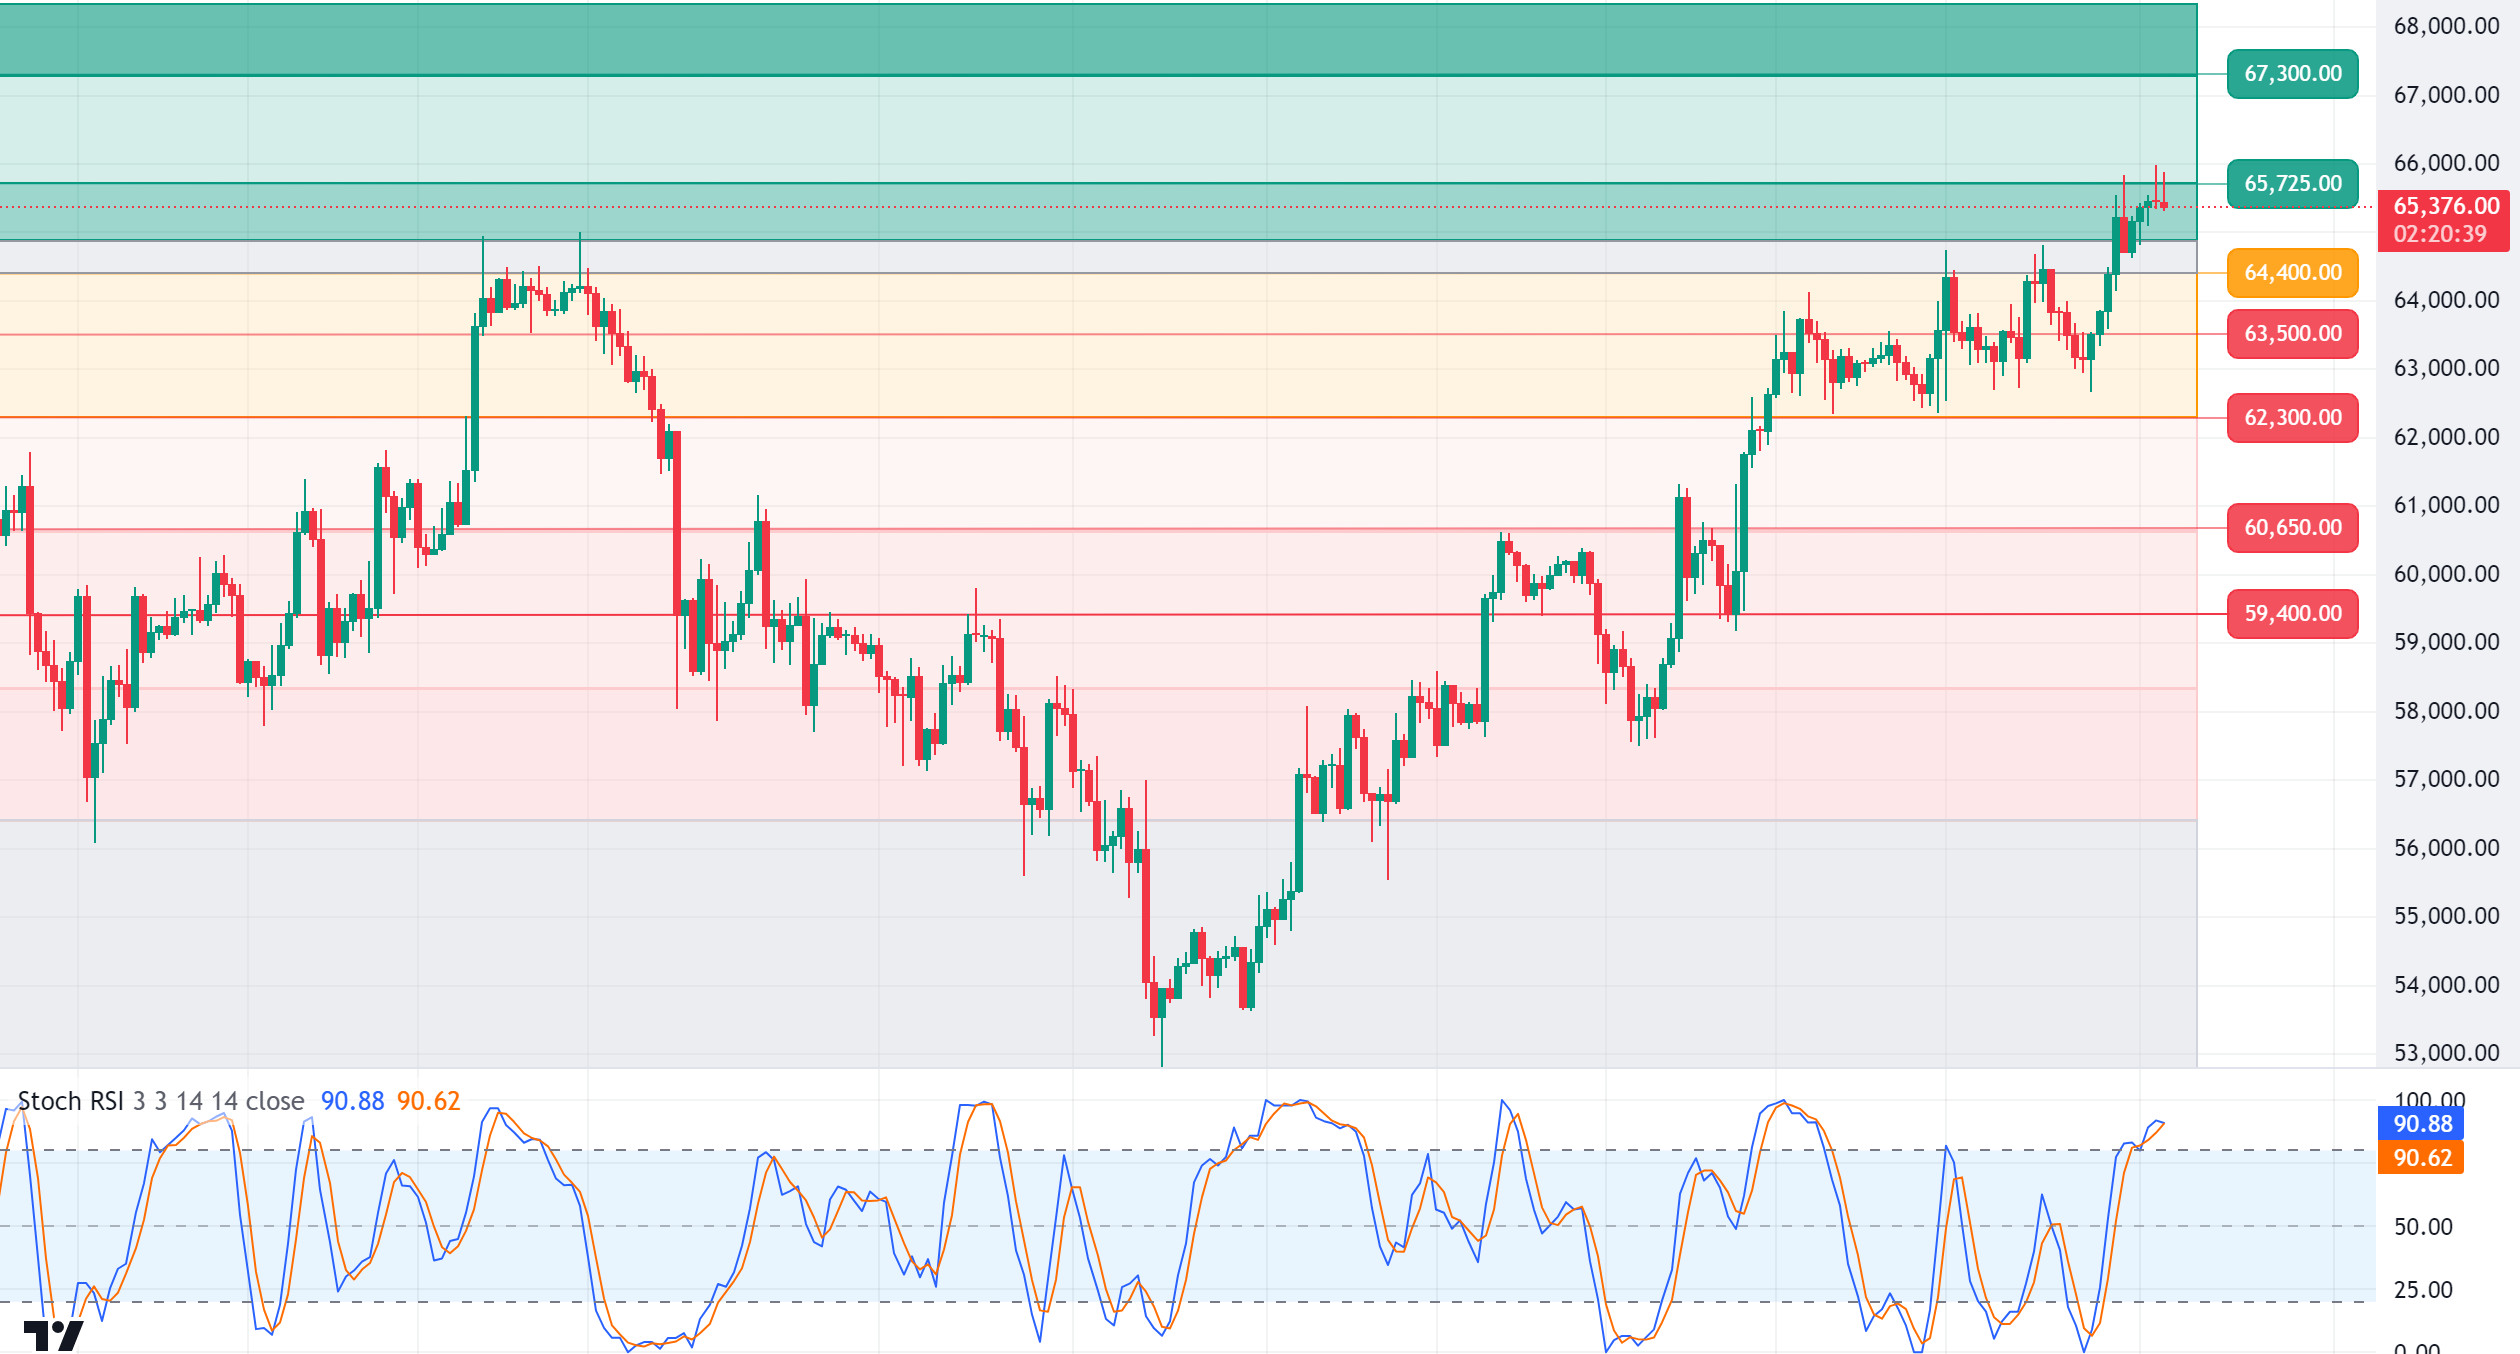
Bitcoin Challenges Resistance! The crypto market has recently been revitalized with successive positive news. The increasing interest of institutional investors and governments in Bitcoin plays an important role in the survival of the market. Especially the improvement in macroeconomic data in the US and the steps taken towards an expansionary monetary policy continue to have positive effects on the crypto market. This positive atmosphere is expected to continue until the upcoming US election process. In addition, the fact that the Bitcoin Halving process has not yet been priced in, with historical data pointing to 170 days after Halving, it is thought that it may continue its upward effect from the beginning of October and momentum will increase. In the BTC 4-hour technical analysis, the price, which draws an image that pushes the resistances, has not yet broken the 65,750 level, which is the resistance level, although it has reached the 66,000 limit after the PCE data. With the PCE coming in lower than expected, which can be considered positive for the crypto market, it may mean that inflation pressures are falling further in the US. This could lead the FED to a more expansionary monetary policy. After this data, we need to focus on 4-hour closes above the resistance level for the continuation of the uptrend. In case of a pullback, 64,400 is the first major support point.
Supports 64,400-62,300 – 60,650
Resistances 65,725 – 67,300 – 68,350
ETH/USDT
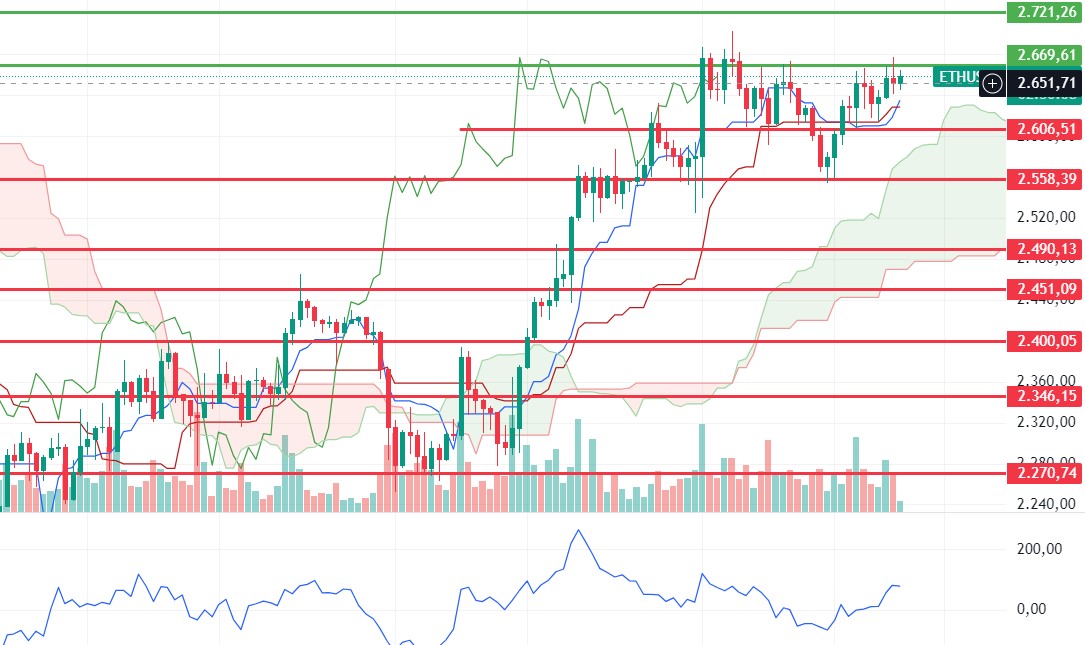
Continuing its horizontal movement between 2.606 – 2.669 levels, Ethereum seems to have lost its power against Bitcoin in general. The ETH/BTC pair is seen to have dropped from 0.0424 to 0.0404. If the 2.669 level is not exceeded, a decline seems likely. The sell signal and downward momentum in Ichimoku also support this possibility. If it retreats to 2.606 levels and breaks this level, 2.558 price can be targeted. However, a voluminous breakout of the 2.669 level may start a positive trend and 2.721 – 2.815 levels can be targeted respectively.
Supports 2,606 – 2,558 – 2,490
Resistances 2,669 – 2,721 – 2,815
LINK/USDT
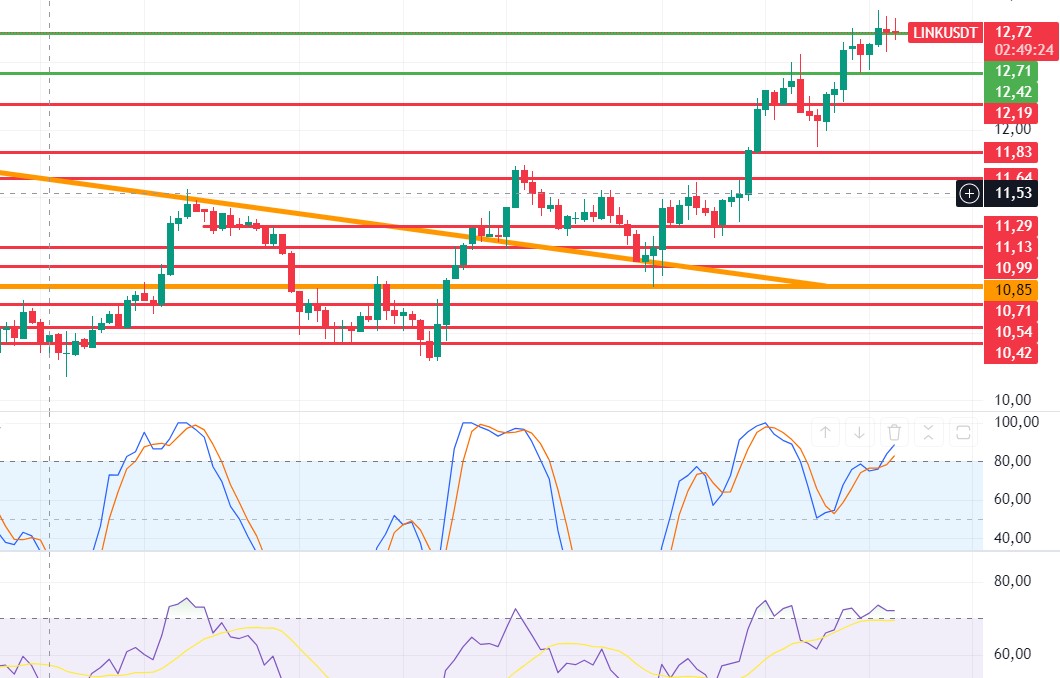
For LINK, which is trying to overcome 12.71 resistance, although the breakdown of the sell signal formed in the Stochastic RSI seems positive, it seems likely that some decline is likely to come due to the negative mismatch and negative structure in the RSI and the fact that it has reached an important resistance level. A decline up to 12.42 can be expected. Below this level, 12.19 stands out as the most important support point. If the stay above 12.71 is maintained, it can be said that the trend will shift back to positive. In this case, it may be possible to see sharp rises up to 13.46.
Supports 12.42 – 12.19 – 11.83
Resistances 12.71 – 13.46 – 14.75
SOL/USDT
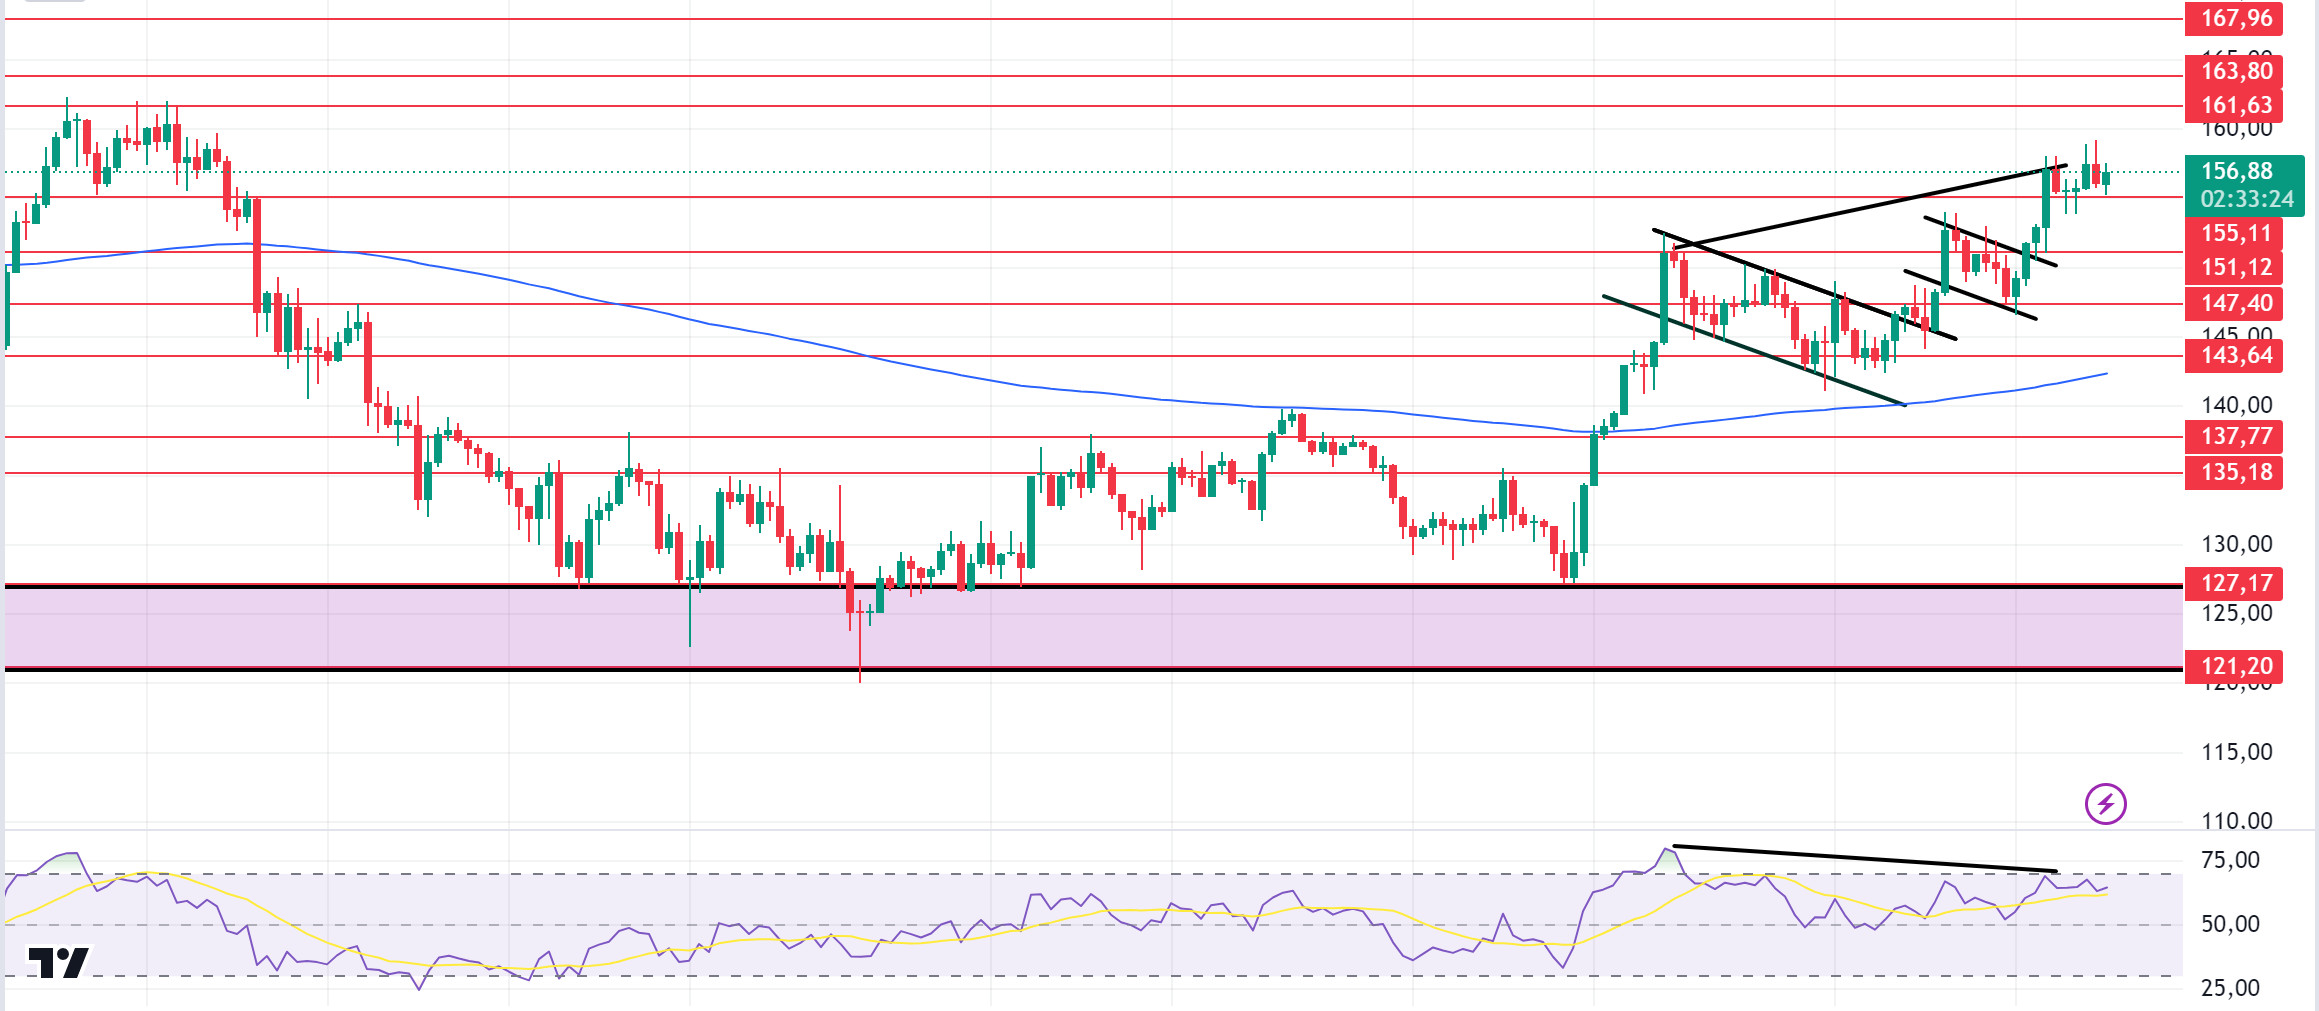
US Core PCE Price Index came in at 2.7%, as expected. After the data released, the market moved slightly upwards. When we analyze the chart, SOL is about to reach a strong resistance point. The 161.63 – 163.80 band, which is the highest level in the last two months, may reverse the SOL price from here. When we look at the 4-hour rsi (14) indicator, there is a mismatch. This may cause pullbacks. Both macroeconomic conditions and innovations in the Solana ecosystem, 161.63 – 163.80 levels appear as a resistance place. If it rises above these levels, the rise may continue. If investors continue profit sales, the 200 EMA average and 155.11 – 151.12 levels appear as support in the retracements that will occur. If it comes to these support levels, a potential rise should be followed.
Supports 155.11 – 151.12 – 147.40
Resistances 161.63 – 163.80 – 167.96
ADA/USDT
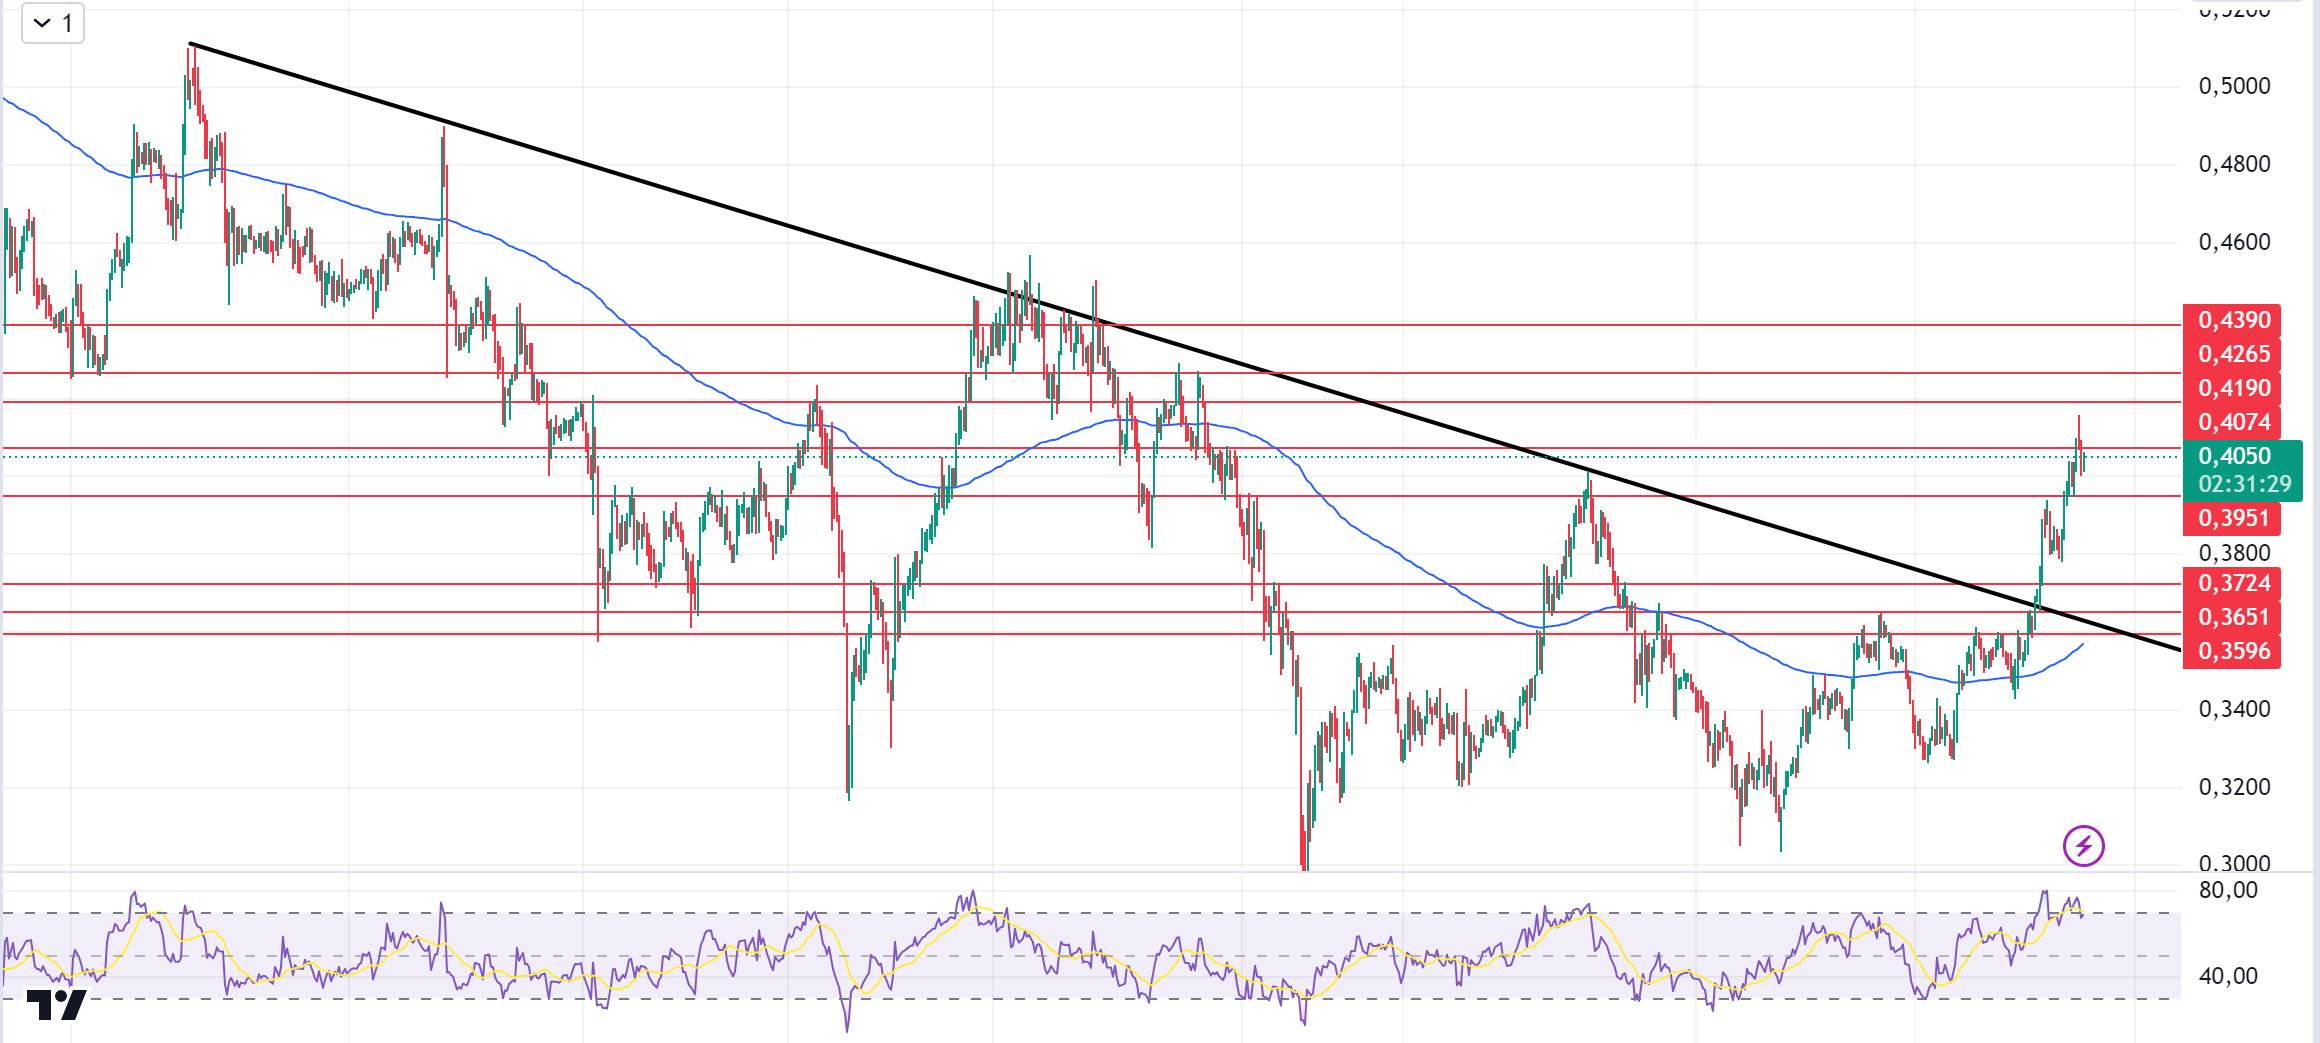
US Core PCE Price Index came in at 2.7%, as expected. After the data released, the market moved slightly upwards. Since our analysis in the morning, the market has declined slightly. ADA, which has risen by 9.11% since yesterday, broke the resistance of the downtrend since May 21, signaling a potential upside. ADA, which last saw these levels on July 29, is a strong support at the level of 0.3951 in retracements due to possible profit sales. In the rises that will take place with the continuation of macro-economic data or the positive atmosphere in the ecosystem, the 0.4074 level can be followed as resistance.
Supports 0.3951 – 0.3724 – 0.3651
Resistances 0.4074 – 0.4190 – 0.4265
AVAX/USDT
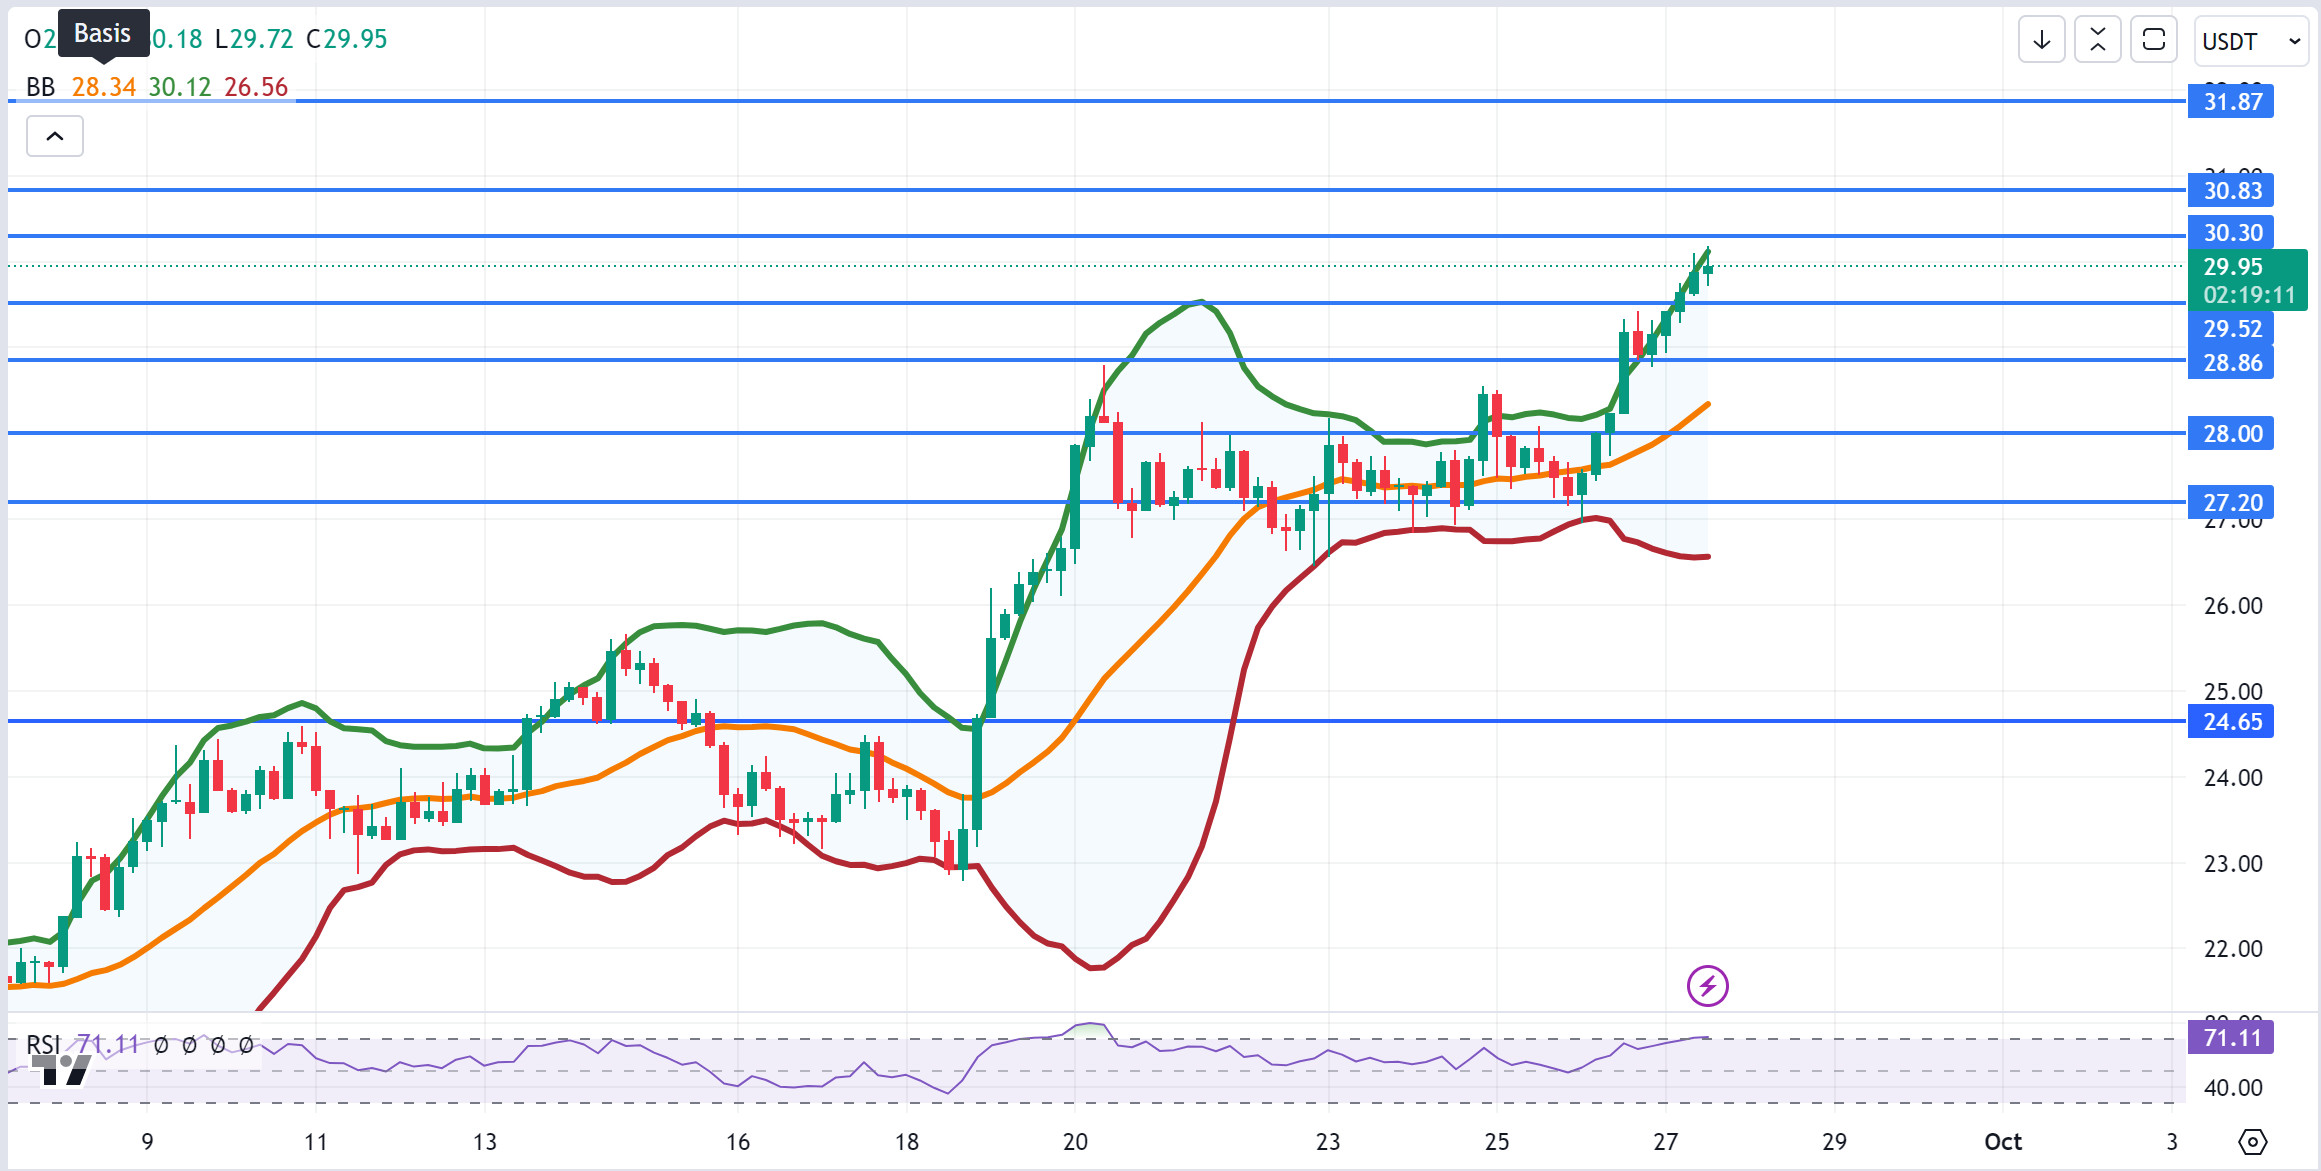
AVAX, which opened today at 27.29, is trading at 28.52, up about 4.5% during the day. Today, US gross domestic product and unemployment claims data were announced and these data, which were in line with expectations, were perceived positively by the market.
On the 4-hour chart, we see a rising flag pattern. It is trying to break the near-horizontal falling channel upwards after the announcement of a $ 40 million grant program for developers working on the Avalanche network. According to the formation target, it may test 29.52 resistance. With a selling pressure that may come from these levels, it may test the 28.00 and 27.20 supports. As long as it stays above 24.65 support during the day, the desire to rise may continue. With the break of 24.65 support, sales may increase.
Supports 28.00 – 27.20 – 26.81
Resistances 28.86 – 29.52 – 30.30
TRX/USDT
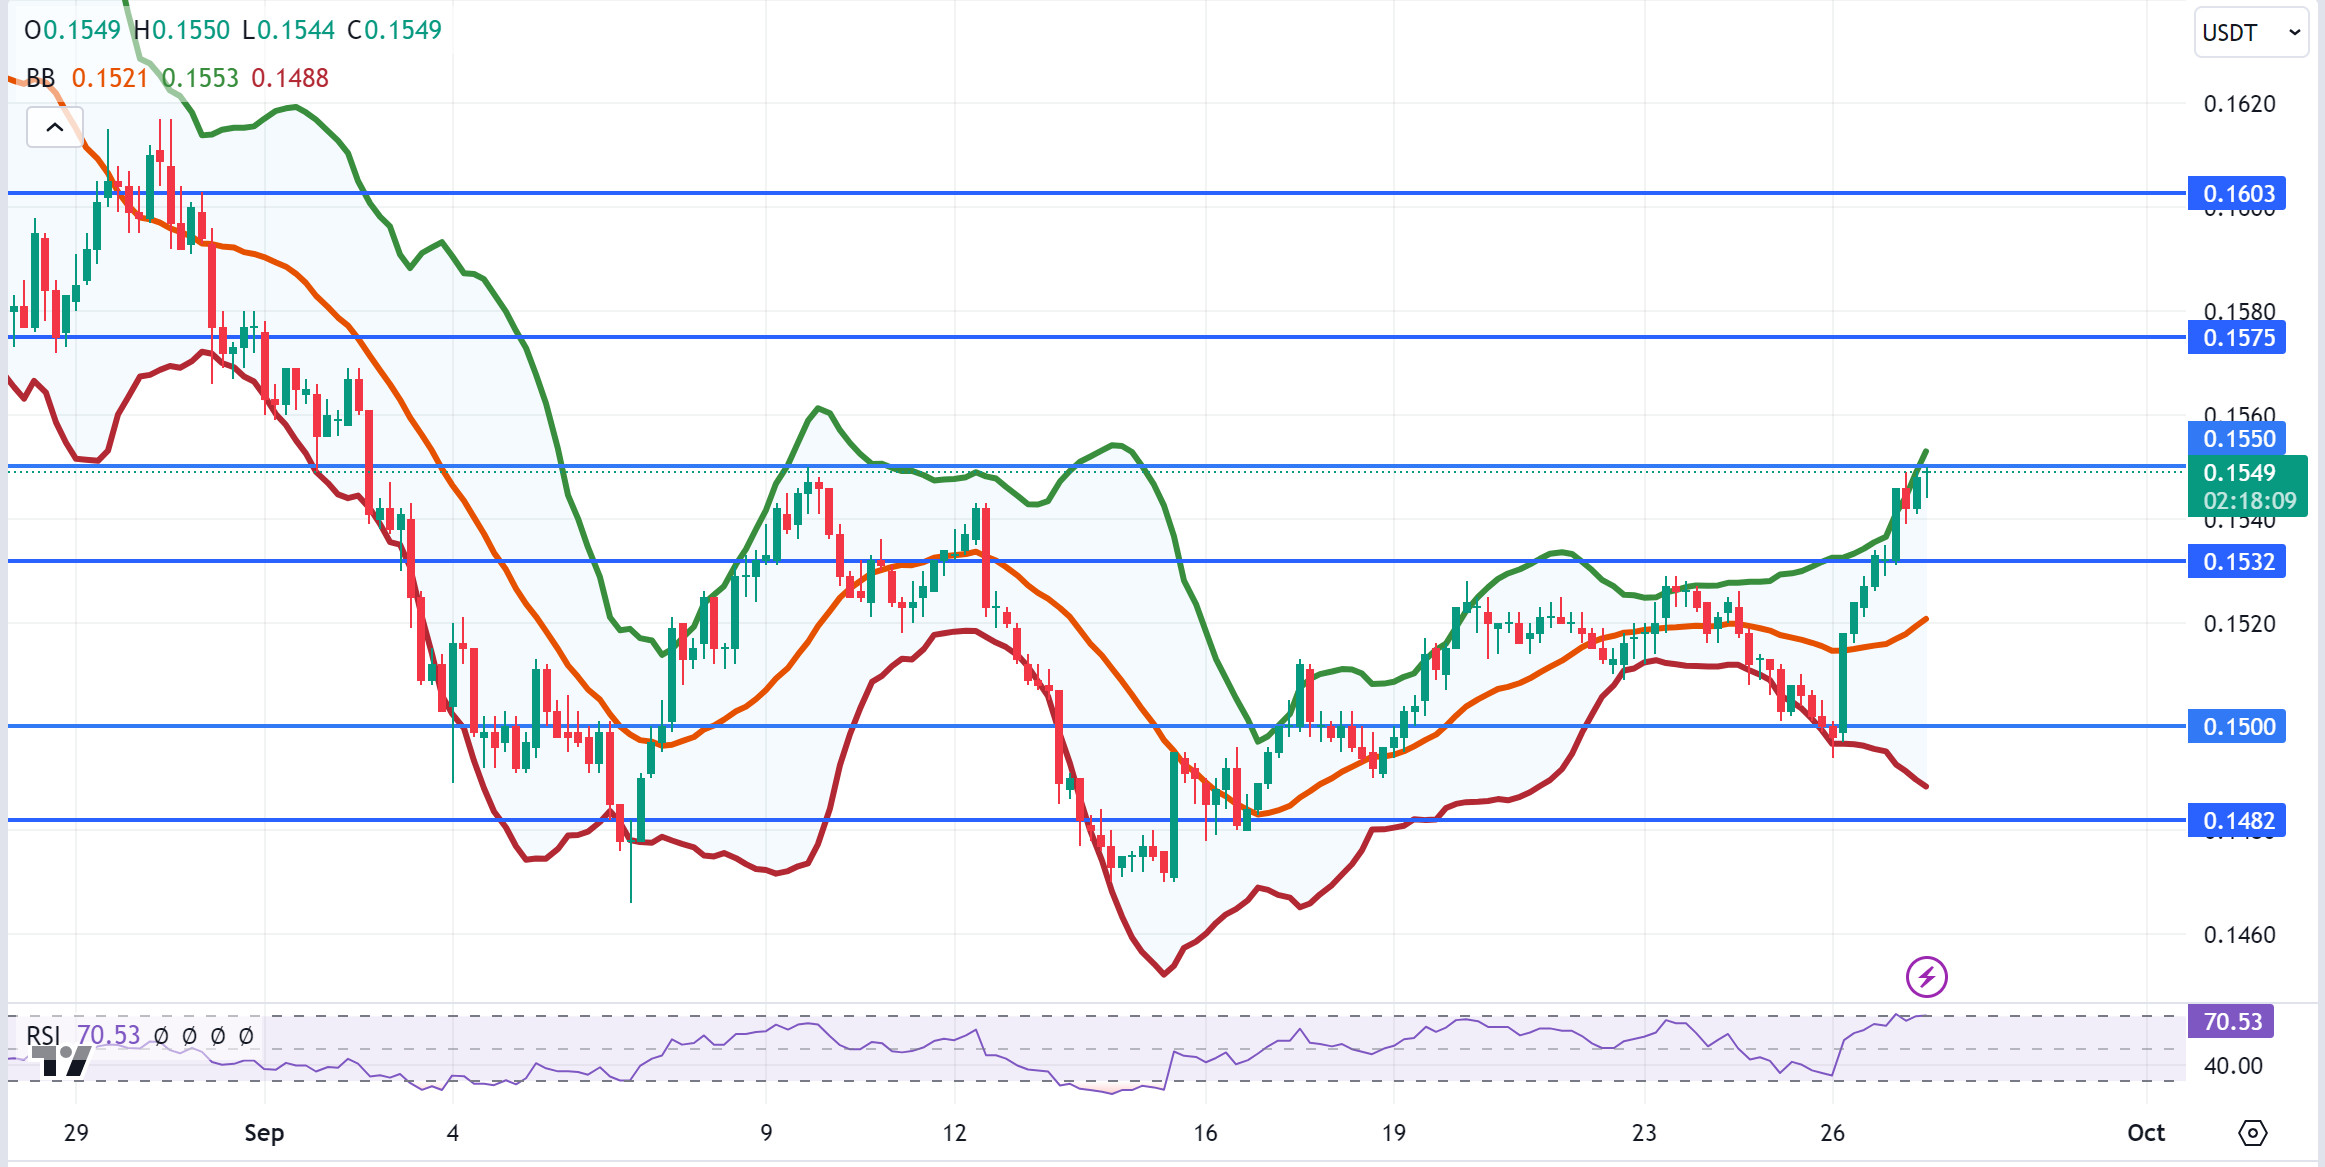
TRX, which started today at 0.1500, continues to rise after the gross domestic product and unemployment claims data from the US today and is trading at 0.1526.
On the 4-hour chart, it continues its movement within the rising channel. The RSI is trying to break the middle band of the rising channel upwards with a value of 60 and some more upside can be expected from here. In such a case, it may move to the upper band of the channel and test the 0.1532 support. However, with the selling pressure that may come from the middle band of the channel, it may test 0.1500 support again. As long as TRX stays above 0.1482 support, the desire to rise may continue. If this support is broken downwards, sales can be expected to increase.
Supports 0.1500 – 0.1482 – 0.1429
Resistances 0.1532 – 0.1575 – 0.1603
XRP/USDT
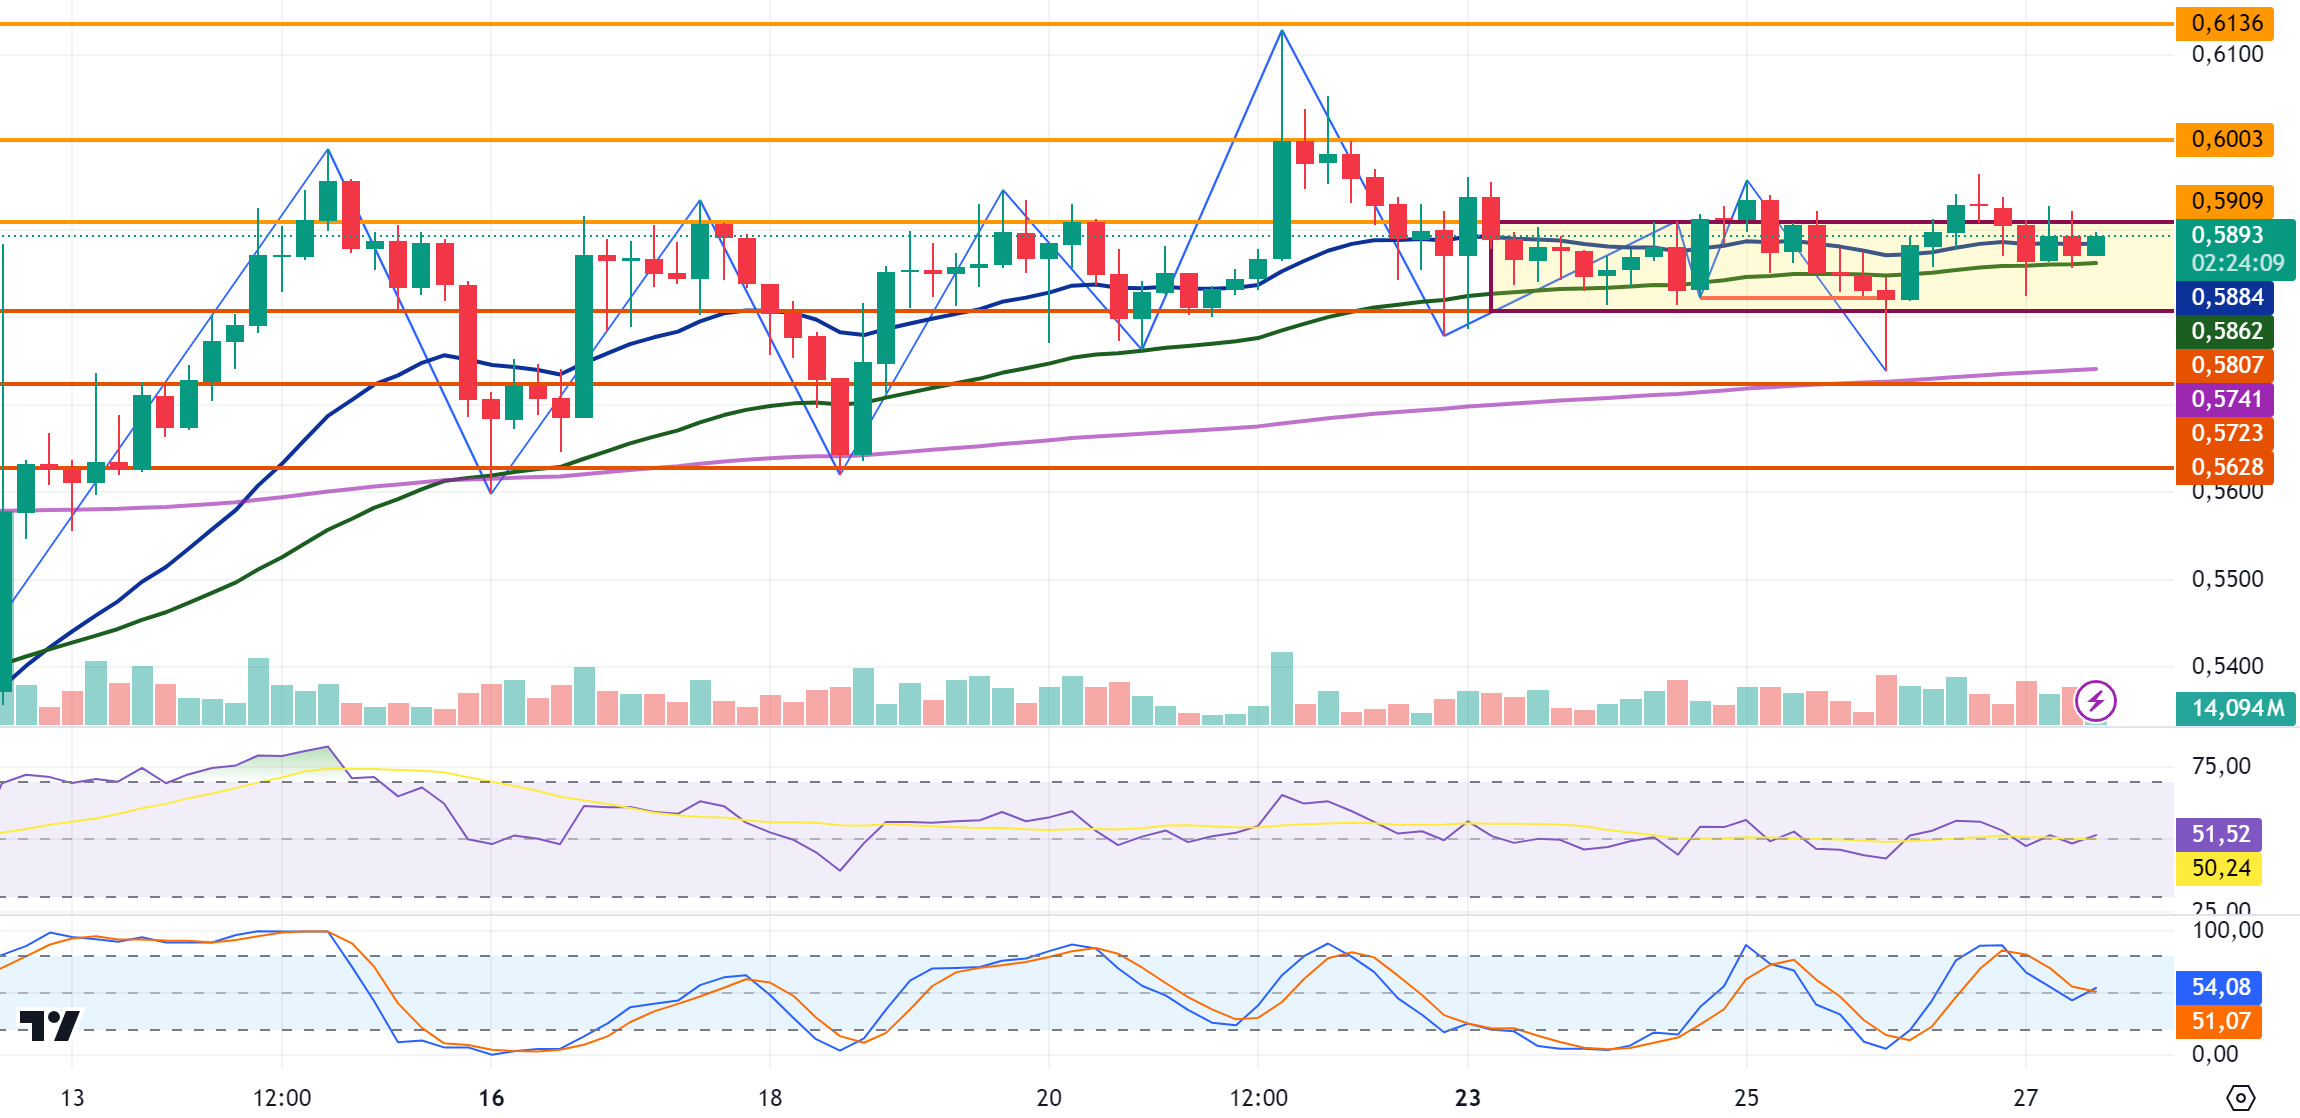
XRP, which started today at 0.5902, continues to move in a horizontal band and is currently trading at 0.5893. Unlike the crypto market, which is in an uptrend before the SEC’s decision on the case with the SEC, it continues its horizontal movement. In the 4-hour analysis, XRP, which continues its horizontal movement between EMA20 and EMA50 levels, may test the resistance levels of 0.6003-0.6136 in the continuation of the rise if it breaks the EMA20 and 0.5909 resistance levels with its rise. If it breaks the EMA50 and 0.5807 support levels, it may test the 0.5723-0.5628 support levels in the continuation of the decline.
For XRP, the EMA200 and 0.57 support zone stands out on the decline and may rise with the purchases that may come from these levels on the decline and may offer a long trading opportunity. After the candle closes below the EMA200 and 0.57 support zone, the decline may deepen and offer a short trading opportunity. If it closes above the 0.59 resistance zone, the rise may continue and offer a long trading opportunity.
EMA20 (Blue Line) – EMA50 (Green Line) – EMA200 (Purple Line)
Supports 0. 5807 – 0.5 723 – 0.5628
Resistances 0.5909 – 0.6 003 – 0.6136
DOGE/USDT
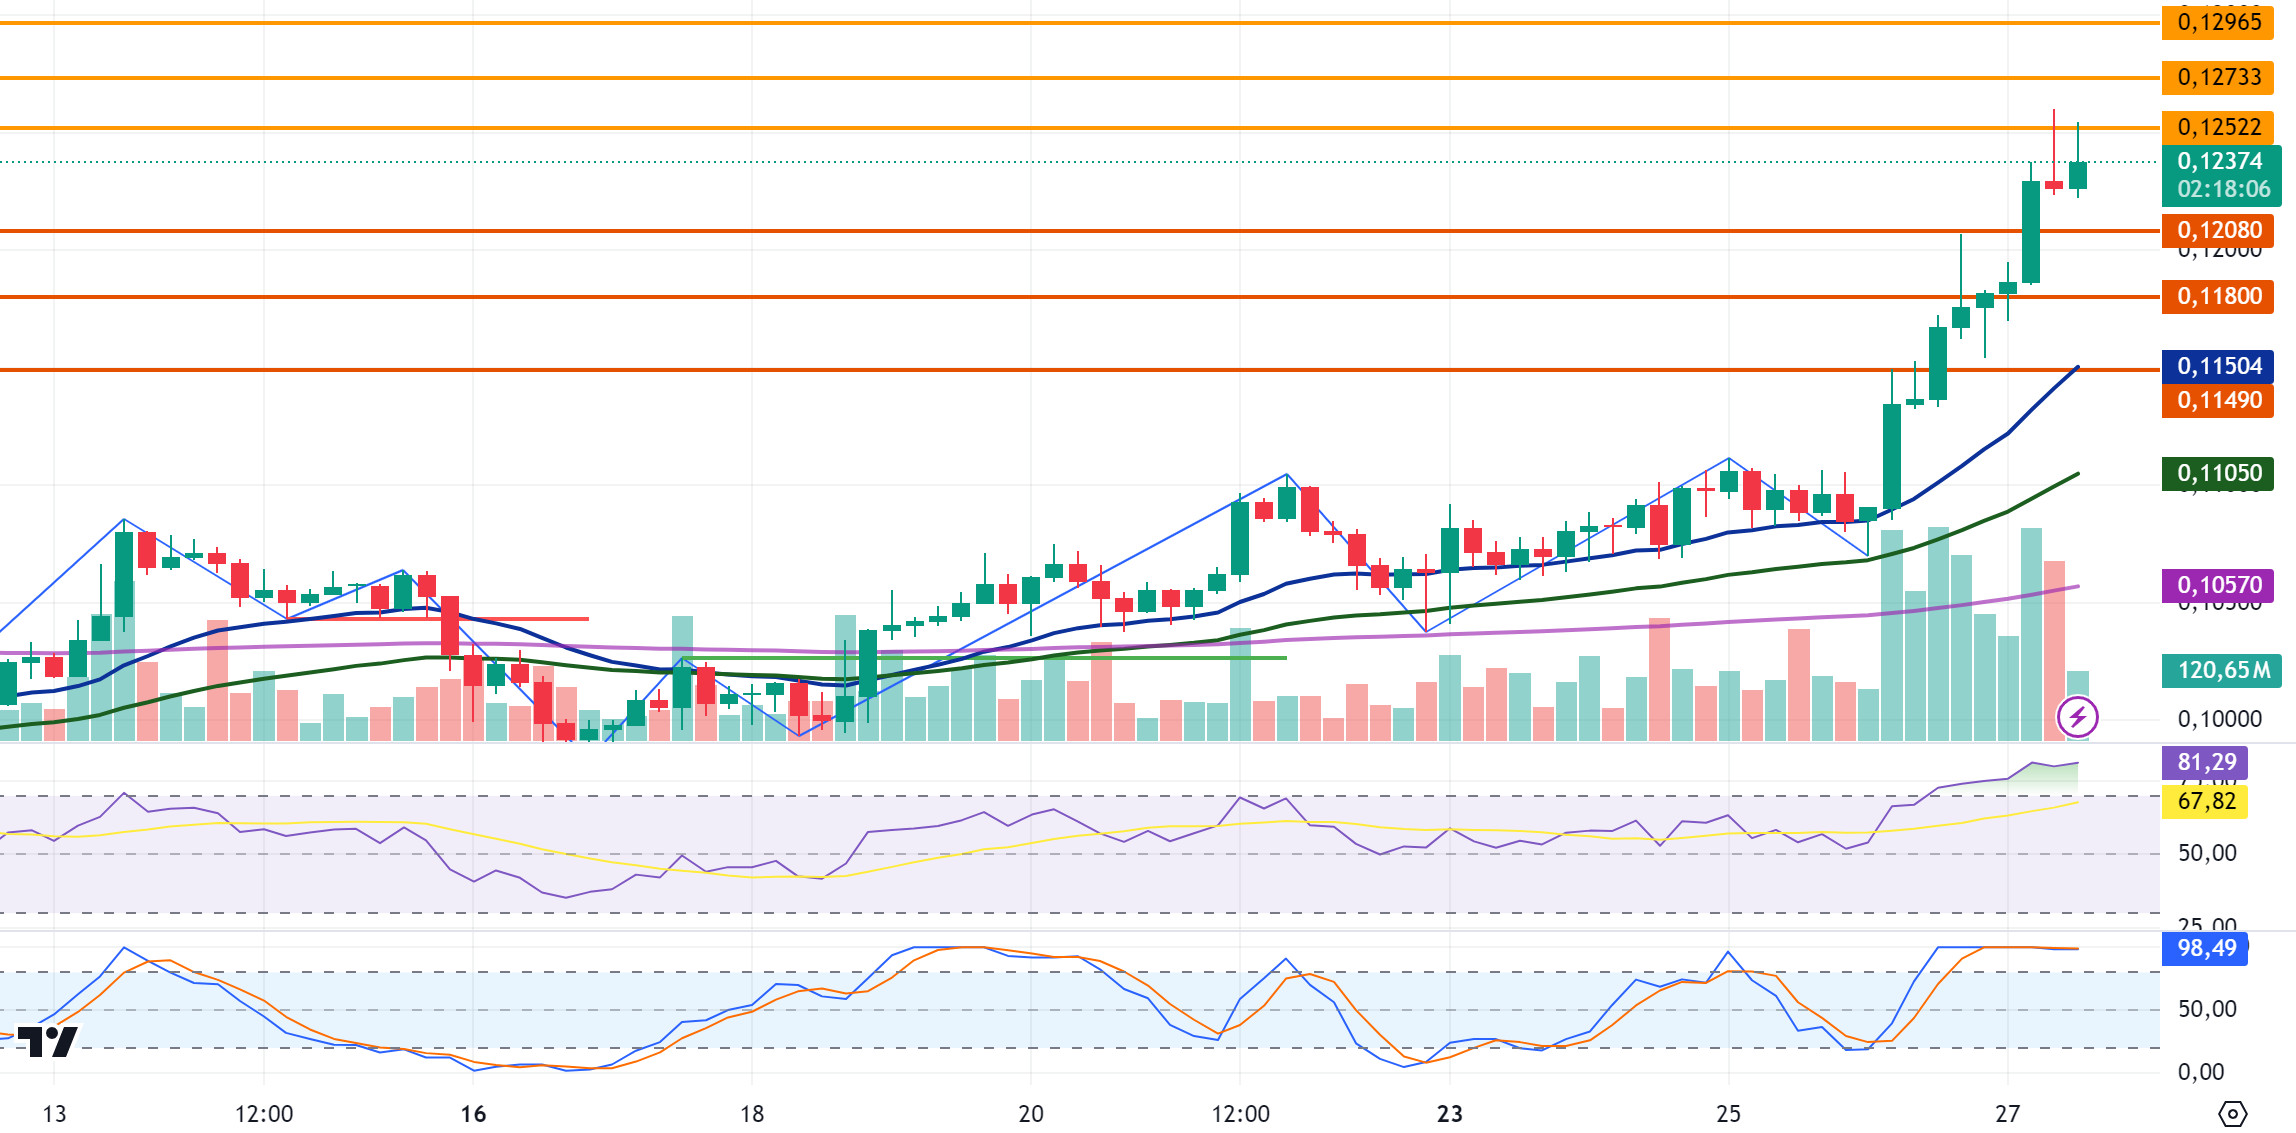
DOGE, which started the day at 0.1181, tested the 0.1252 resistance level with its rise and then fell to 0.1225 with the sales. After the US August core personal consumption expenditure index (PCE) announced a lower-than-expected figure on a monthly basis, DOGE retested the resistance level of 0.1252 with its rise in the 4-hour analysis and continues to be traded at 0.1237 with the decline it cannot break. DOGE, which is in the ascending channel, may rise again with the purchases that may come after the decline, and if it breaks the 0.1252 resistance level with its rise, it may test the resistance levels of 0.1275-0.1296 in the continuation of the rise. If the decline continues with the sales that may come after the rise, DOGE may test the support levels of 0.1208-0.1180-0.1149.
DOGE may correct at the overbought level in the 0.1250 resistance zone and may offer a short trading opportunity. In the process where the positive environment continues, it may continue to rise after the correction and may offer a long trading opportunity.
Supports 0.1208 – 0.1180 – 0.1149
Resistances 0.1 252- 0.1275 – 0.1296
DOT/USDT
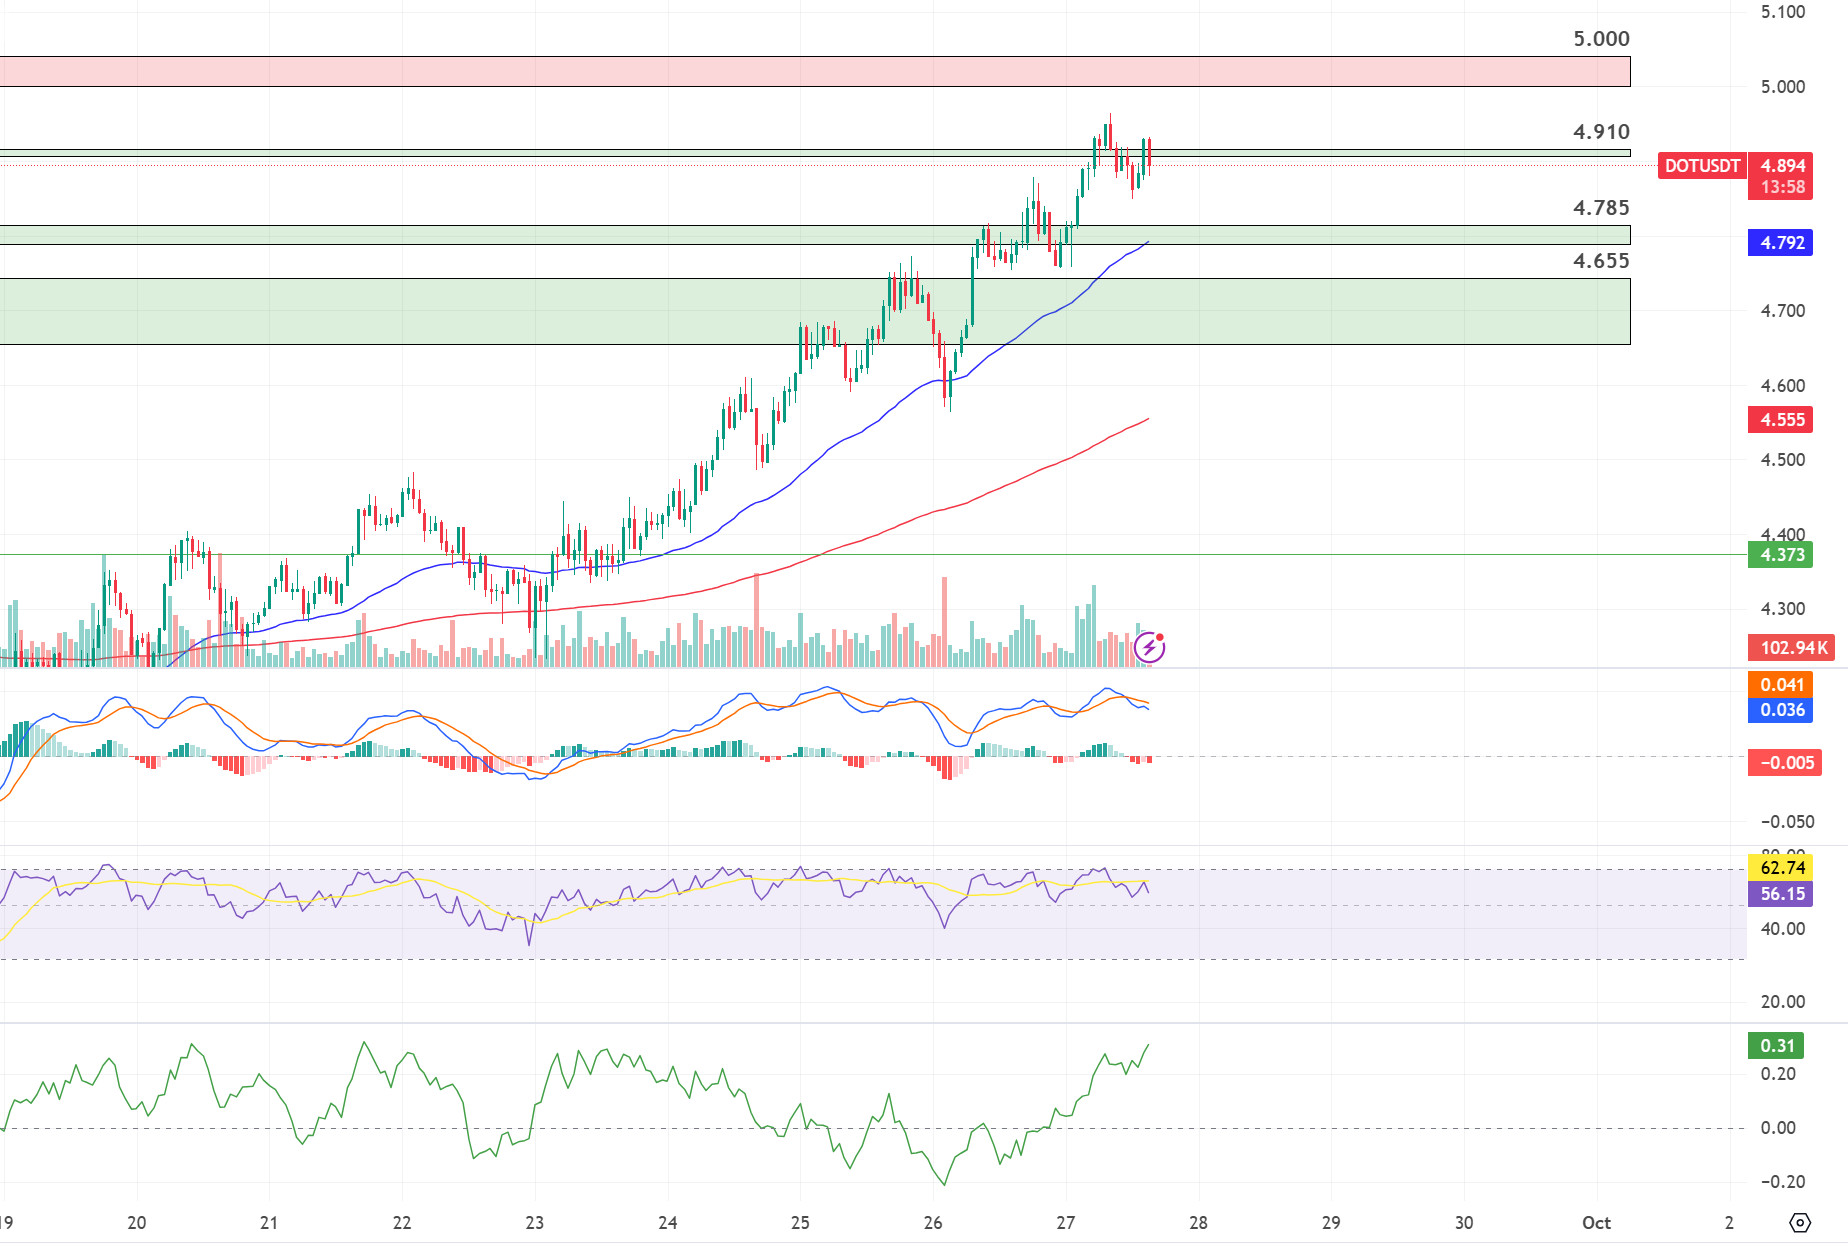
Polkadot (DOT) seems to have failed to hold above the 4.910 resistance. The 4-hour candle closure below 4.910 strengthened the idea that the price may correct. When we examine the MACD oscillator, we see that the selling pressure increased compared to the previous hour. If the selling pressure at 4.910 is not broken, the price may retreat towards the next support level of 4.785. On the other hand, when we examine the CMF oscillator, we see that the buying pressure is quite strong. If the price breaks the selling pressure at 4.910, the next target could be the psychological resistance level of $5.
(Blue line: EMA50, Red line: EMA200)
Supports 4.910 – 4.785 – 4.455
Resistances 5.000 – 5.140 – 5.425
SHIB/USDT
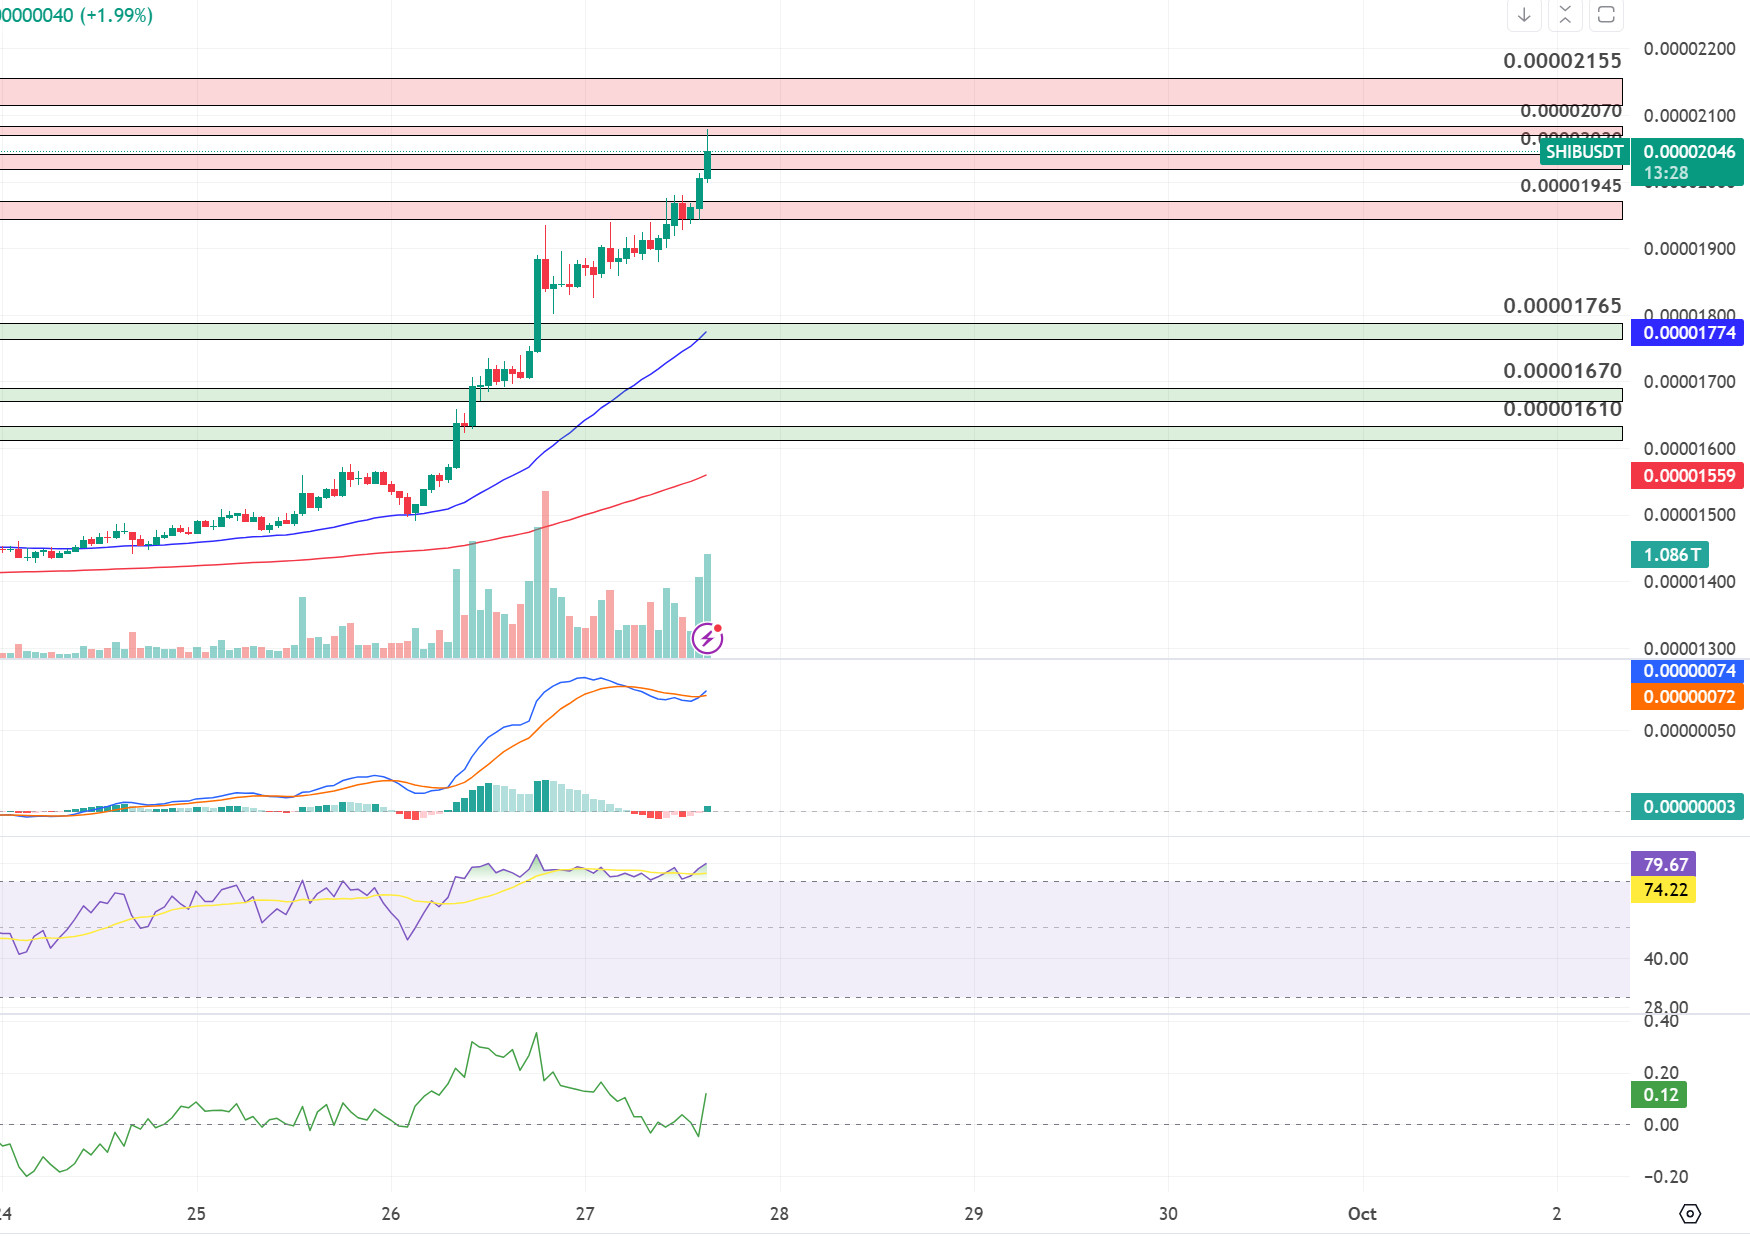
Shiba Inu (SHIB) is testing its resistances with increasing burn rates. SHIB, which has shown an excellent upward performance with the burning rates rising day by day, seems to have received a reaction from the 0.00002070 resistance level. In case the price wants to make a correction of this rise, the price may move towards 0.00002020 and 0.00001945 levels. If the price is persistent below these levels, we can expect it to retreat towards 0.00001765 levels. On the other hand, if this uptrend continues, the price may move towards 0.00002155 levels.
(Blue line: EMA50, Red line: EMA200)
Supports 0.00001765 – 0.00001670 – 0.00001610
Resistances 0.00001945 – 0.00002020 – 0.00002070
LEGAL NOTICE
The investment information, comments and recommendations contained herein do not constitute investment advice. Investment advisory services are provided individually by authorized institutions taking into account the risk and return preferences of individuals. The comments and recommendations contained herein are of a general nature. These recommendations may not be suitable for your financial situation and risk and return preferences. Therefore, making an investment decision based solely on the information contained herein may not produce results in line with your expectations.


