MARKET SUMMARY
Latest Situation in Crypto Assets

*Prepared on 1.10.2024 at 07:00 (UTC)
WHAT’S LEFT BEHIND
Powell’s Optimistic Remarks on US Inflation
Powell stated that the US economy is strong, and inflation is on track to fall towards the 2% target. He emphasized that the labor market has strengthened since its volatile state in the past and he does not believe that further cooling is needed. Moreover, the Fed Chair indicated that in addition to the two 25 basis points rate cuts planned for the year, another 50 basis points cut could be possible in case of positive inflation data.
A Senator in the US Introduced a Bill That Will Be a Turning Point for Bitcoin and All Cryptocurrencies!
Ohio State Senator Niraj Antani has introduced a new bill that aims to legalize the use of cryptocurrencies, including Bitcoin, to pay state and local taxes.
Japan Will Re-Examine Cryptocurrency Regulations!
Japan is preparing to review its cryptocurrency market regulations and will assess whether the current rules adequately protect investors. Reclassification of cryptocurrencies as financial instruments and lower taxes could be on the agenda.
HIGHLIGHTS OF THE DAY

INFORMATION:
*The calendar is based on UTC (Coordinated Universal Time) time zone. The economic calendar content on the relevant page is obtained from reliable news and data providers. The news in the economic calendar content, the date and time of the announcement of the news, possible changes in the previous, expectations and announced figures are made by the data provider institutions. Darkex cannot be held responsible for possible changes that may arise from similar situations.
MARKET COMPASS
Digital assets, which faced pressure in the first transactions of the new week, found the opportunity to take a breather in Asian transactions this morning. In the Far East, where Chinese markets were closed, Japanese indices rose and the Yen depreciated.
In his speech yesterday, Fed Chairman Powell gave the green light for further rate cuts, but indicated that the cuts may not be as big as the last meeting. According to the CME FedWatch Tool, the probability of the Fed cutting rates by 25 basis points (instead of 50) on November 7 is around 61.%. Markets will remain focused on US macro indicators as Powell reiterated that they will remain data-driven.
The agenda in the Middle East is heating up. Israel has begun what it describes as a “limited” ground operation in Lebanon, but investors seem to be focused on how monetary policies will change. In this context, digital assets tried to recover from their recent declines in the space opened by the appreciation of the dollar and the decline of the Japanese Yen after Powell’s statements yesterday.
Against this backdrop, the US macro indicators and the statements of the Federal Open Market Committee (FOMC) members ahead of Friday’s critical employment data will be closely monitored. Purchasing Managers’ Indices (PMI) will be under the spotlight. When we look at the final pricing equation, the market reaction to these data coming in above or below expectations may be somewhat mixed. However, we still think that the data will be taken as a signal about the health of the US economy. In other words, the equation of “good data-good market, bad data-bad market” may work. In addition, JOLTS, which may give clues about the labor market, will also be under the scrutiny of investors. Afterwards, all eyes will turn to the statements of FOMC officials and markets will look for details on the FED’s next rate cut.
Amid this agenda for digital assets, we do not think that the recent rally in Asia has found a bottom yet. Although we anticipate that the main direction is up, we have not received clear clues that the retracement phase, which we stated at the beginning of the week, is over. In this parallel, we believe that short-term declines can be monitored before the expected rises.
TECHNICAL ANALYSIS
BTC/USDT
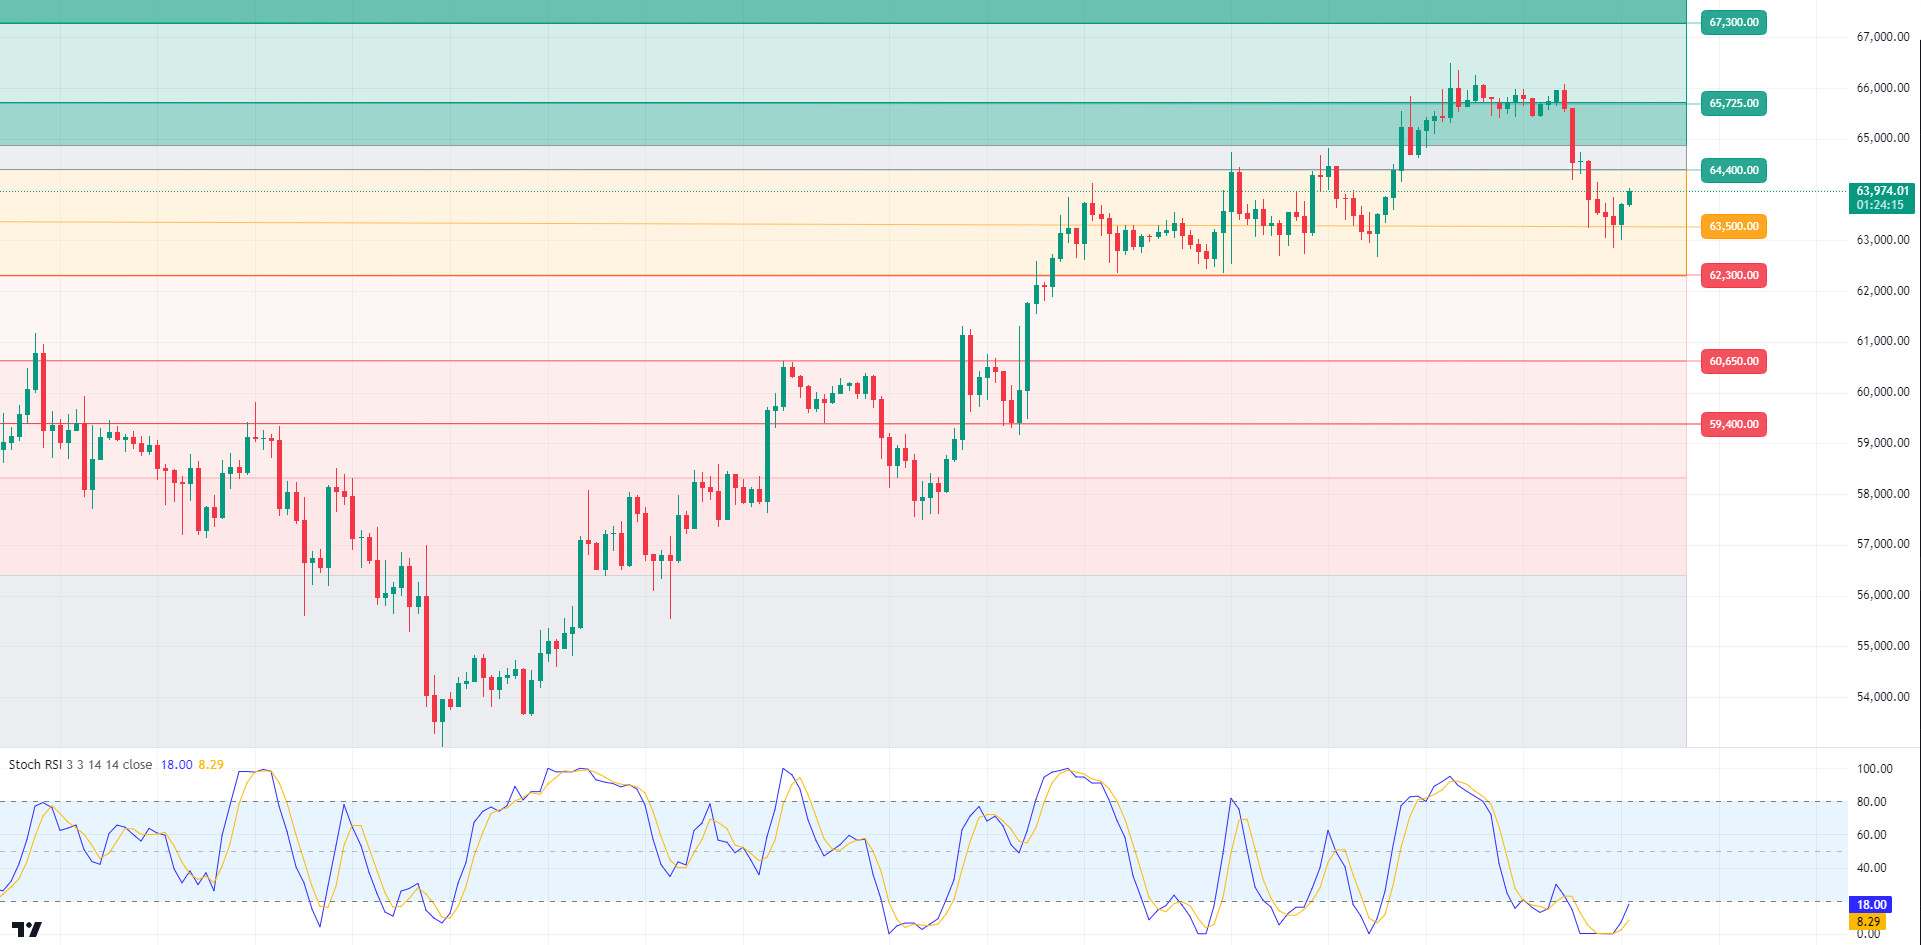
Impressive September for Bitcoin! Bitcoin closed at 63,300 in September 2024, up 7.29%, making it the highest September close in history. When we look at historical data, it is seen that the bullish momentum in Bitcoin has increased in the last quarterly price movements. In the continuation of this trend, we can say that the positive course for Bitcoin may continue to increase. On behalf of crypto, Powell’s statements yesterday and the expectation of targeted levels in inflation and the re-evaluation of the possibility of a 50 basis point cut at the next meeting continue to give hope to the crypto market. In the BTC 4-hour technical analysis, we see that the price, which tested the minor support level of 63,500 for the third time, could not pass this level. We can say that BTC, which has not yet reacted to Powell’s optimistic messages, is likely to realize halving pricing in the coming days. With the start of the historical bullish cycle in October, halving pricing and interest rate cuts may bring a new ATH level to the agenda in BTC’s price. In the short term for the upward movement, the upward momentum can be strengthened by breaking the 65,725 level after the 64,400 level. In the event of an event that may change the trend out of the agenda, support levels may appear at minor 63,500 and major 62,300.
Supports 64,400 – 62,300 – 60,650
Resistances 65,725 – 67,300 – 68,350
ETH/USDT
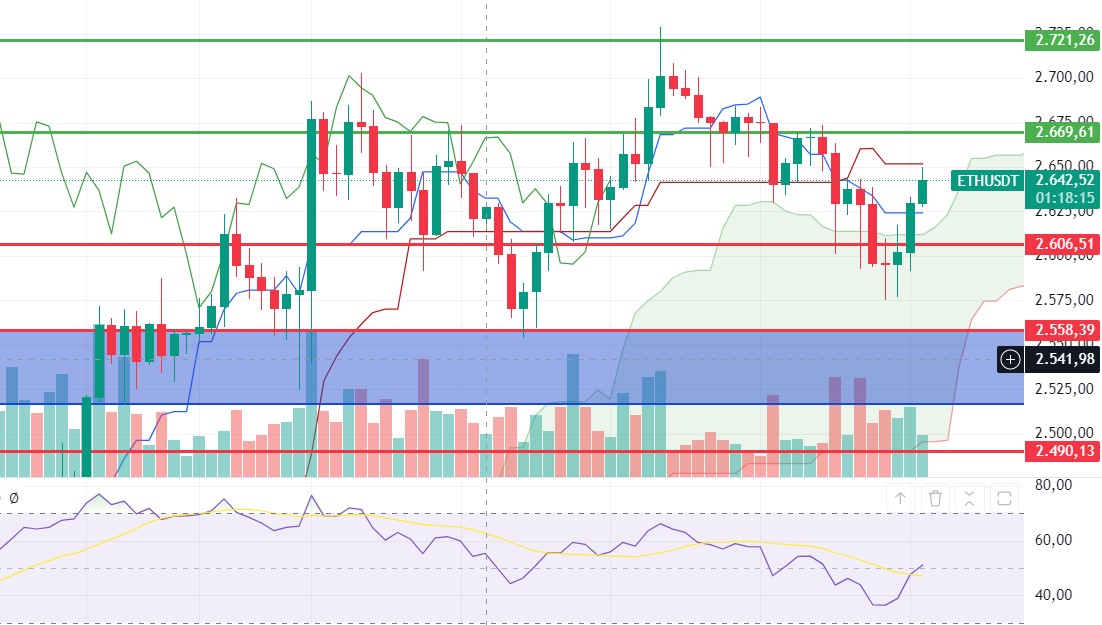
Ethereum, which rebounded rapidly after yesterday’s decline, is close to the kijun level. RSI, CMF and OBV have become positive. Momentum supports price action. For this reason, rises up to 2,669 seem possible. However, the most important thing to be aware of seems to be the reaction from this level. Failure to break this level and turning down with a reaction brings an OBO structure on the chart. This may bring a sharp decline.
Supports 2,606 – 2,558 – 2,490
Resistances 2,669 – 2,721 – 2,815
LINK/USDT
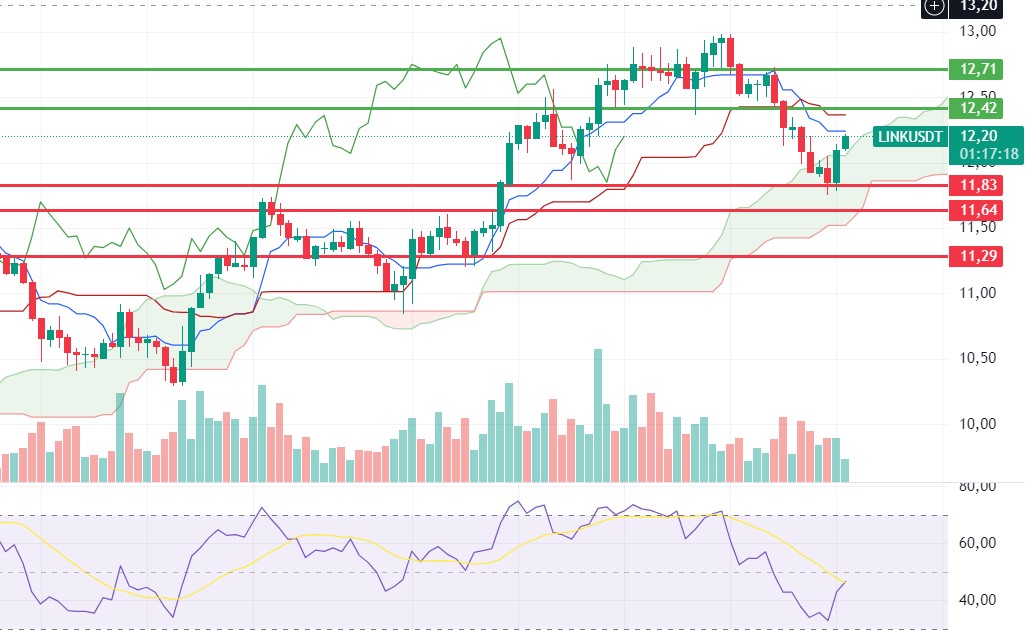
At 11.83, the positive trend seems to have started for LINK, which ended its decline with a reaction. Re-emerging out of the Kumo cloud, positive outlooks in RSI and CMF may bring rises up to 12.42. However, similar to Etherum, the reaction here seems critical. The voluminous break of the level may bring the continuation of the rise. However, if it turns down with a reaction, it may draw an OBO image and bring sharp declines.
Supports 11.83 – 11.64 – 11.29
Resistances 12.42 – 12.71 – 13.46
SOL/USDT
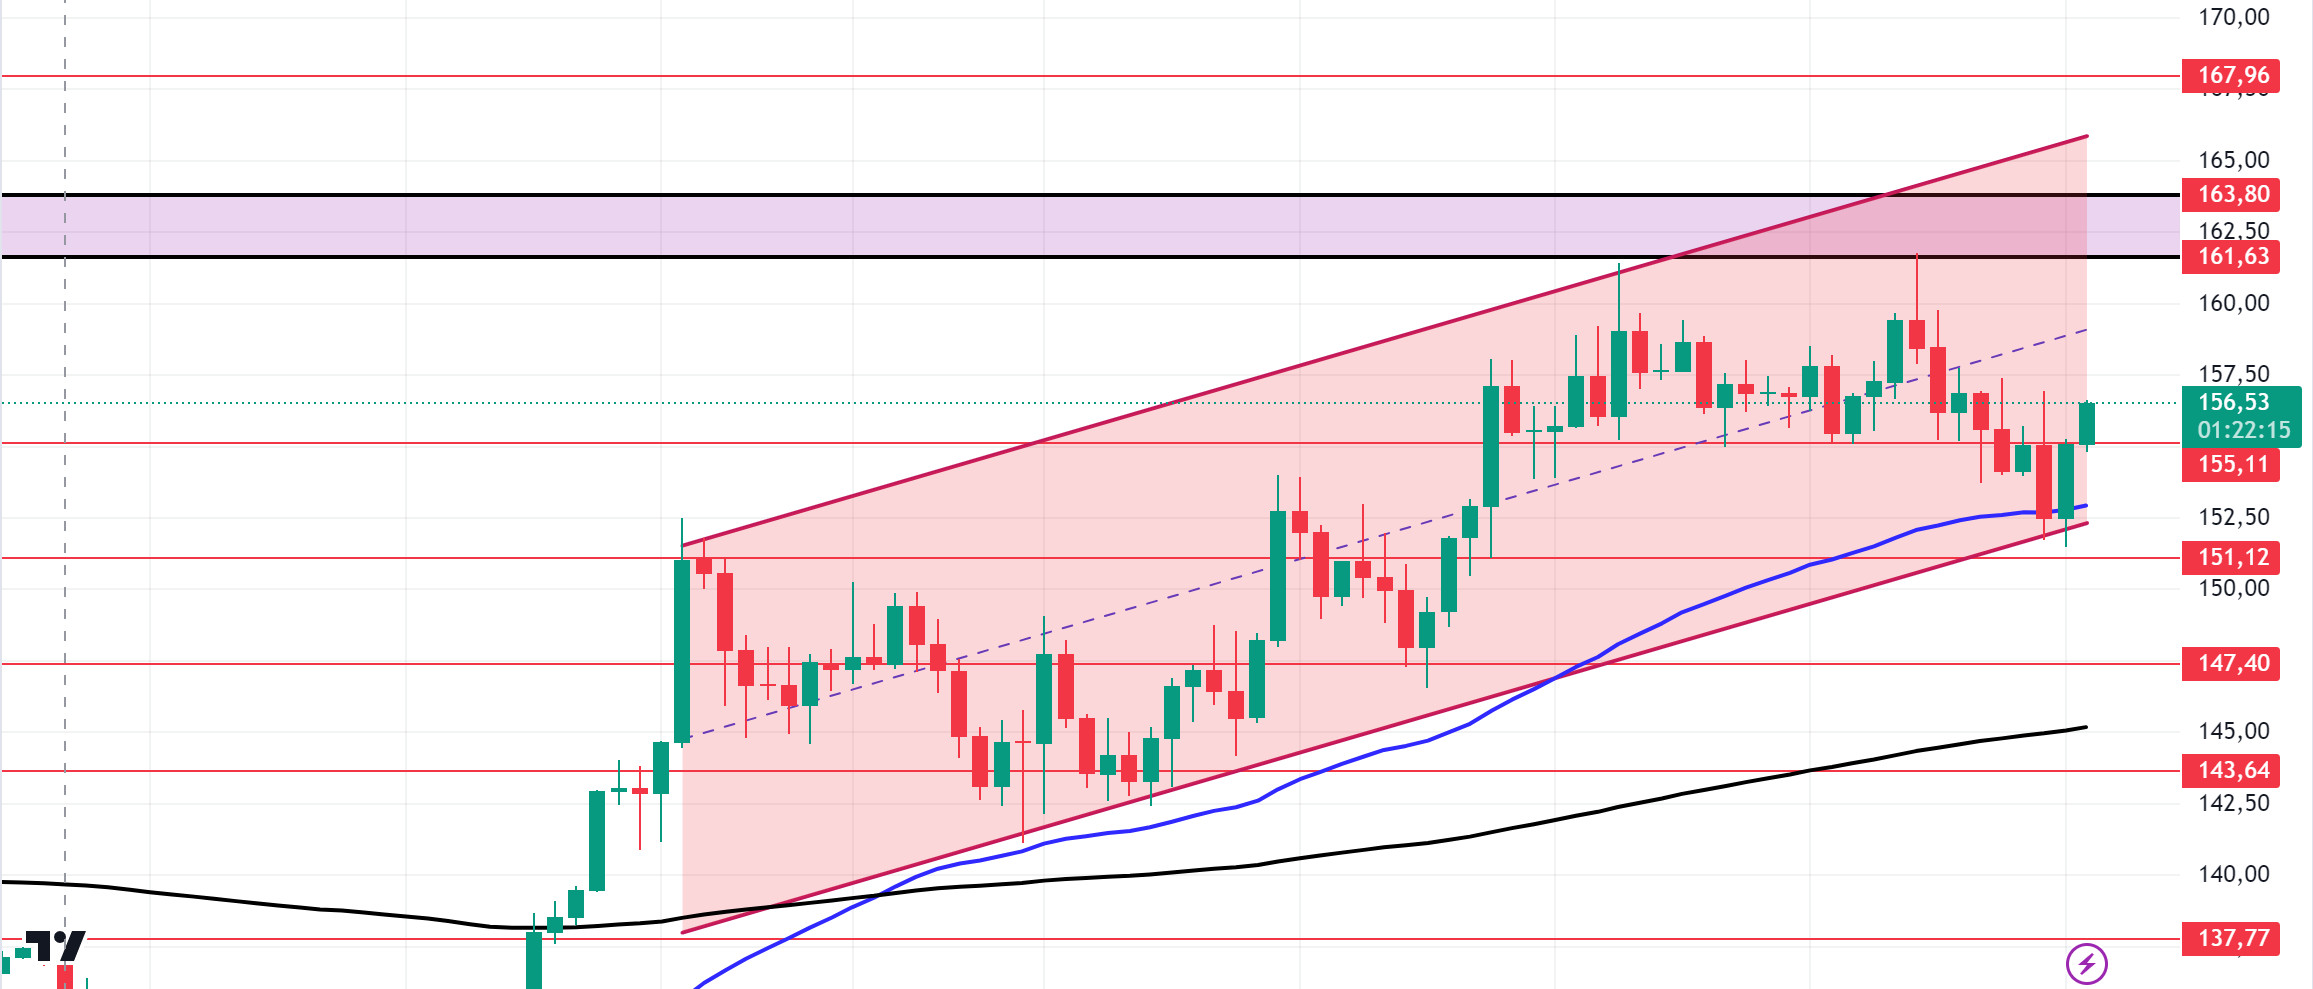
Fed Chair Powell: “The Fed is not in a hurry to cut interest rates and will act according to the data. If the economy develops as expected, there will be two more rate cuts of 25 basis points this year.” After this statement, according to data from CME, the expectation of a 25 basis point rate cut rose to 61.8%. This caused a pullback in cryptocurrencies. In the Solana ecosystem, when we look at the futures data from Coinglass, there is an increase in open interest data. The fact that funding rates are also positive says that investors are acting with bullish expectations. When we look technically, SOL rose from the support of the 50 EMA and the rising channel on the 4-hour chart. Rising 3.29% from this level, SOL rises due to both macroeconomic conditions and innovations in the Solana ecosystem, 161.63 – 163.80 levels appear as the first resistance levels. If it rises above these levels, the rise may continue. If investors continue profit sales, support levels of 155.11 – 151.12 should be followed in the retracements. If it comes to these support levels, it may create a potential bullish opportunity.
Supports 155.11 – 151.12 – 147.40
Resistances 161.63 – 163.80 – 167.96
ADA/USDT
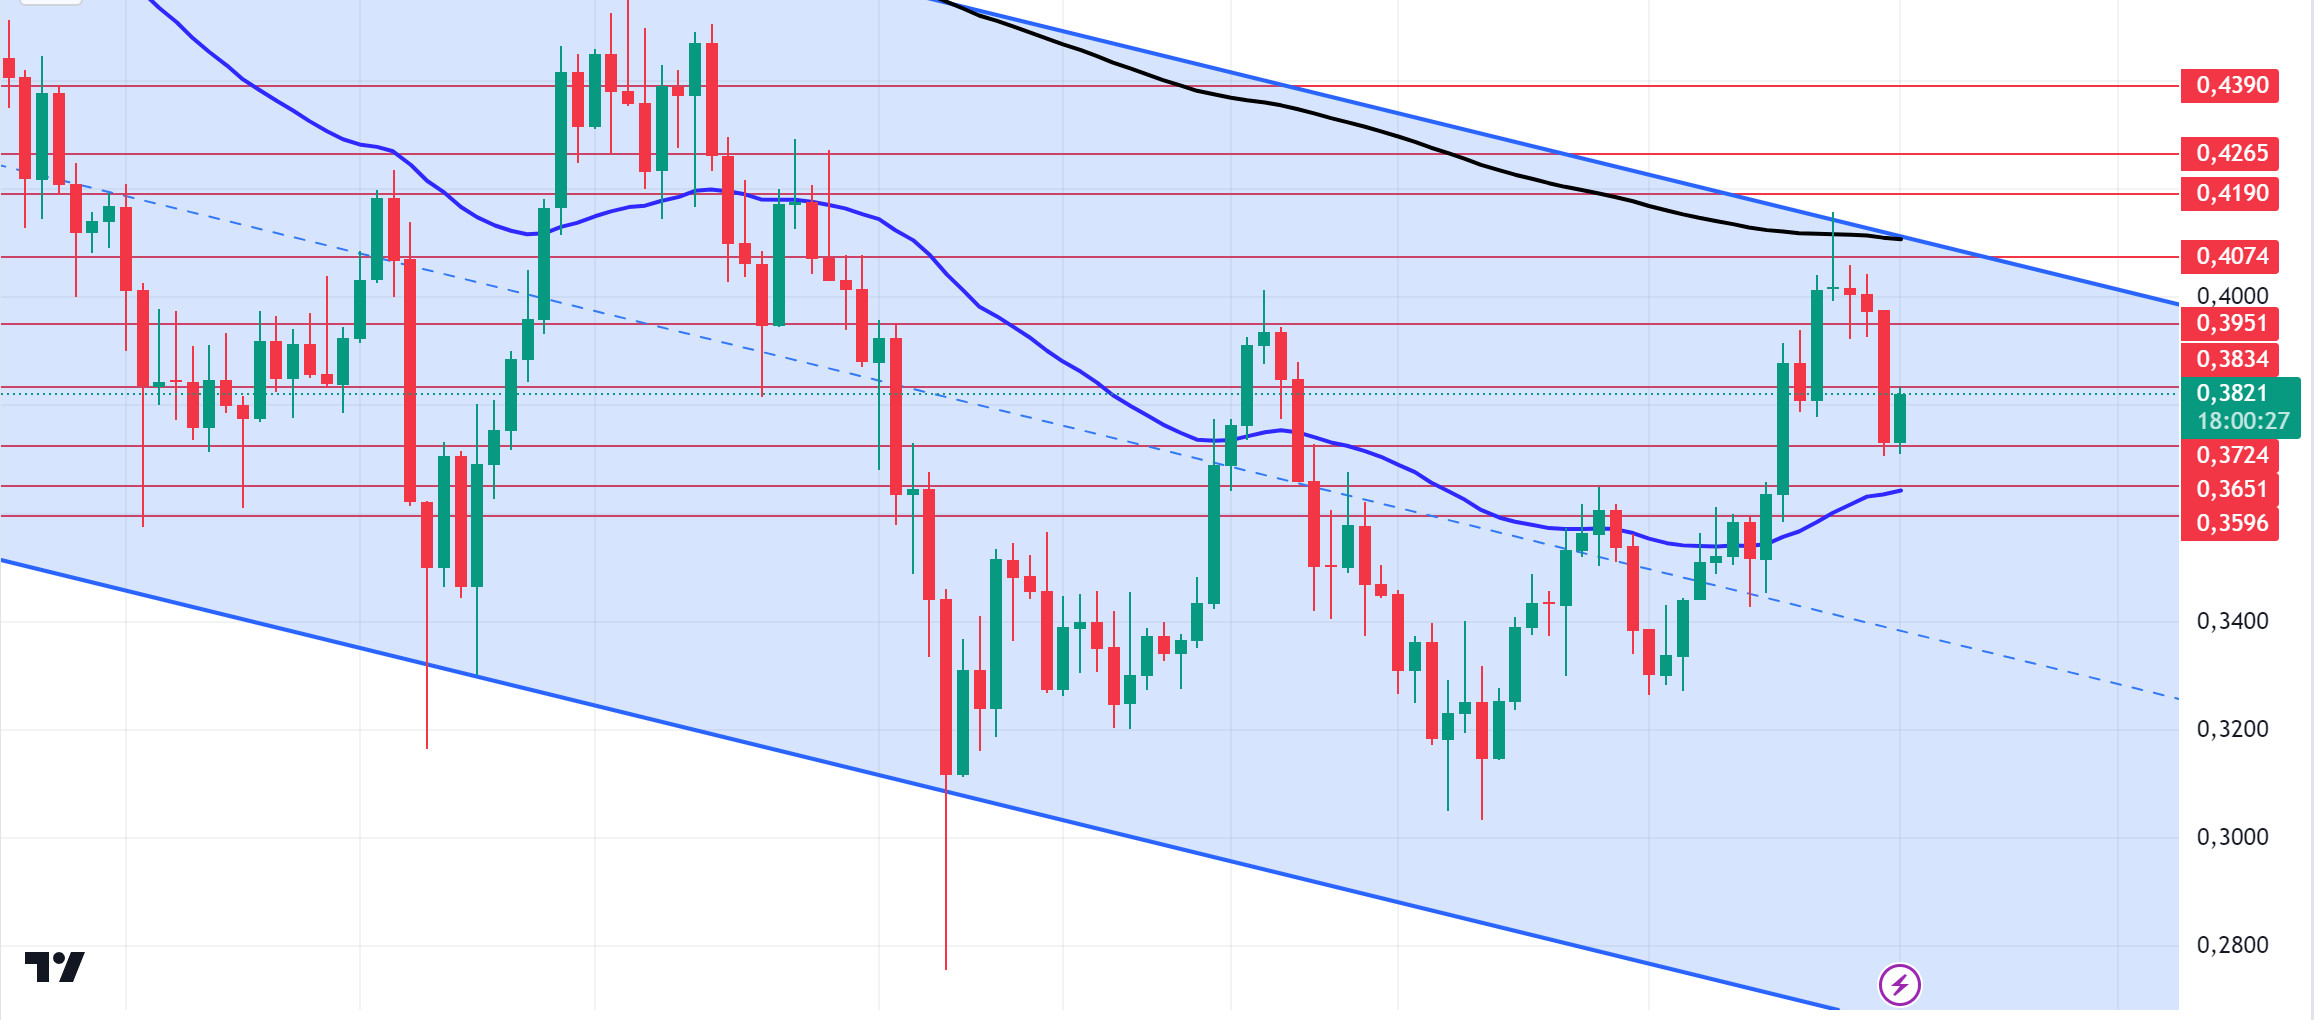
Fed Chair Powell: “The Fed is not in a hurry to cut interest rates and will act according to the data. If the economy develops as expected, there will be two more rate cuts of 25 basis points this year.” After this statement, according to data from CME, the expectation of a 25 basis point rate cut rose to 61.8%. This caused withdrawals in cryptocurrencies. In the Cardano ecosystem, the liquidation map from Coinglass shows that short positions are much higher than long positions. With 9.16 million short positions and 4.35 million long positions, the ADA price may succumb to sellers’ pressure until it reaches a strong support zone. Most of the short positions are located between $0.3880 and $0.4000, making it difficult for ADA to break through this range. From a technical point of view, it is priced at 0.3834 resistance, accompanying the slight retreat of the general market. On the other hand, it tested the resistance of the downtrend that has been going on since April 22. When we examine it on the daily chart, the fact that the 200 EMA is at the resistance point of the falling channel shows us that there is a very strong resistance place here. This could deepen the decline. At the same time, on our daily chart, the 50 EMA seems to be support in the lower region. ADA, which last saw these levels on August 26th, is a strong support at the level of 0.3651 in retracements due to possible profit sales. In the rises that will take place with the continuation of macro-economic data or the positive atmosphere in the ecosystem, the 0.3951 level can be followed as a resistance place.
Supports 0.3724 – 0.3651 – 0.3596
Resistances 0.3834 – 3951 – 0.4074
AVAX/USDT
AVAX, which opened yesterday at 29.04, fell by about 4.5% during the day and closed the day at 27.71. Today, US manufacturing purchasing managers index, manufacturing purchasing managers index and job openings and staff turnover rates data will be announced. These data are important for the market and may be perceived positively by the market if they are within expectations. Especially if the job opportunities and personnel change rate data is much higher than expected, it may be perceived negatively by the market as it will be effective in the FED interest rate cut decision.
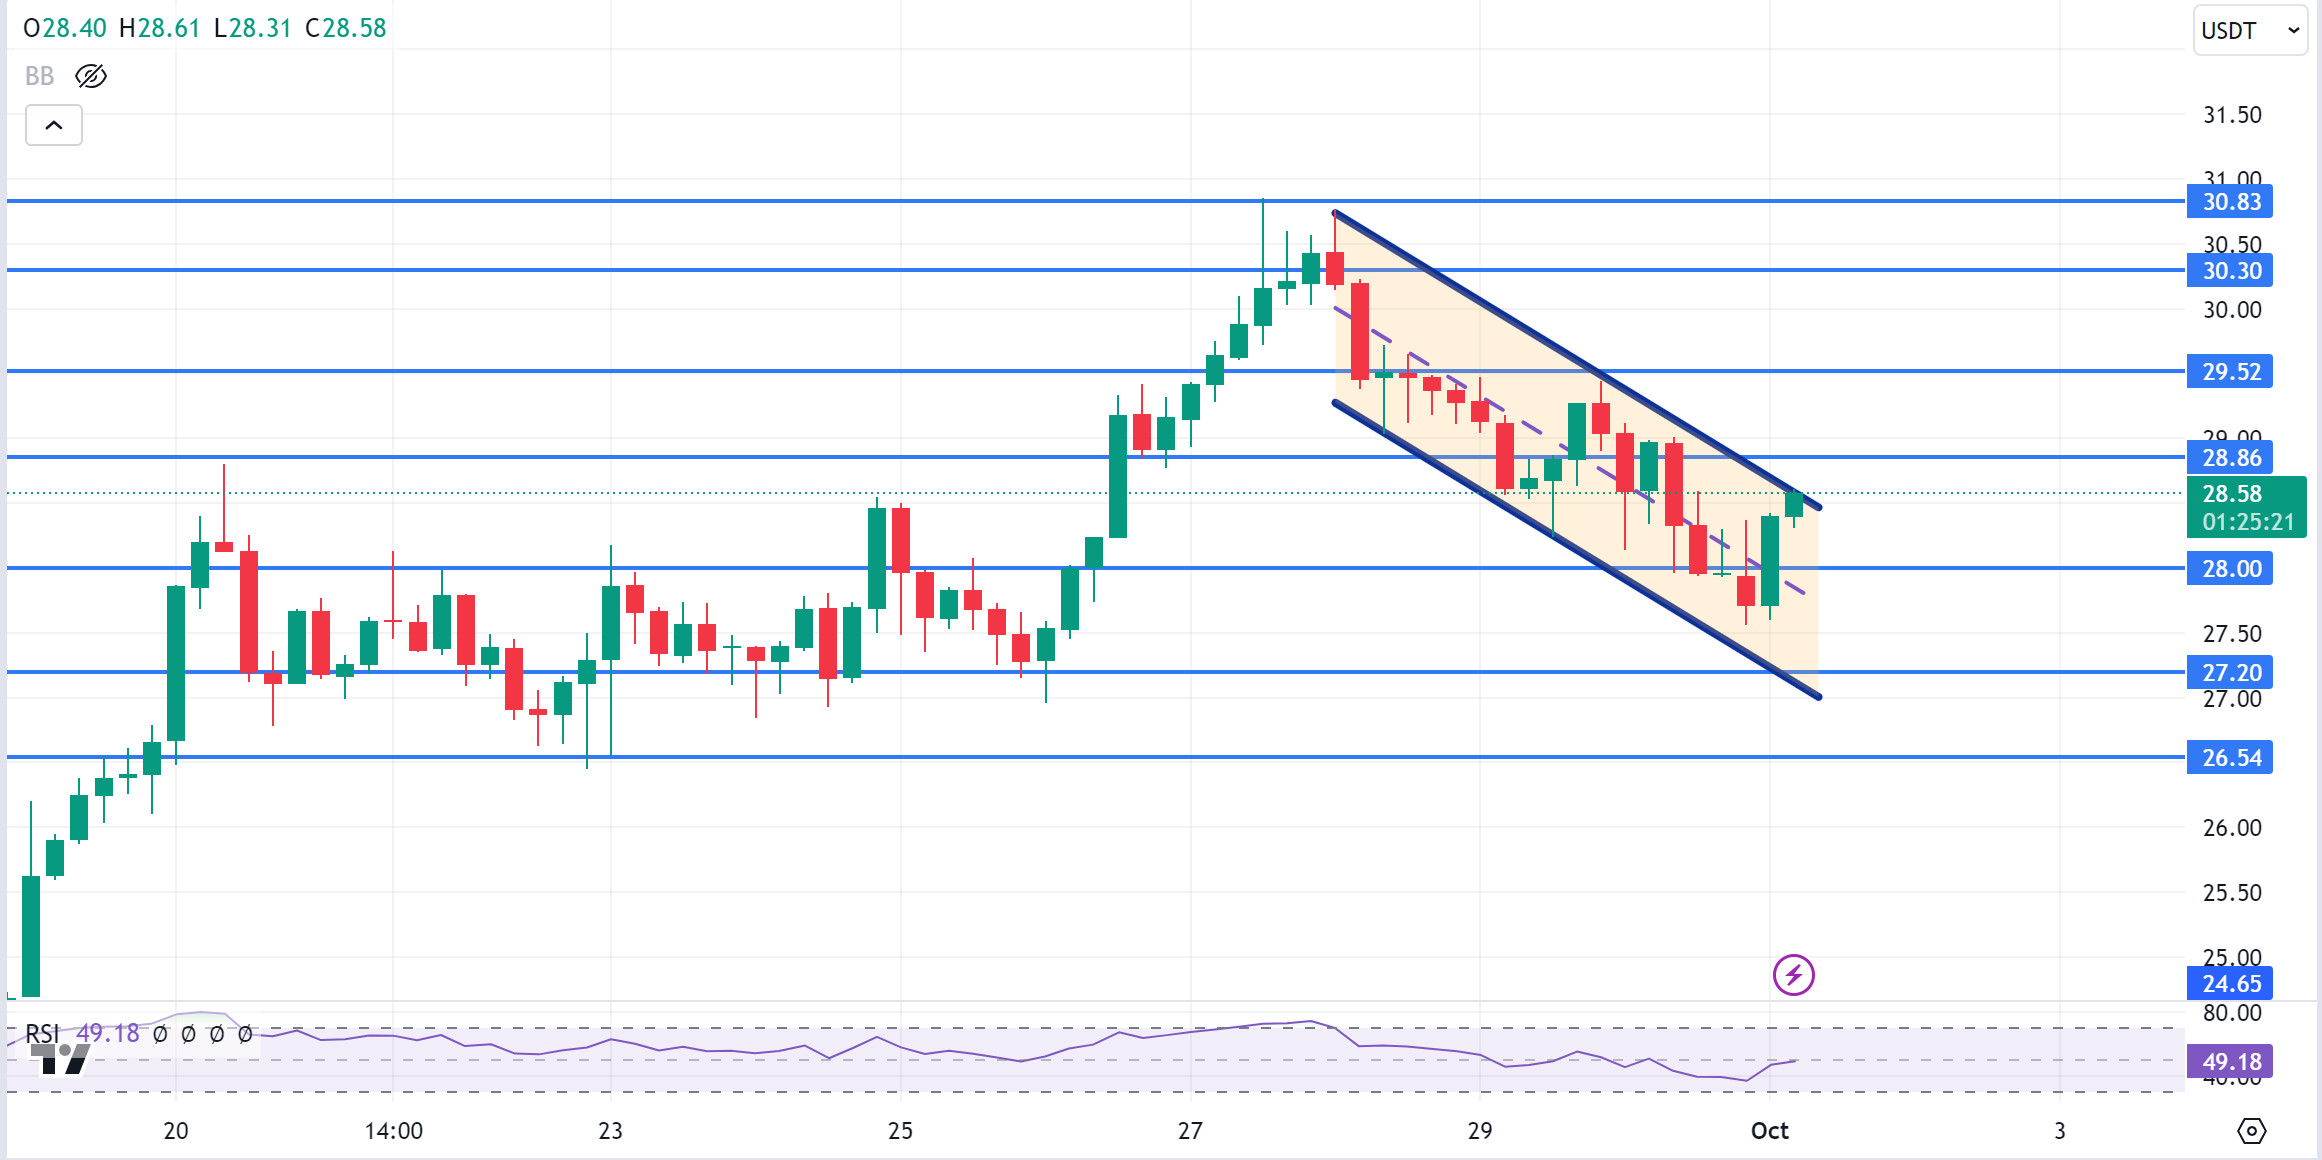
AVAX, currently trading at 28.58, is moving in a falling channel on the 4-hour chart. The RSI is in the upper band of the falling channel with a value of 49 and may want to go to the middle band by making some decline from these levels. In such a case, it can be expected to test 28.00 support. Below 28.00 support, it cannot close the candle and if a buying reaction comes, it may try to break the upper band of the channel. In such a case, it may test 28.86 resistance. As long as it stays above 24.65 support during the day, the desire to rise may continue. With the break of 24.65 support, sales may increase.
Supports 28.00 – 27.20 – 26.54
Resistances 28.86 – 29.52 – 30.30
TRX/USDT
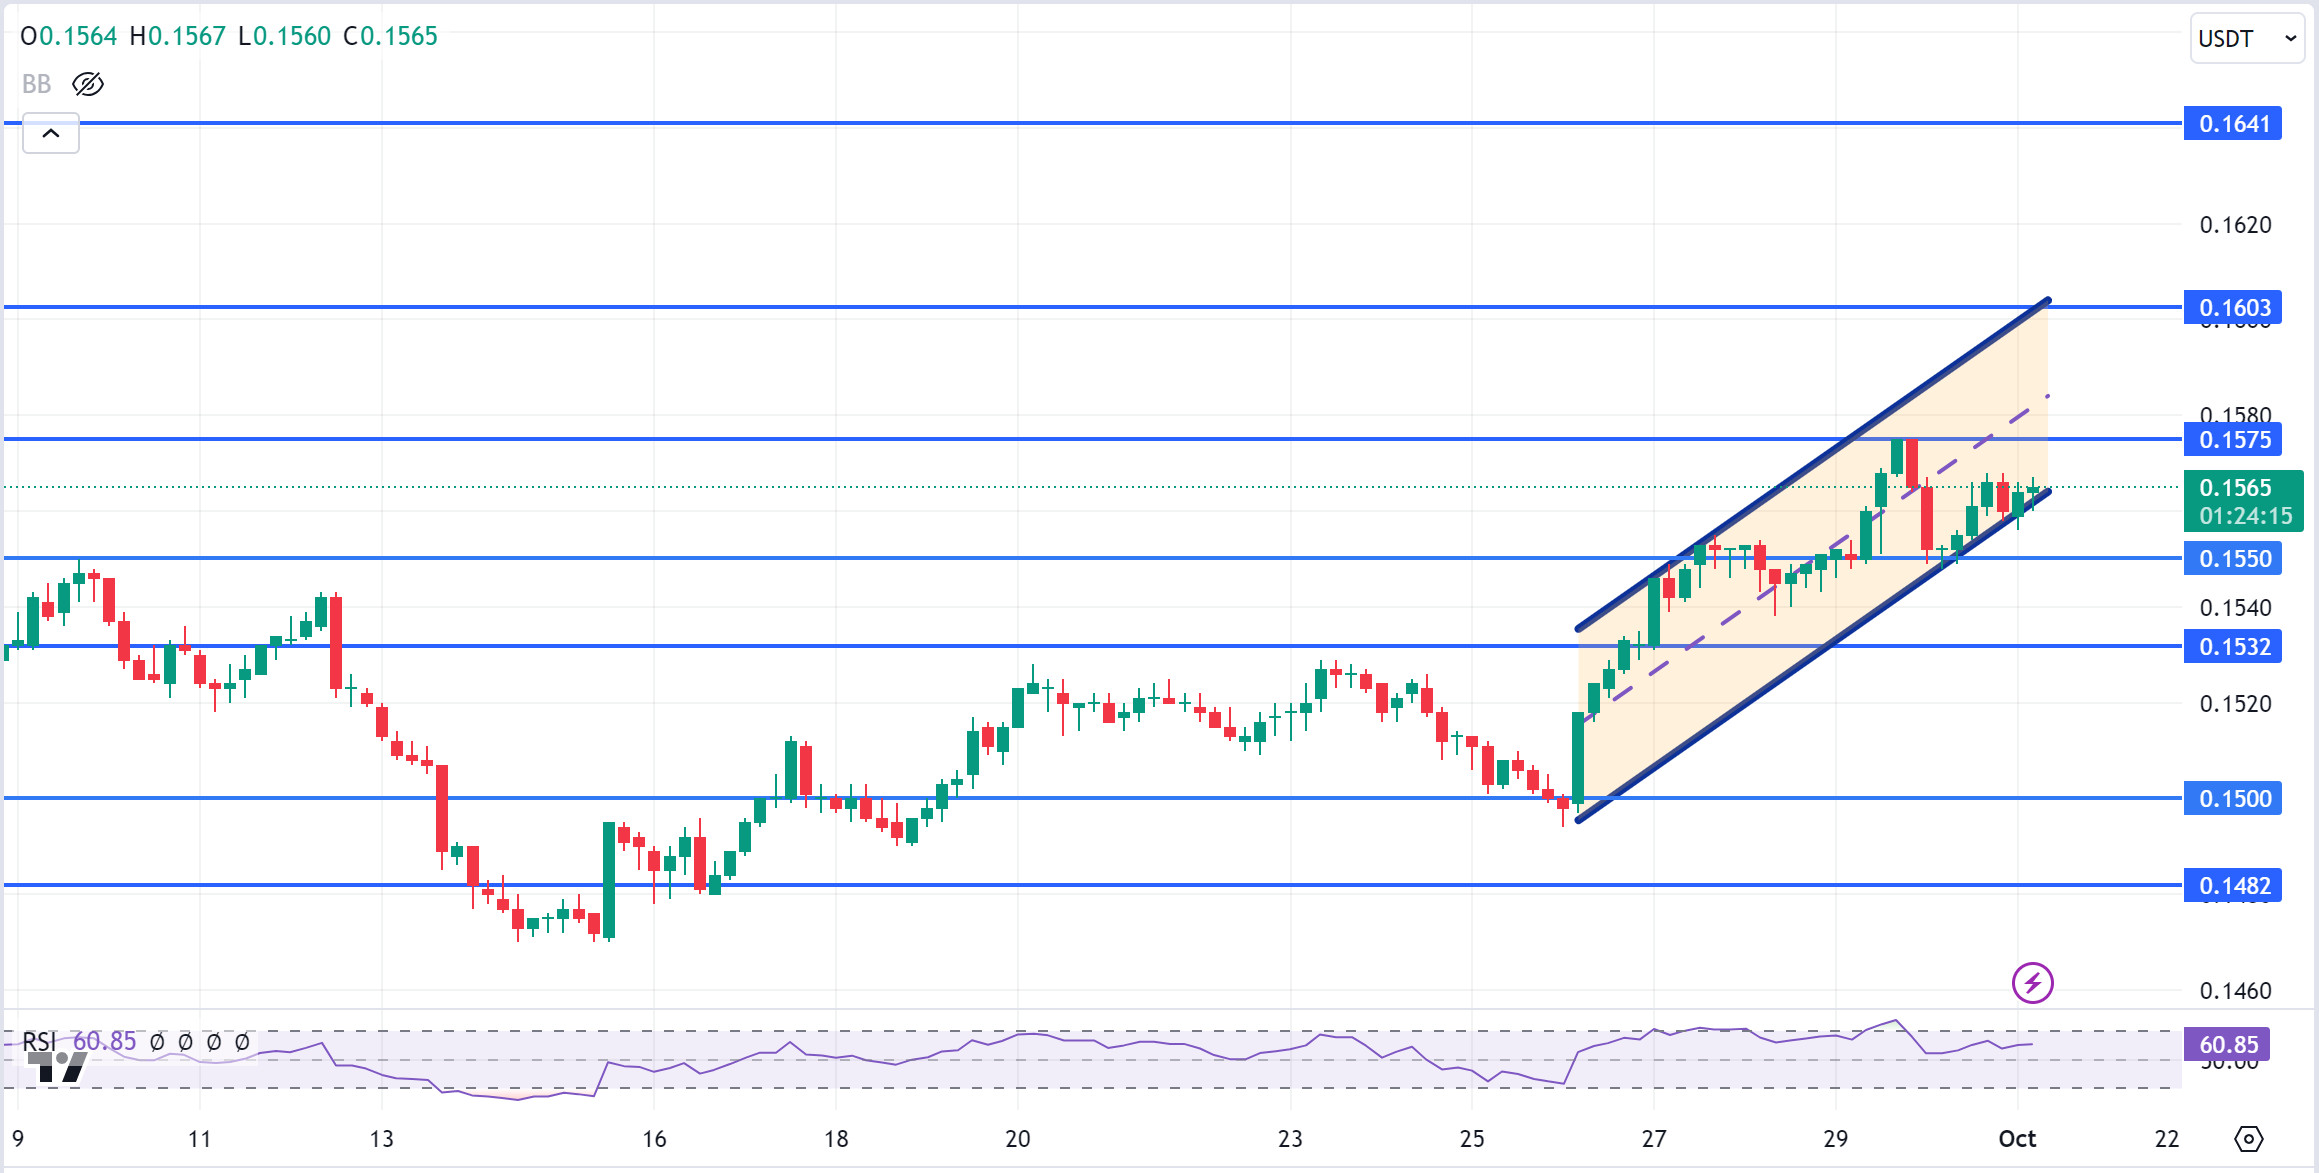
TRX, which started yesterday at 0.1565, fell slightly during the day and closed the day at 0.1560. The manufacturing purchasing managers index, manufacturing purchasing managers index and job openings and staff turnover rates data to be released by the US today are important for the market and volatility may increase during the release of the data. TRX, currently trading at 0.1565, is in the lower band of the rising channel on the 4-hour chart. With the RSI 60 value, it can be expected to move to the middle band of the channel with the buying reaction from the lower band of the channel. In such a case, it may test 0.1575 resistance. If it breaks the lower band of the channel downwards and closes the candle under 0.1550 support, it may test 0.1532 support. TRX may continue to be bullish as long as it stays above 0.1482 support. If this support is broken downwards, sales can be expected to increase.
Supports 0.1559 – 0.1532 – 0.1500
Resistances 0.1575 – 0.1603 – 0.1641
DOT/USDT
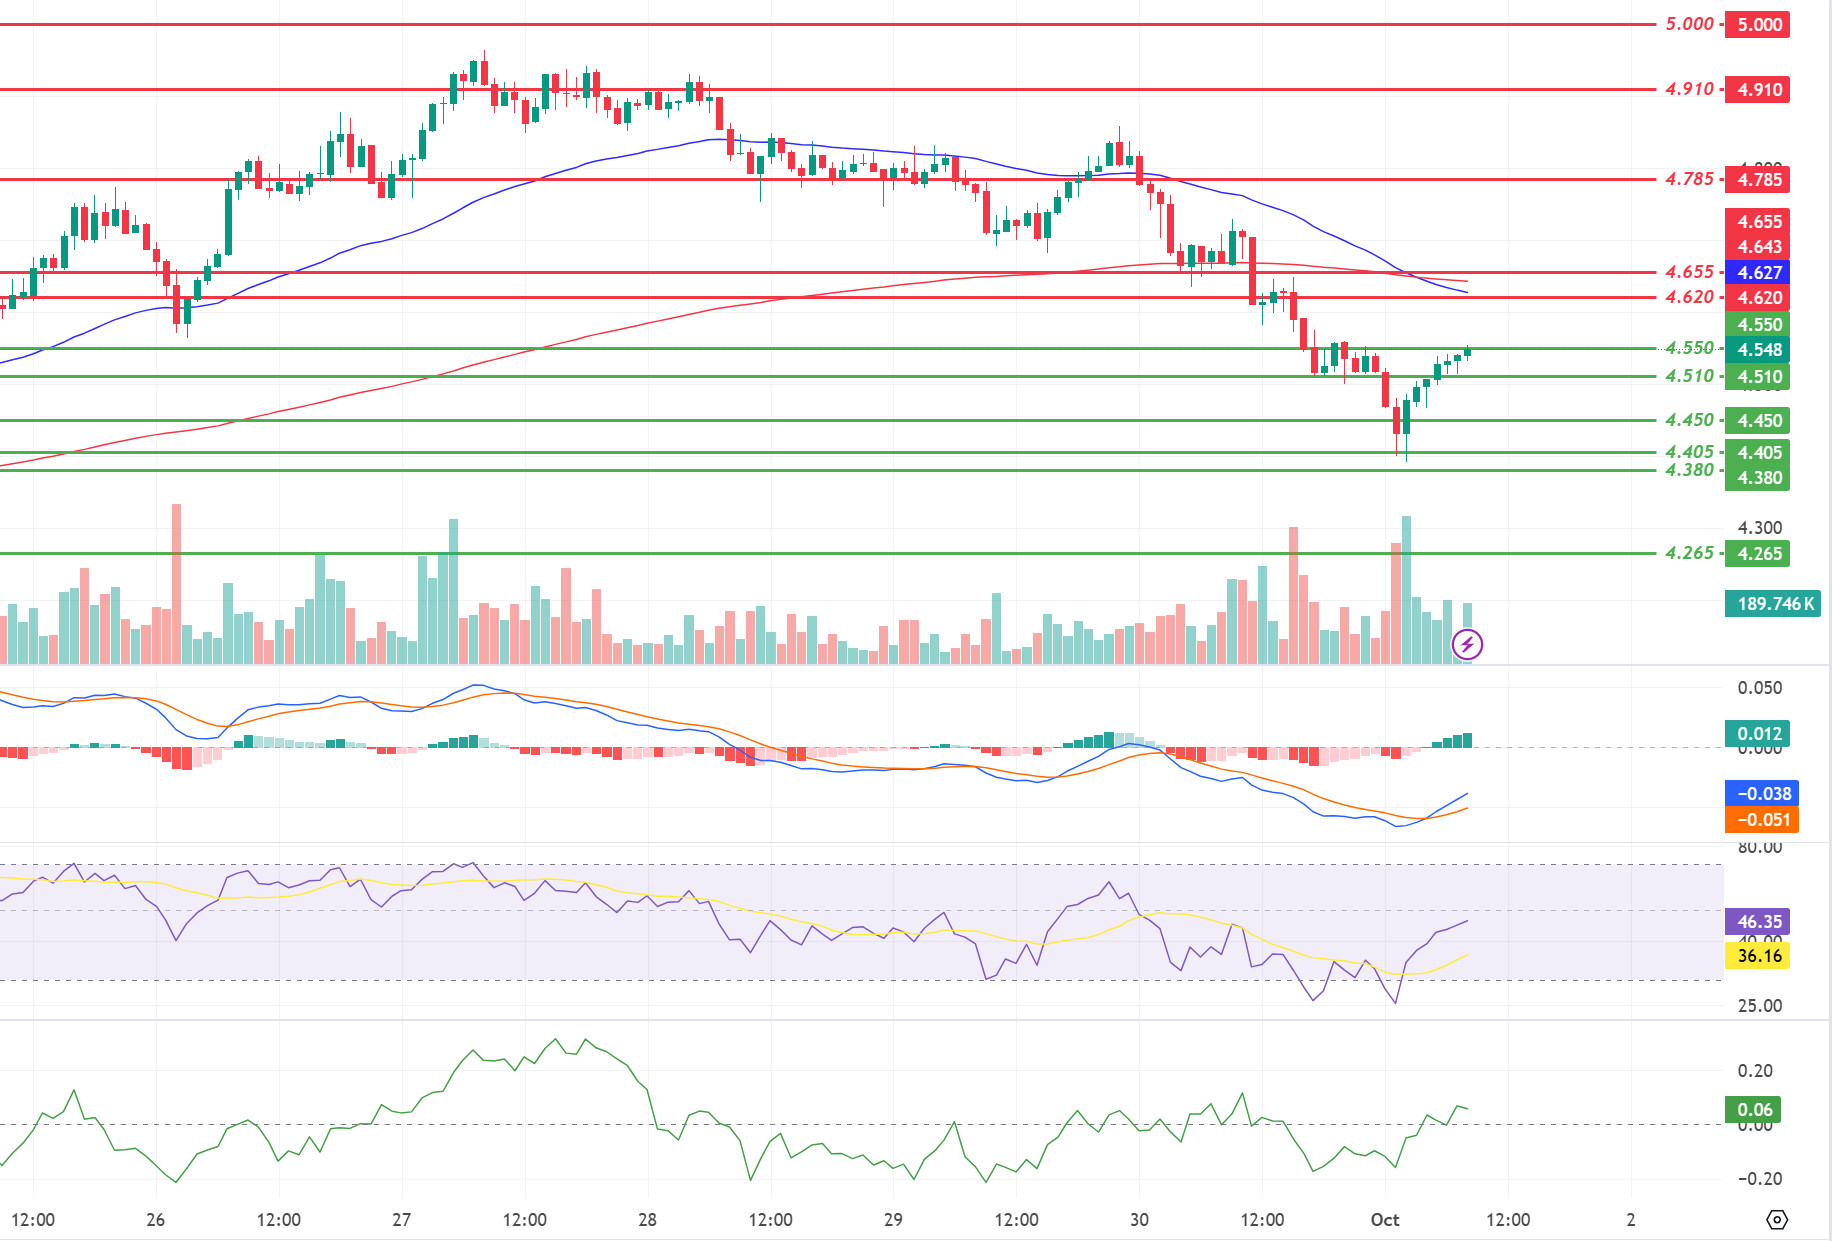
On the Polkadot (DOT) chart, we see that the EMA50 line broke below the EMA200 line (Death Cross). However, the price retreated to 4.450 support levels with increasing selling pressure. With the reaction from 4.450 levels, the price reached the 4.550 bands again. When we examine the CMF and MACD oscillator, we can say that the buyer pressure is strong. If the price stays above the 4.550 level, the next target may be 4.620 levels. On the other hand, the price may want to correct this rise with the reaction it received from the 4,450 levels. If the 4,550 level is lost, 4,510 levels may be the first support levels.
(Blue line: EMA50, Red line: EMA200)
Supports 4,620 – 4,555 – 4,510
Resistances 4.655 – 4.785 – 4.910
SHIB/USDT
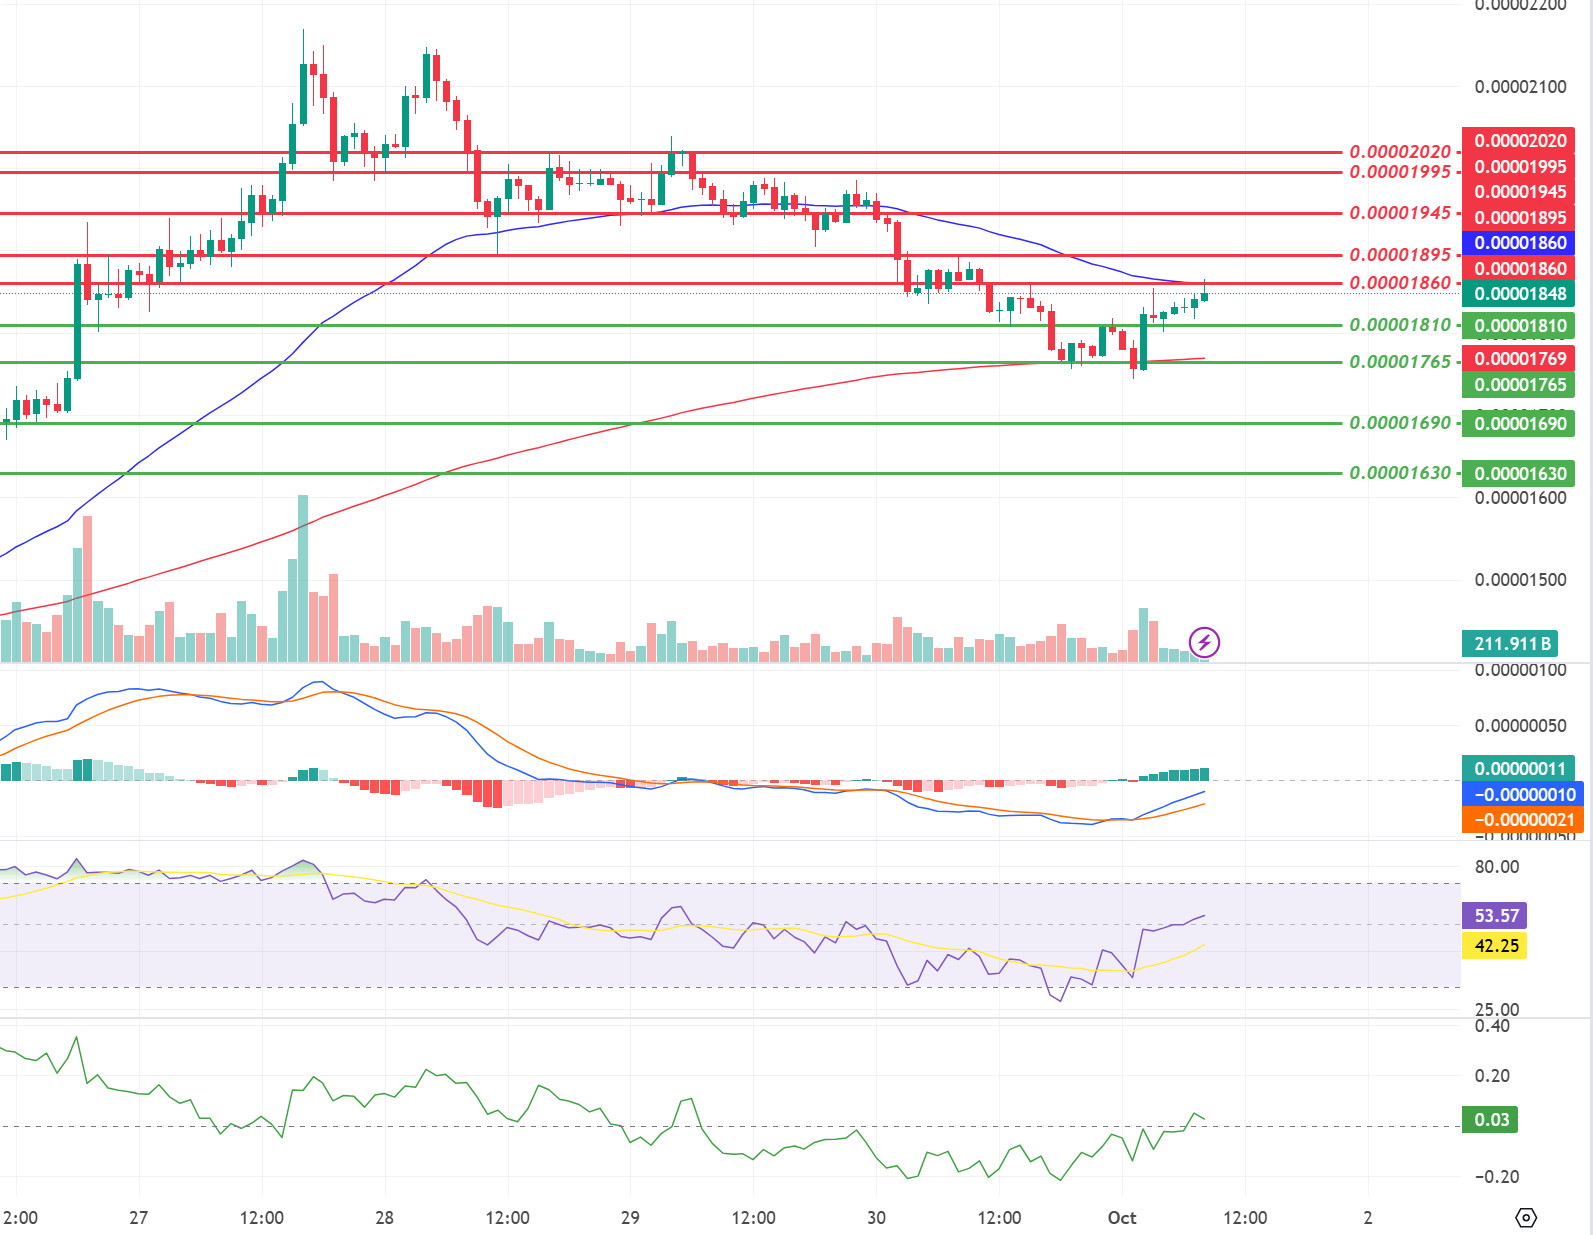
To enhance data privacy, Shiba Inu is partnering with Zama to integrate Fully Homomorphic Encryption (FHE) technology into its Shibarium layer-2 solution. This technology ensures that sensitive data remains private when using transactions and smart contracts. Although SHIB’s price has fallen by 6% in the last 24 hours, the community believes that this partnership could positively impact the price in the long run. When we examine the chart of Shiba Inu (SHIB), we see that it reacted from the EMA200 level. Currently, the price is at the EMA50 level. When we examine the CMF and MACD oscillators, we can say that the buyer pressure is strong. If the price is permanent above the EMA50, its first target may be 0.00001895 levels. On the other hand, if the price rejects from the EMA50 level, the first support levels that the price may react to may be 0.00001810 levels.
(Blue line: EMA50, Red line: EMA200)
Supports 0.00001810 – 0.00001765 – 0.00001690
Resistances 0.00001860 – 0.00001895 – 0.00001945
LEGAL NOTICE
The investment information, comments and recommendations contained herein do not constitute investment advice. Investment advisory services are provided individually by authorized institutions taking into account the risk and return preferences of individuals. The comments and recommendations contained herein are of a general nature. These recommendations may not be suitable for your financial situation and risk and return preferences. Therefore, making an investment decision based solely on the information contained herein may not produce results in line with your expectations.


