
MARKET SUMMARY
Latest Situation in Crypto Assets
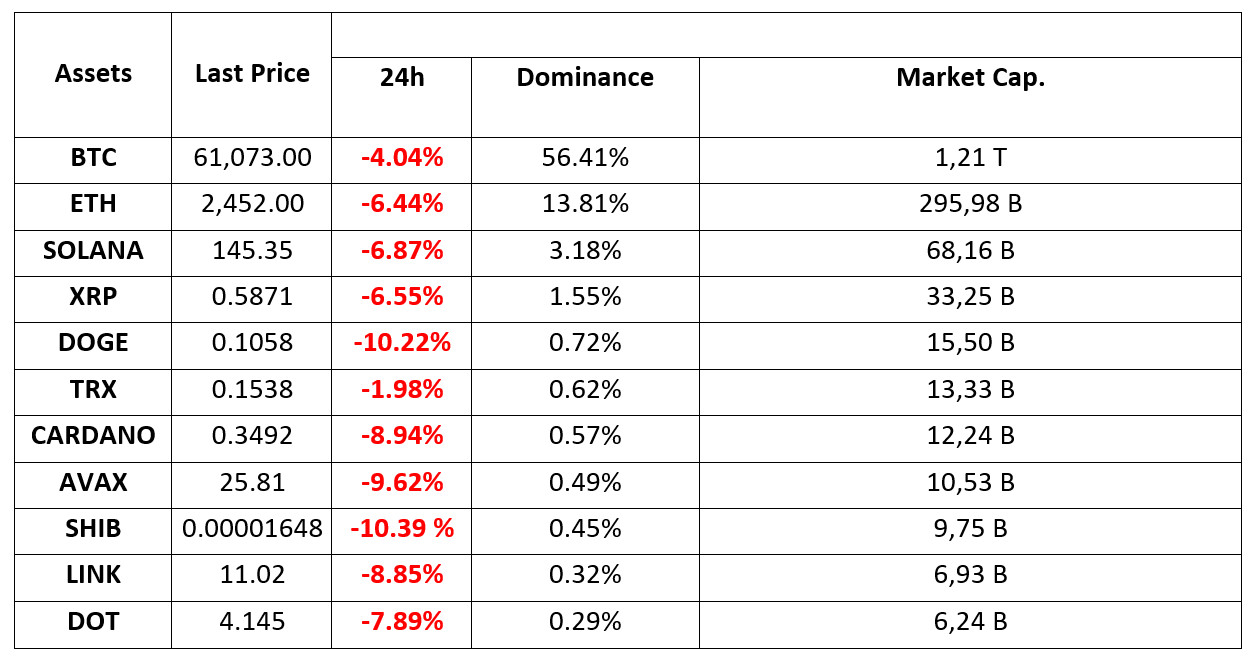
*Prepared on 2.10.2024 at 14:00 (UTC)
WHAT’S LEFT BEHIND
Big Exits in Bitcoin and Ethereum ETFs
Bitcoin and Ethereum ETFs continue to attract investors’ attention in recent days. As of October 02, 2024, Bitcoin ETFs saw a total net outflow of $242.6 million. This reveals the impact of fluctuations in the cryptocurrency market. Ethereum ETFs saw a net outflow of $48.6 million.
Geopolitical events liquidate $550 million crypto position
Iran’s missile attack on Israel last night had a negative impact on crypto prices. A total of 550 million dollars worth of positions were liquidated in futures transactions. Long positions accounted for 480 million dollars of these positions.
US ADP Non-Farm Payrolls (Sep) Announced
Explained: 143K
Forecast 124K
Previous 99K
HIGHLIGHTS OF THE DAY
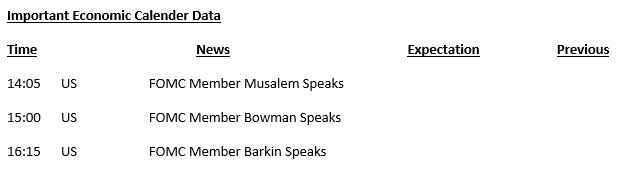
INFORMATION
*The calendar is based on UTC (Coordinated Universal Time) time zone. The economic calendar content on the relevant page is obtained from reliable news and data providers. The news in the economic calendar content, the date and time of the announcement of the news, possible changes in the previous, expectations and announced figures are made by the data provider institutions. Darkex cannot be held responsible for possible changes that may arise from similar situations.
MARKET COMPASS
Global markets turned their attention to geopolitical risks. Following Iran’s missile attack yesterday, risk appetite has decreased and demand for financial assets considered to be safer has increased. Digital assets were inevitably negatively affected. Cryptocurrencies recovered slightly during Asian trading, but fell again in the hours when European traders were more active. Indices on the old continent are flat to mixed, while US futures are generally slightly negative. The dollar, on the other hand, appreciated globally due to both safe-haven demand and macro indicators.
Iran has fired 200 missiles at Israel, which seems determined to strike back. While there is talk that Israel will launch a military operation before the end of this week, there are concerns that this will escalate tensions in the region and the tension will spread to a wider geography. It seems that the news flow and the degree of tension will continue to determine the prices.
In addition to the central agenda, markets received the ADP private sector employment change data from the US. This indicator, which attracted attention ahead of the critical employment data to be released on Friday, pointed out that the US economy added 143 thousand jobs in non-farm sectors in September. After this indicator, which is thought to reduce the possibility of a rapid interest rate cut by the US Federal Reserve (FED), appreciation in the dollar was seen. This had a negative impact on digital assets.
For the rest of the day, the agenda and news flow regarding the Middle East may continue to be effective on digital assets. The statements of FED officials will also be under the spotlight, but since the hot topic is geopolitical risk, we can say that the more influential headline in prices is the news that may come from the Middle East. In this parallel, we can say that if the recent losses of digital assets are limited, reaction rises may be on the agenda. However, this may be difficult if tensions escalate.
TECHNICAL ANALYSIS
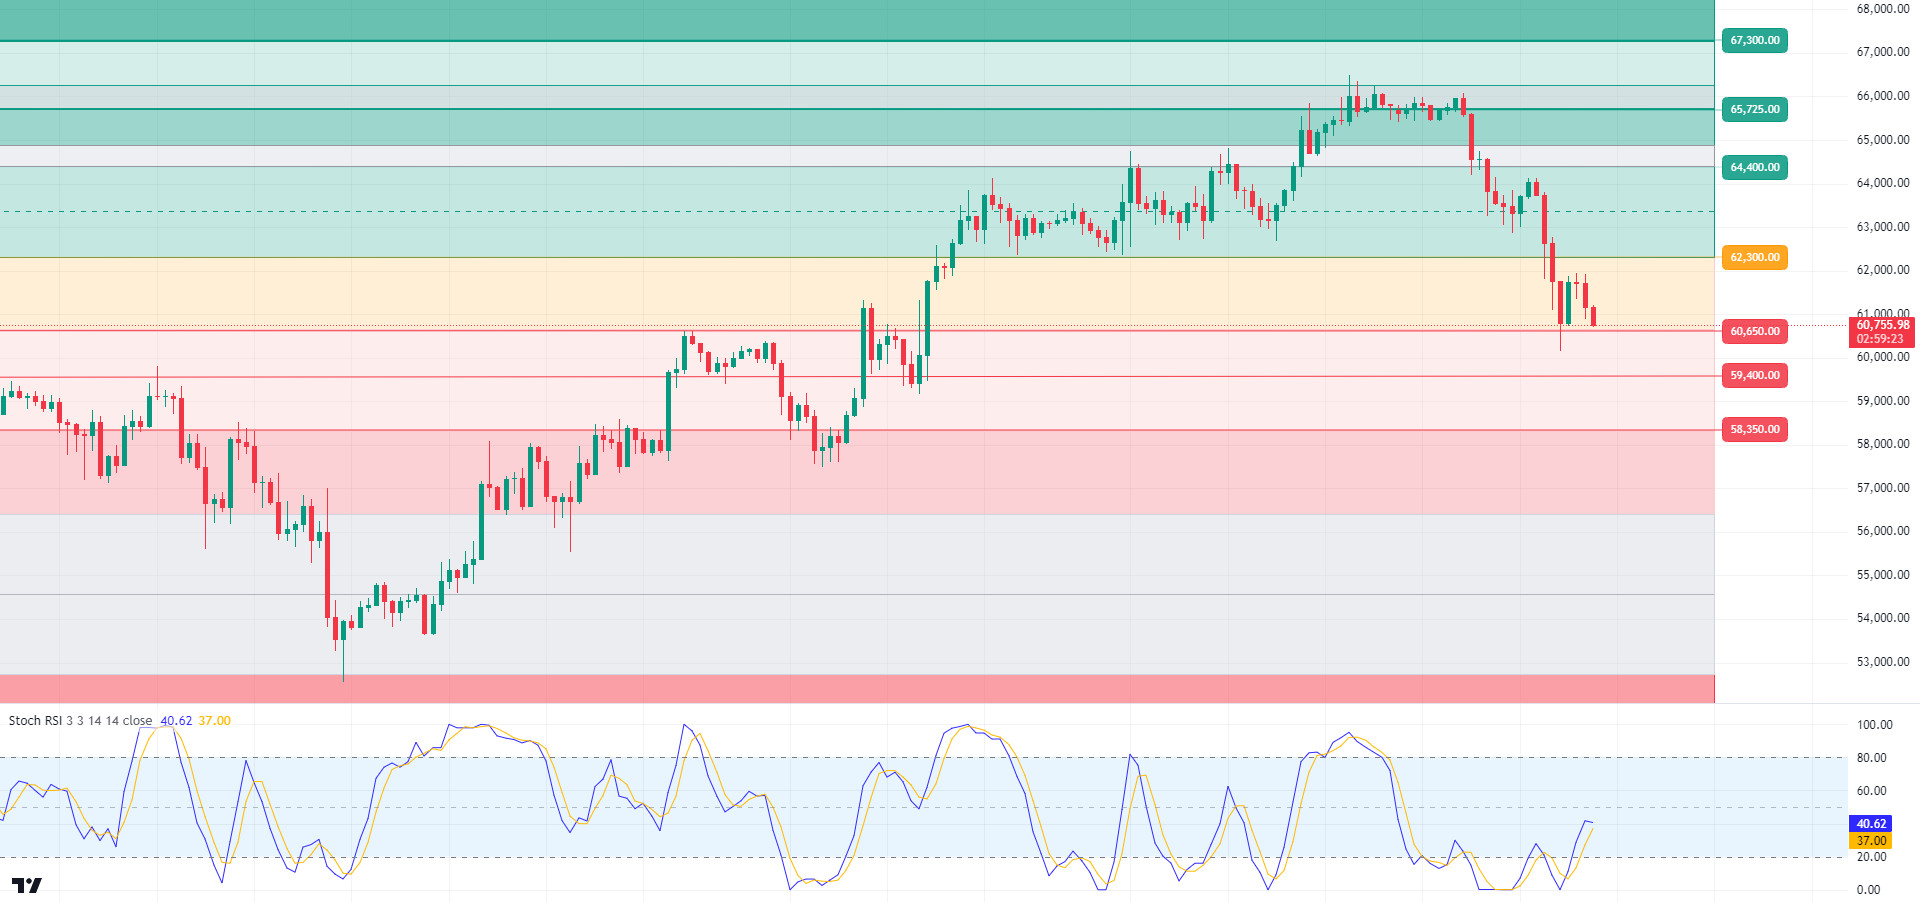
BTC/USDT
The balance sheet of the decline in Bitcoin! Bitcoin, which fell from 64,000 to 60,000 levels with the tension yesterday, liquidated over $ 550 billion and became the loser of the tension in the Middle East. On the ETF side, positive inflows in recent days with the demands of institutional investors came to an end with this tension and Bitcoin ETFs saw a total net outflow of 242.6 million dollars. When we look at the market sentiment, the fact that it switched back to “fear” after a long break shows that investors are turning to safe havens. When we look at the BTC 4-hour technical analysis, we see that unlike yesterday, the volatility of the price decreased and focused on news flow. The direction can be determined with the opening of the US market, which has been correlated for a long time. In the face of positive data, the 62,300 point, which is the resistance level above, stands out. As a matter of fact, RSI has turned its direction upwards in support of this. In the face of escalating tensions in the Middle East and developments that may respond to the attack by Israel, the 60,650 level below is critical.
Supports 64,400 – 62,300 – 60,650
Resistances 65,725 – 67,300 – 68,350
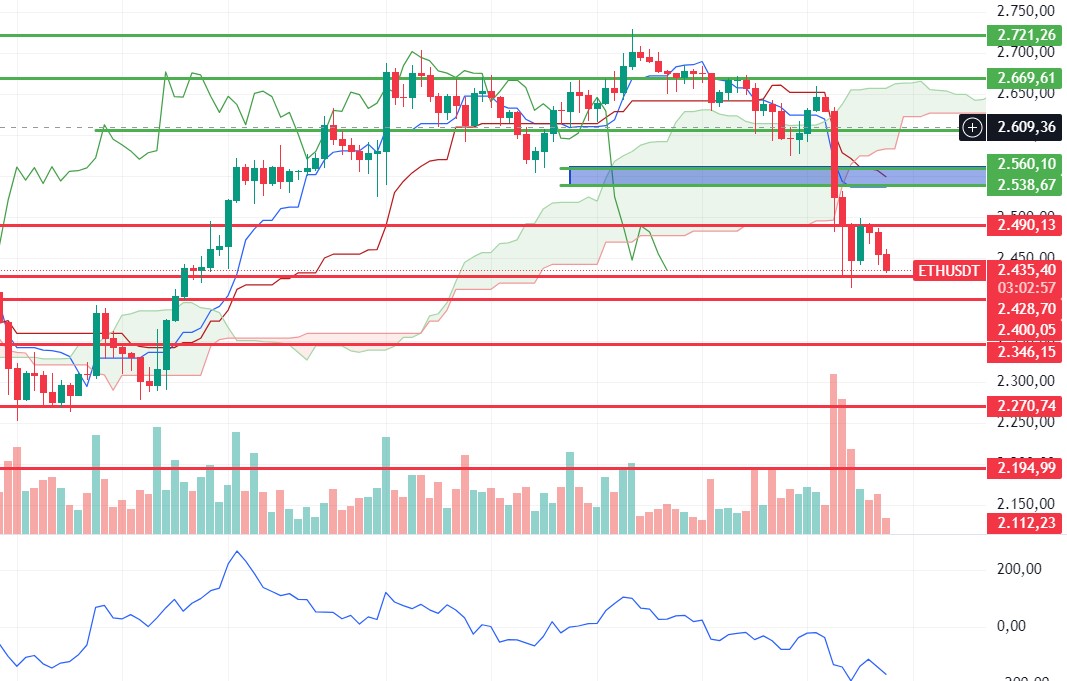
ETH/USDT
Ethereum, which was rejected from 2,490 resistance during the day, is currently trying to hold on to 2,428 support. Although there is a positive structure on the RSI, the negativity in momentum continues. Under these conditions, closures below 2,428 support may cause another pullback to 2,400 levels. A break of 2,490 resistance may bring rapid rises up to the area between kijun and tenkan levels, indicated by the blue box on the chart. It seems important for traders to trade according to breakouts and confirmations.
Supports 2,428 – 2,400 – 2,346
Resistances 2,538 – 2,560 – 2,606
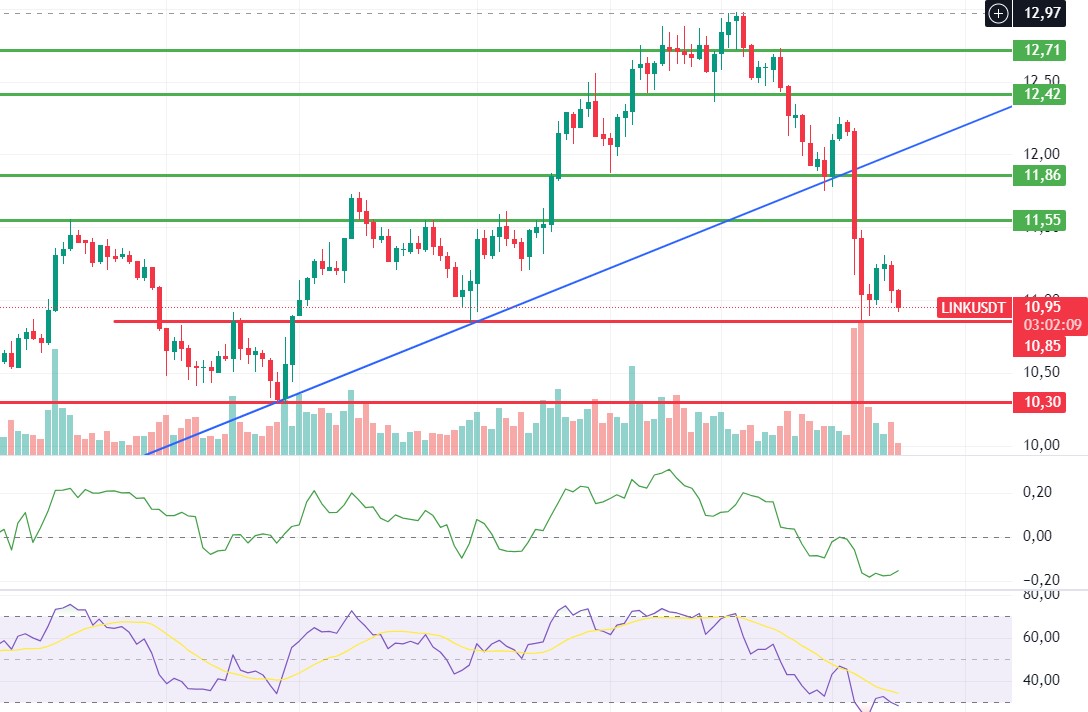
LINK/USDT
Although LINK reacted from the 10.85 level in the last decline and started to rise slightly, it continues its decline towards the support level again. Provided that geopolitical risks do not increase, this level may work strongly again. Momentum and CMF are slightly positive, but RSI has entered the oversold zone again. According to the reaction at 10.85, it can be said that it is important to follow the trend. Loss of the level may bring sharp declines to 10.30 levels. A positive outlook may resume with a break of the 11.55 level.
Supports 10.85 – 10.30 – 9.29
Resistances 11.55 – 11.86 – 12.42
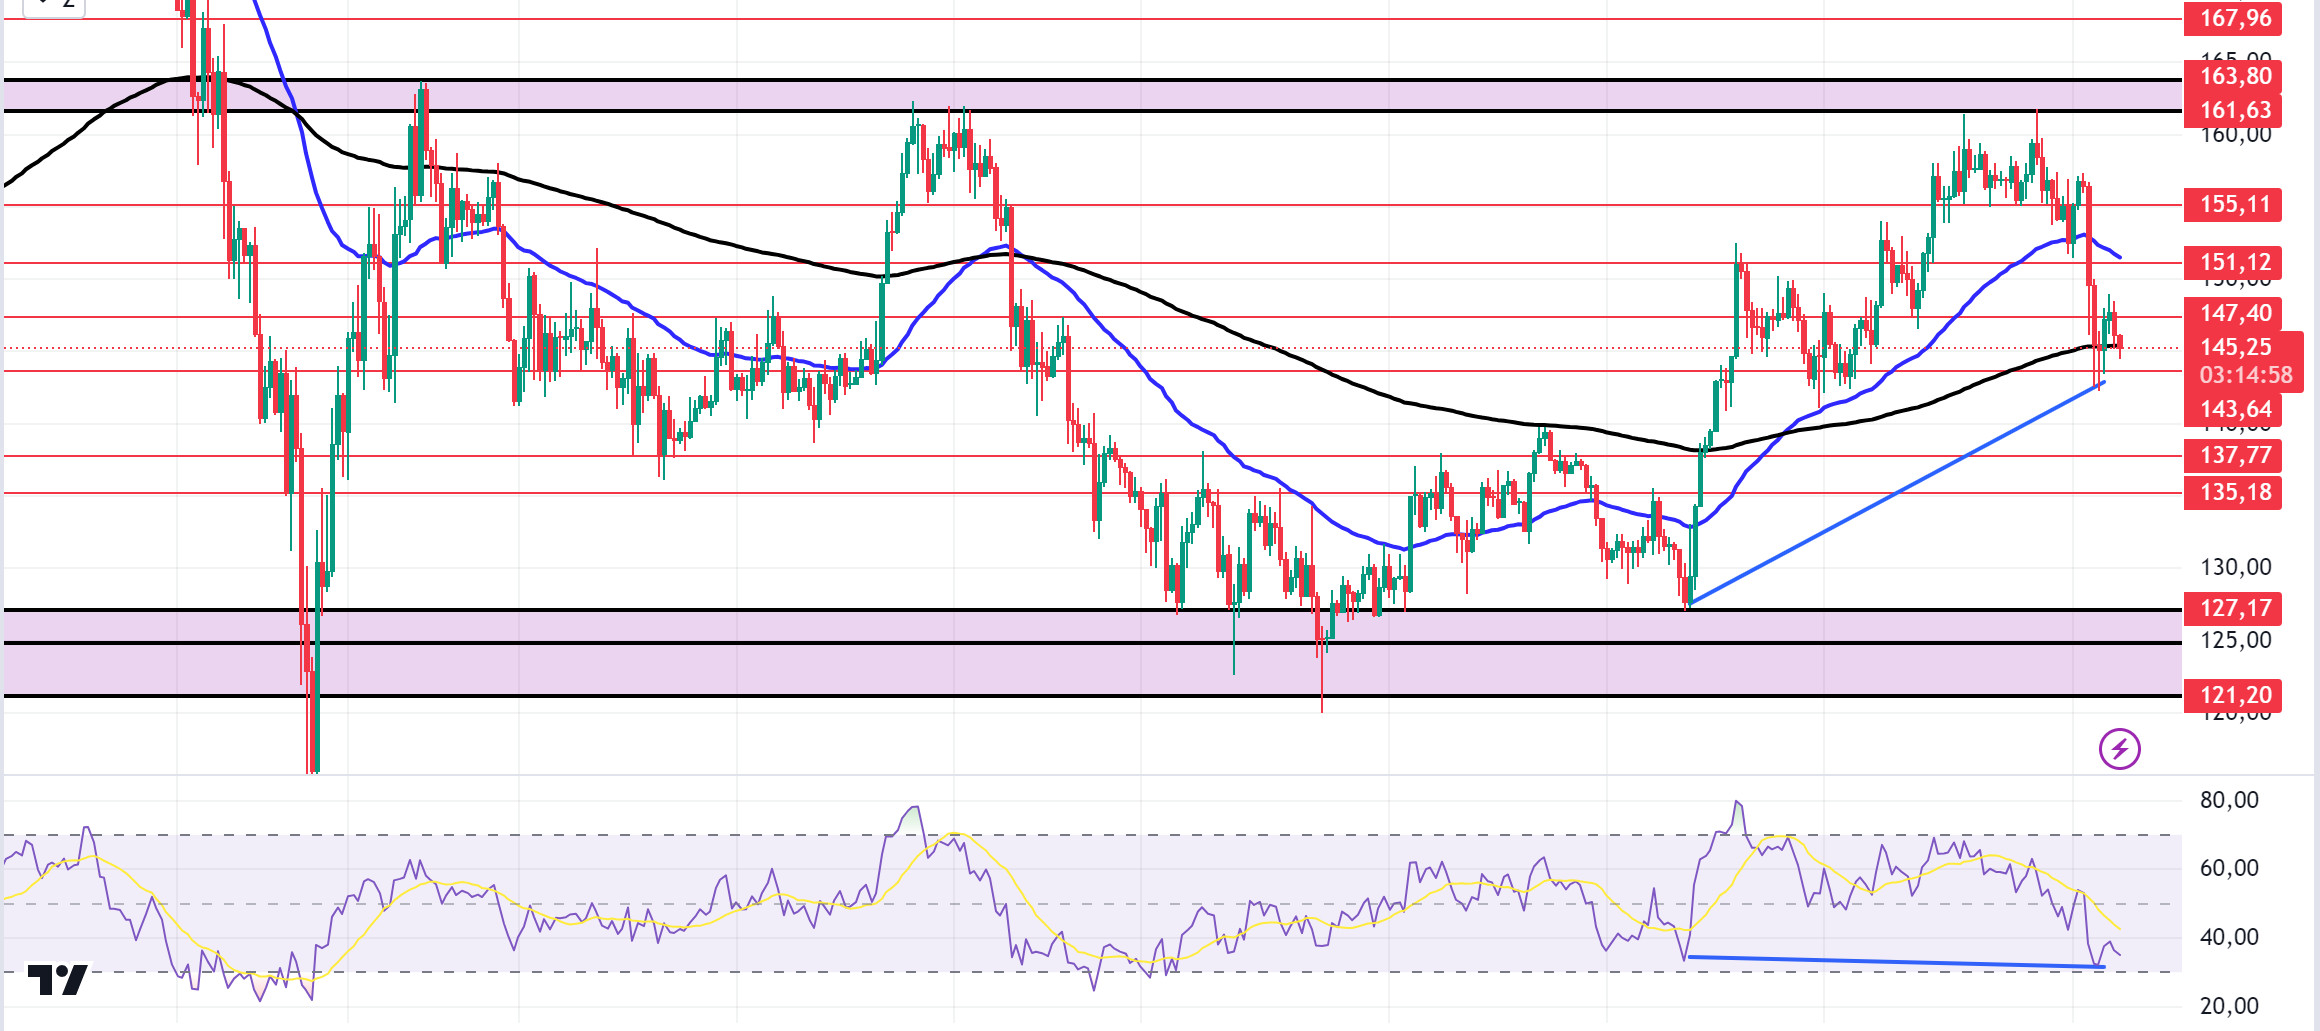
SOL/USDT
The impact of rising tensions in the Middle East continues. The price is struggling to rise. Non-farm employment data from the US increased by 143 thousand in September. The expectation in the markets was expected to be 128 thousand. This did not cause much movement in the markets. Technically, on the 4-hour chart, the price has found support from the 200 EMA. There is a mismatch in the RSI (14). This mismatch in both the fixed average support and the RSI makes the 143.64 level a very strong support. The levels of 151.12 – 155.11 appear as the first resistance levels in the rises due to both macroeconomic conditions and innovations in the Solana ecosystem. If it rises above these levels, the rise may continue. In the sales that investors will make due to political and macroeconomic conditions, the support levels of 143.64 – 137.77 should be followed. If the price comes to these support levels, a potential bullish opportunity may arise.
Supports 143.64 – 137.77 – 135.18
Resistances 147.40 – 151.12 – 155.11
ADA/USDT
The impact of rising tensions in the Middle East continues. The price is struggling to rise. Non-farm employment data from the US increased by 143 thousand in September. The expectation in the markets was expected to be 128 thousand. This did not cause much movement in the markets. Technically, ADA, which is affected by the decline of BTC, has broken the 200 EMA when we examine it on the 4-hour chart. This could deepen the decline. It has also broken the support line since September 6. When we examine the Rsi (14) indicator, a mismatch appears. This could be a potential bullish harbinger. The 0.3469 level stands out as a strong support in the retracements to be experienced with possible political and macroeconomic news. If the positive atmosphere in the ecosystem continues and the data in the macroeconomy are positive, the 0.3724 level can be followed as resistance.
Supports 0.3469 – 0.3301 – 0.3166
Resistances 0.3596 – 0.3651 – 0.3724

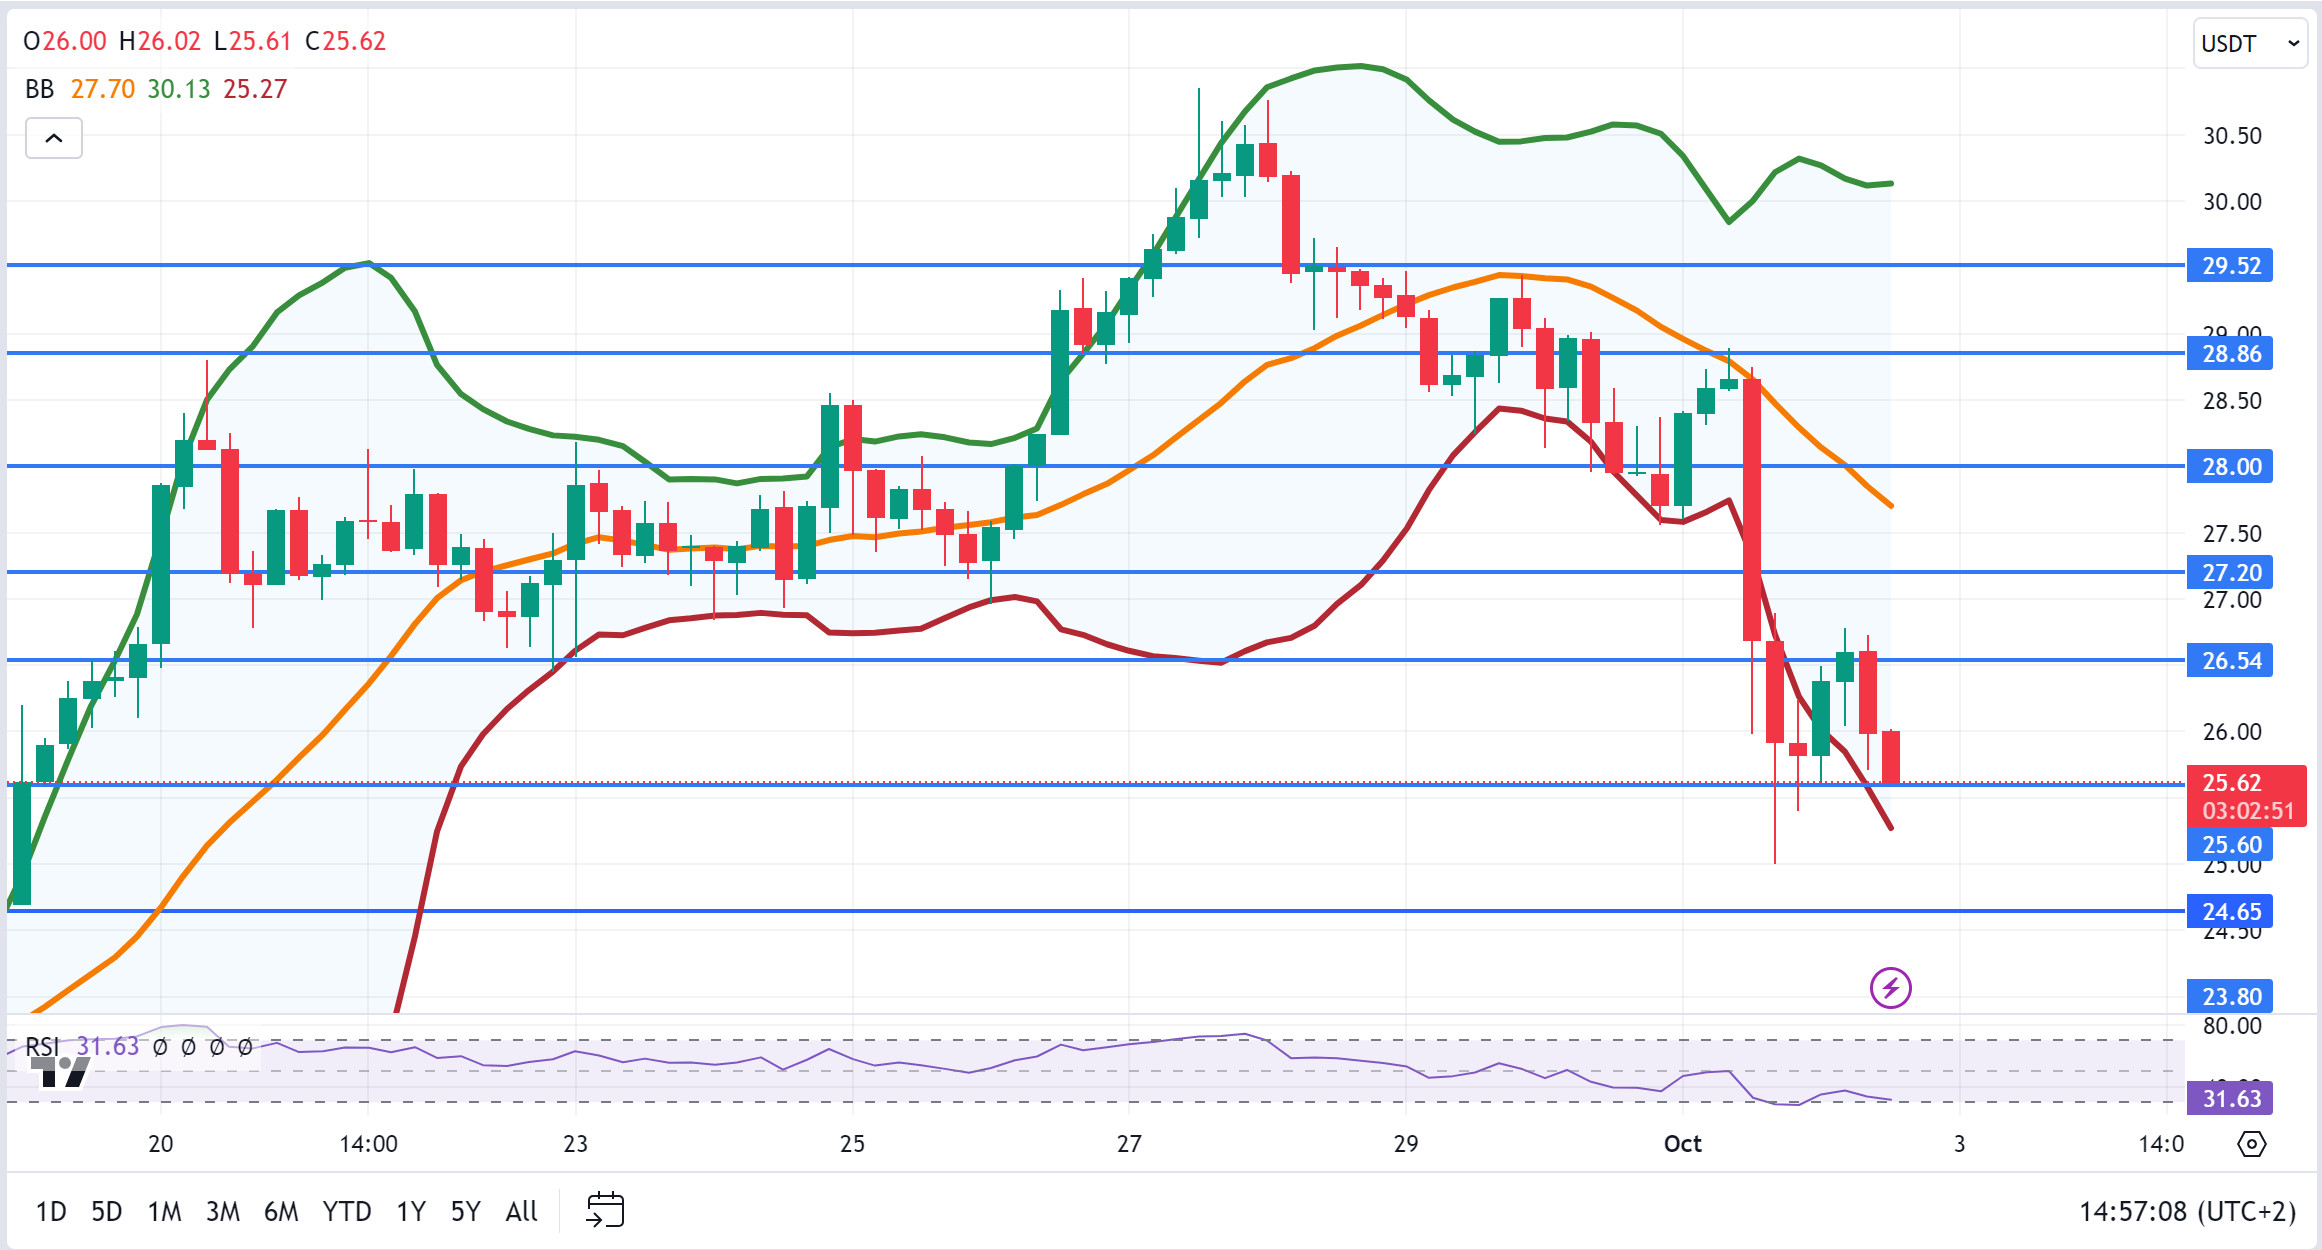
AVAX/USDT
AVAX, which opened today at 25.82, is trading at 25.62, down about 1% during the day. On the 4-hour chart, it is in the Bollinger lower band and the RSI is in the oversold zone with a value of 31. It can be expected to rise slightly from the levels it is at. In such a case, it can be expected to test the 26.54 resistance. If it fails to close above 26.54 resistance, selling pressure may come. In such a case, it may test 25.60 support. As long as it stays above 24.65 support during the day, the desire to rise may continue. With the break of 24.65 support, sales may increase.
Supports 25.60 – 24.65 – 23.80
Resistances 26.54 – 27.20 – 28.00
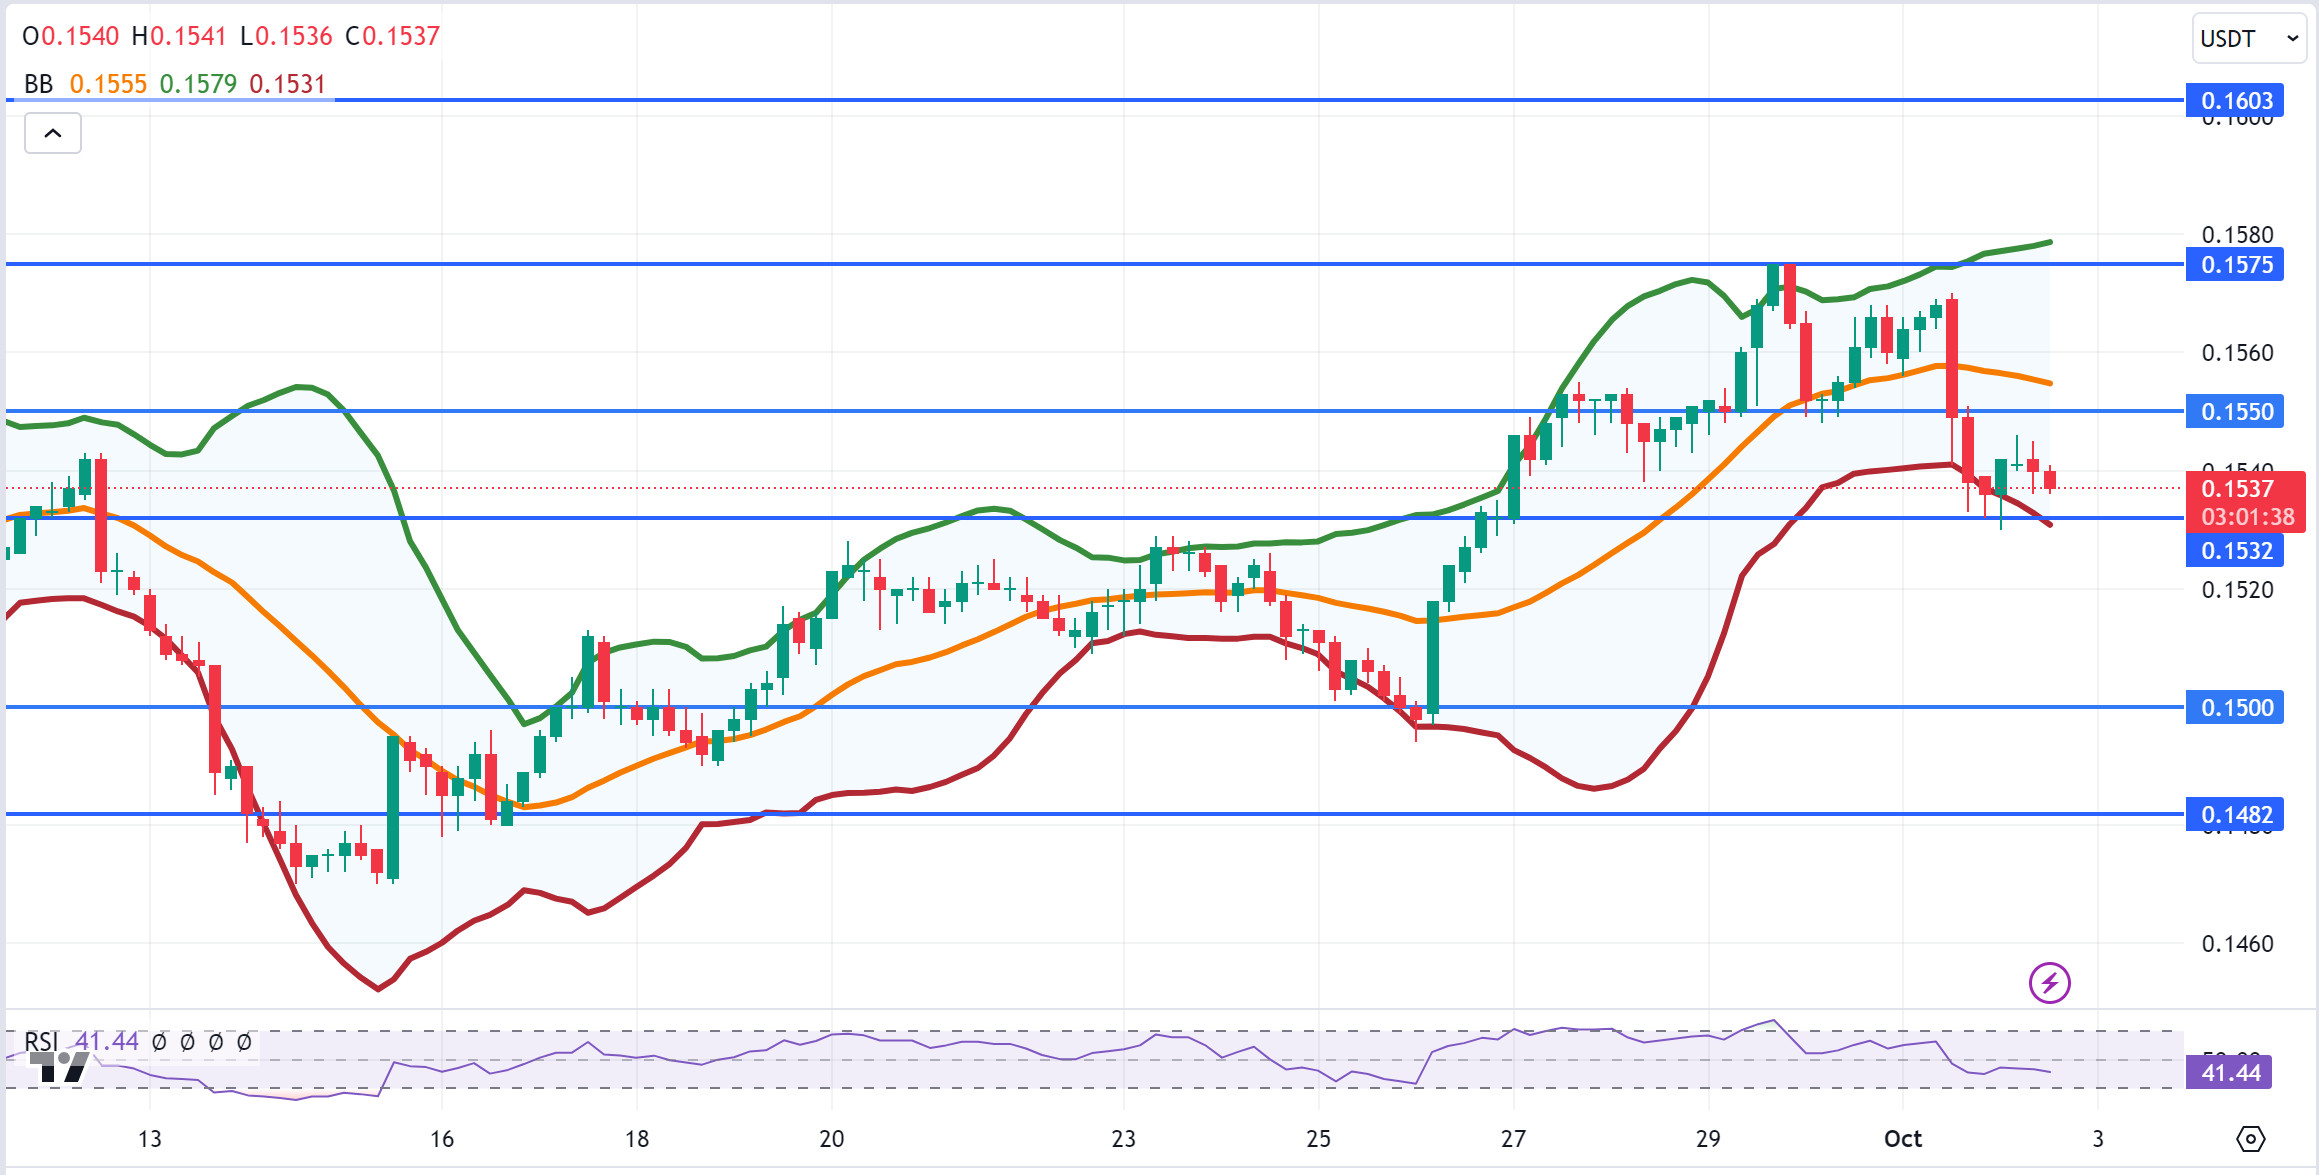
TRX/USDT
TRX, which started today at 0.1536, moved horizontally during the day and is currently trading at 0.1537. On the 4-hour chart, it is in the Bollinger lower band. With the RSI 41 value, it can be expected to move slightly up from its current level. In such a case, it may want to move to the Bollinger middle band by testing the 0.1550 resistance. As a result of the increased tension in the Middle East, selling pressure may come and test the 0.1532 support. TRX may continue to be bullish as long as it stays above 0.1482 support. In case this support is broken downwards, increased sales can be expected.
Supports 0.1532 – 0.1500 – 0.1482
Resistances 0.1550 – 0.1575 – 0.1603
XRP/USDT
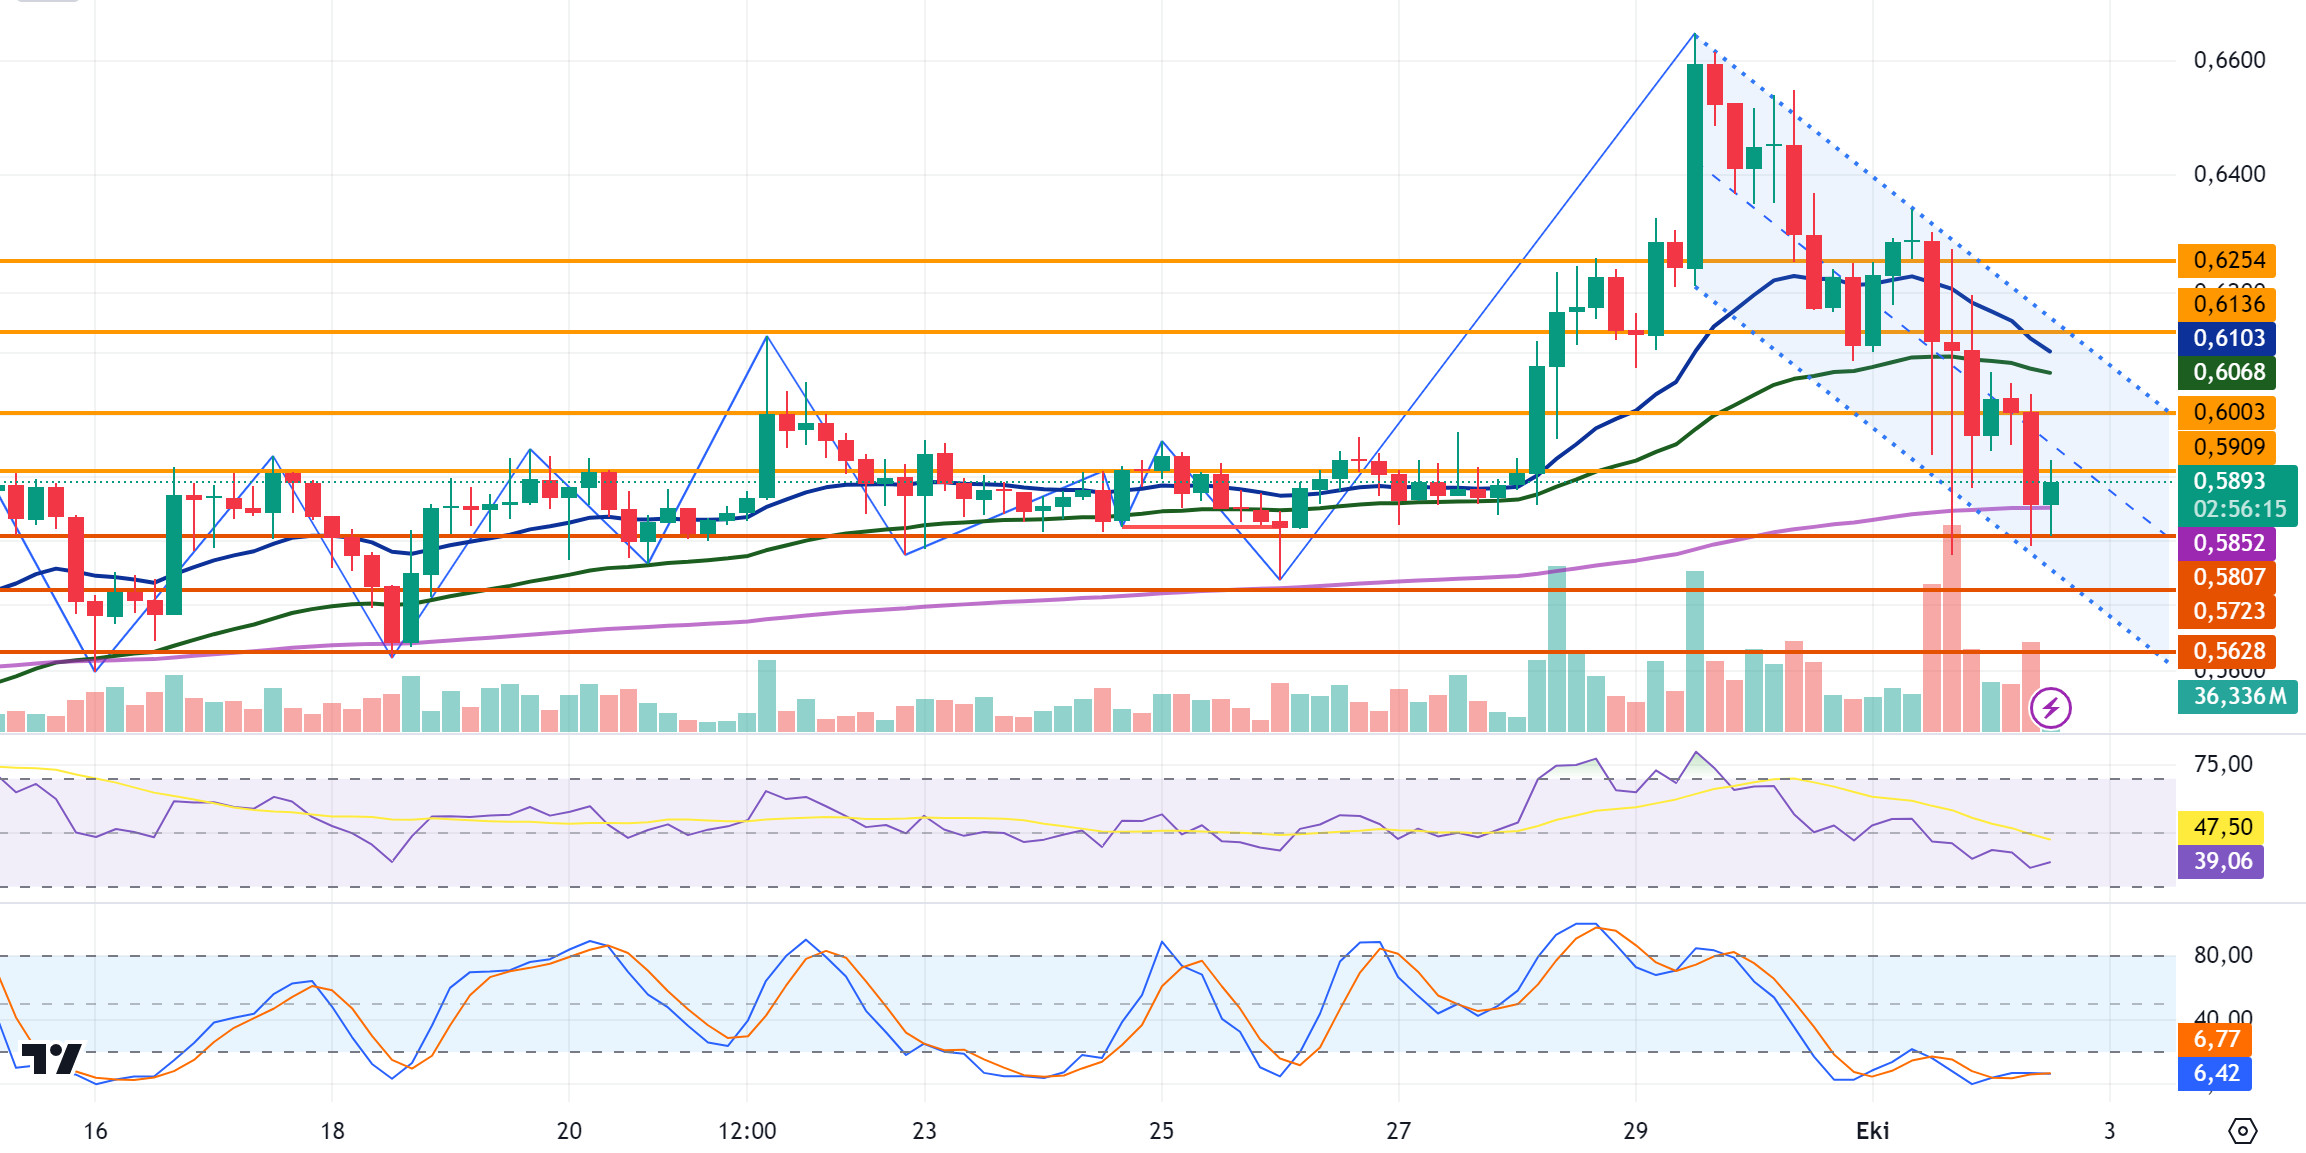
The ongoing tension in the Middle East peaked yesterday when Iran fired 200 missiles at Israel, causing a decline across the crypto market. Yesterday, XRP fell as low as 0.5768 after the news from the Middle East and then recovered to close the day at 0.5966. The decline in XRP continued today and is currently trading at 0.5893 with a 1% loss in value. In the 4-hour analysis, XRP found support at the EMA 200 level in its decline and continues to trade above this level with incoming purchases. If the decline continues, it may test the EMA 200 and 0.5807 support points and if it breaks, it may test the 0.5723-0.5628 support points with the continuation of the decline. In case the decline gives way to the rise, it may test the resistance levels of 0.5909-0.6003-0.6136 with its rise.
Bitwise officially applied to the SEC for the XRP ETF, but this news did not have a big impact on the XRP value due to the prevailing selling pressure in the market. XRP, which tested the resistance level of 0.5909 with the news, declined with the sales.
XRP may turn bullish and offer a long trading opportunity with possible purchases from EMA200 and 0.5807 in its decline. If tensions in the Middle East escalate further, sharp declines may be seen and may offer a short trading opportunity.
EMA20 (Blue Line) – EMA50 (Green Line) – EMA200 (Purple Line)
Supports 0. 5807 – 0. 5723 – 0.5628
Resistances 0.5909 – 0.6 003 – 0.6136
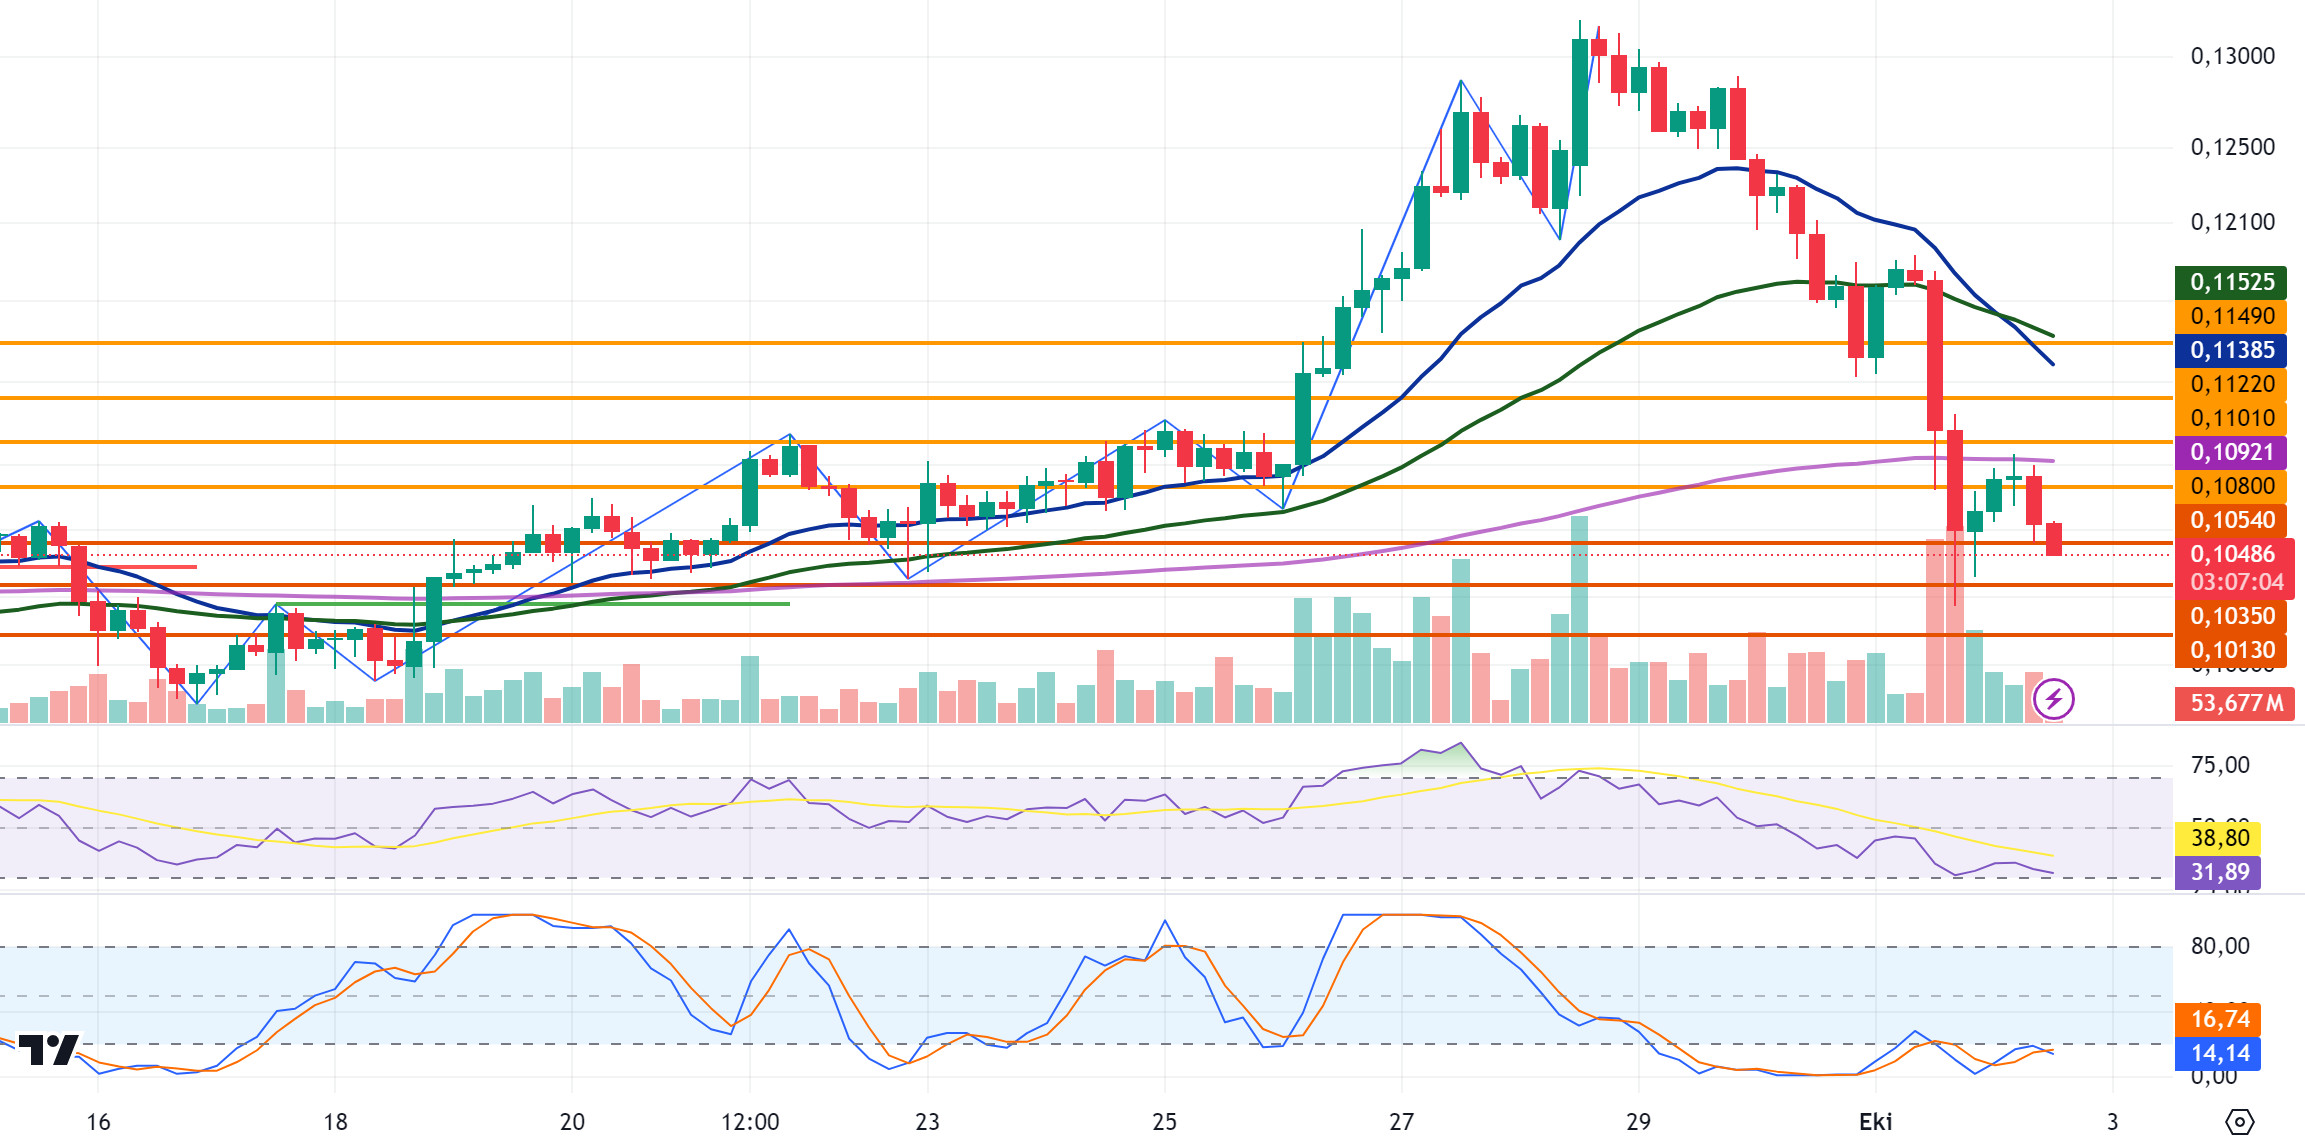
DOGE/USDT
The crypto market, which has been declining in recent days, fell sharply yesterday under the influence of rising tensions in the Middle East after Iran’s attack on Israel. Yesterday, DOGE fell to 0.1024 with a sharp decline and then recovered to close at 0.1067 with a daily loss of 6.45% on a daily basis. DOGE, which continues to decline today, is currently trading at 0.1048 with a 1.9% loss in value. If the decline continues and the last candle in the 4-hour analysis takes place below the 0.1054 support level, DOGE may test the support levels of 0.1035-0.1013 in the continuation of the decline. In case it starts to rise, if it tests and breaks the 0.1080 and EMA200 levels, it may test the resistance levels of 0.1101-0.1122 in the continuation of the rise.
If DOGE starts to rise, it may decline with possible sales from the EMA200 and 0.1080 resistance levels and may offer a short trading opportunity. If these levels are broken and the uptrend continues, it may offer a long trading opportunity.
EMA20 (Blue Line) – EMA50 (Green Line) – EMA200 (Purple Line)
Supports 0.1054 – 0.1035 – 0.1013
Resistances 0.1080 – 0.1101 – 0.1122
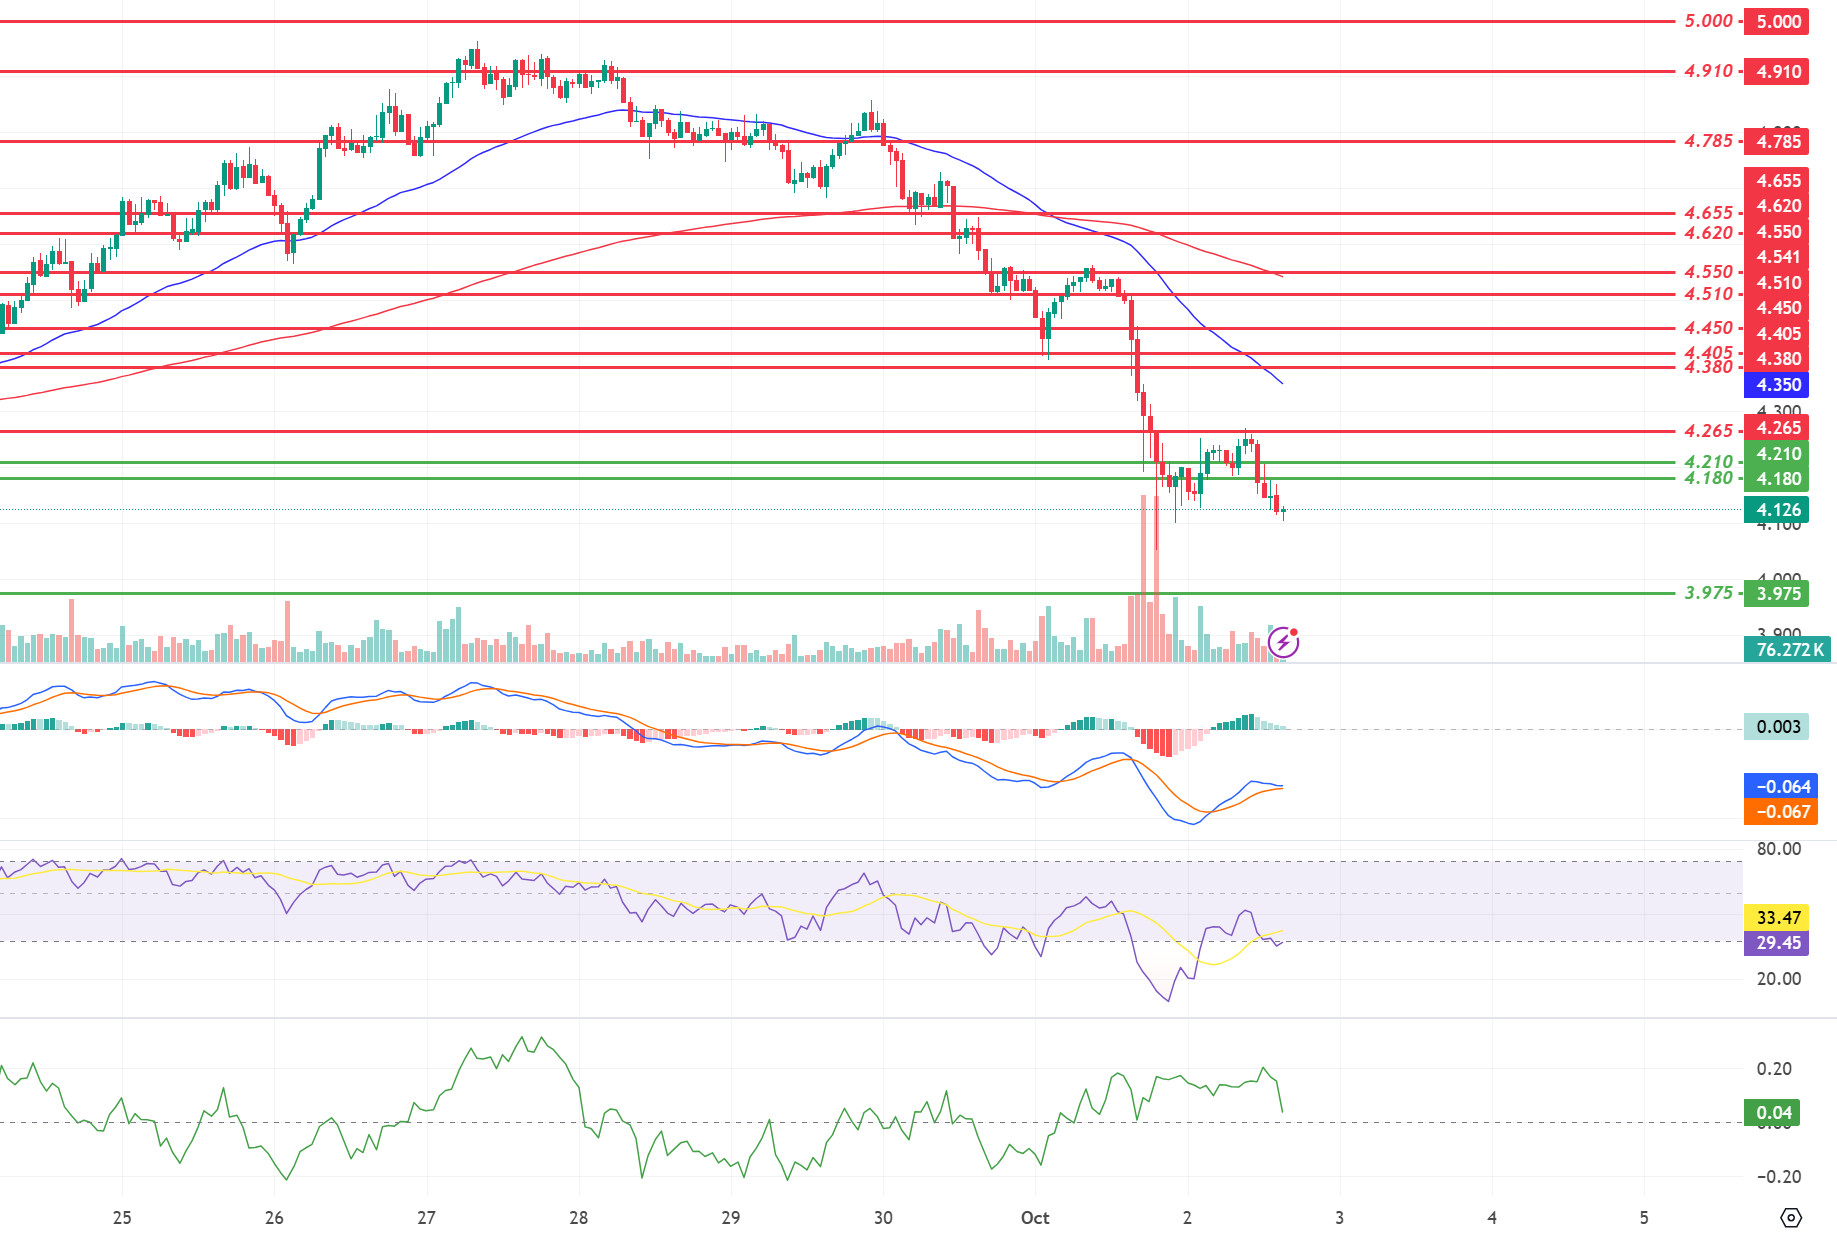
DOT/USDT
When we examine the Polkadot (DOT) chart, the price seems to have broken the 4,180 support down. When we examine the MACD, we see that the buyer pressure has decreased compared to the previous hour. If the selling pressure continues, the price may retreat to the 3.975 support level. On the other hand, we see that there is a positive mismatch on the RSI. The price may look to break the 4.180 level upwards in case the buying pressure increases.
(Blue line: EMA50, Red line: EMA200)
Supports 4,210 – 4,180 – 3,975
Resistances 4.265 – 4.380 – 4.405
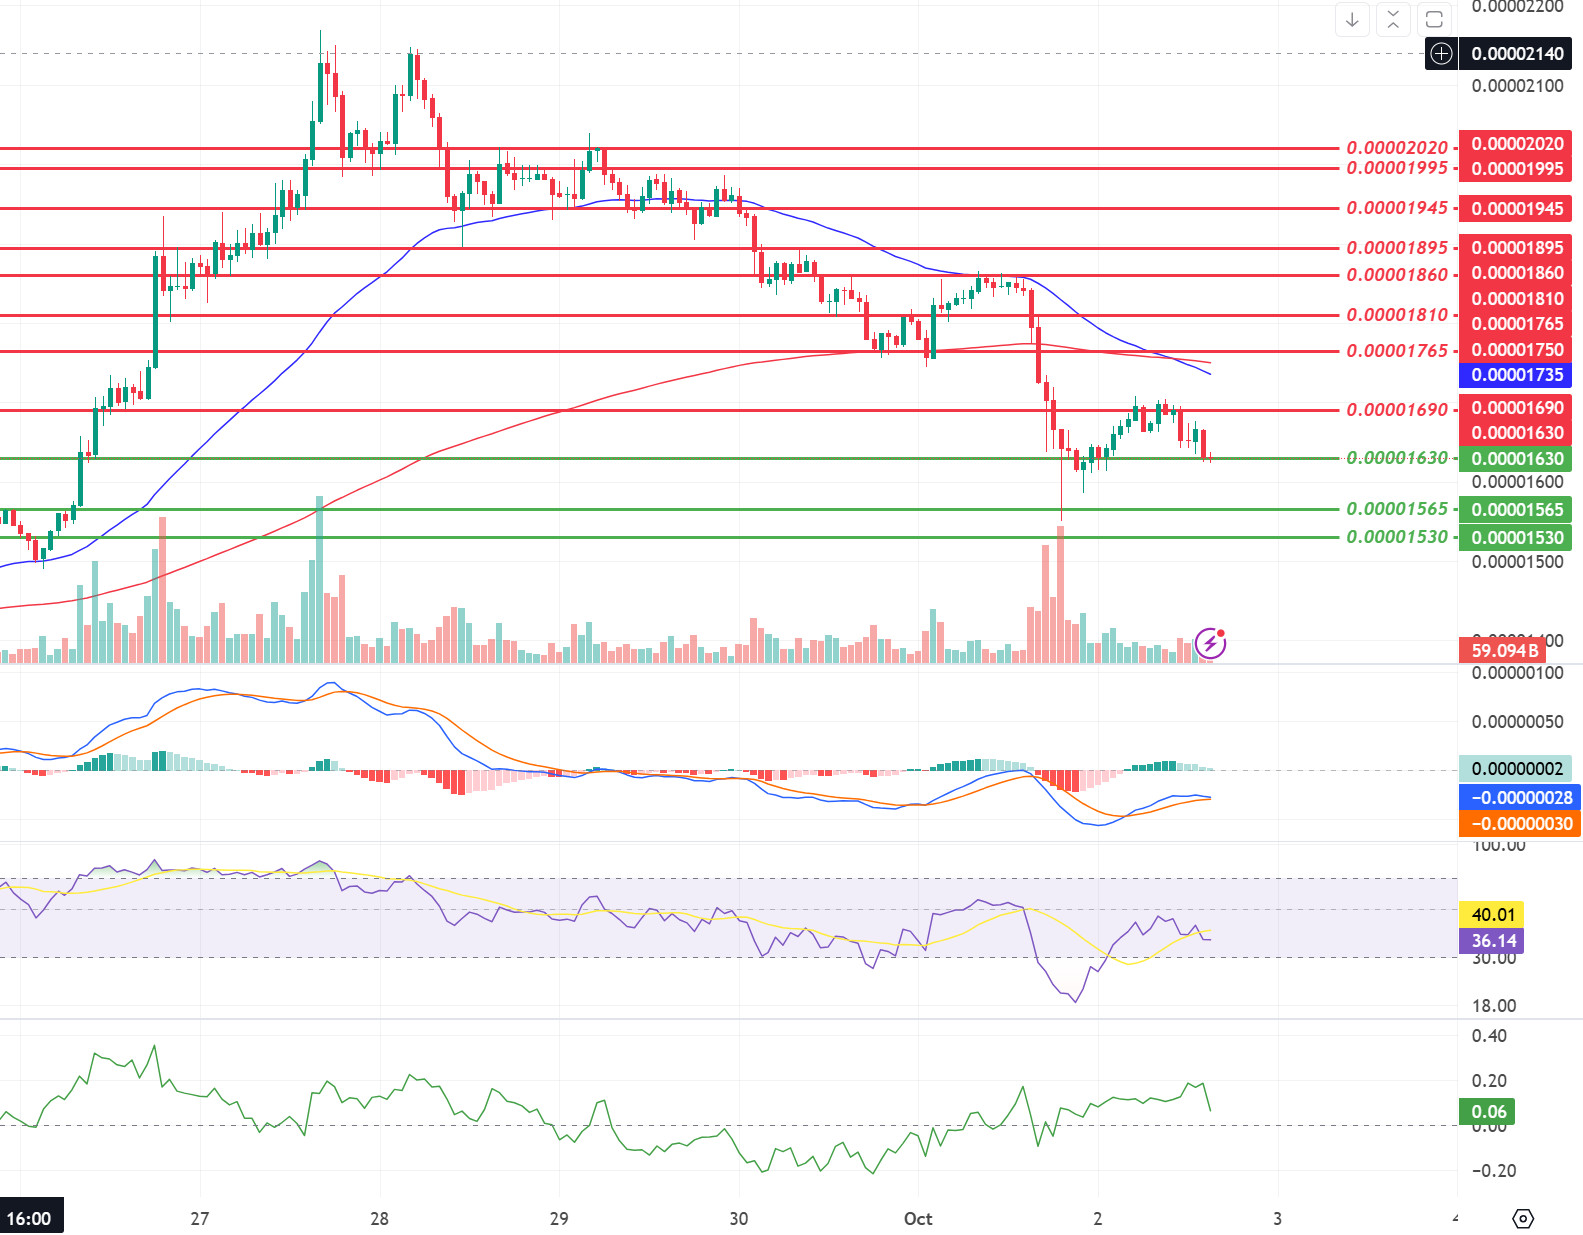
SHIB/USDT
Shytoshi Kusama, leader of Shiba Inu, has thrown his support behind the upcoming ShibaCon event. This blockchain conference will take place in Bangkok, Thailand from November 5th to 15th and will feature talks by leaders from DeFi, NFTs, Web3 and gaming. The SHIB community is excited for the event. SHIB was rejected at 0.00001690 as the EMA50 line broke below the EMA200 line. The price is hovering around 0.00001630 levels. According to the MACD oscillator, we see that the buyer pressure decreased compared to the previous hour. If the price fails to hold above 0.00001630, the next support level could be 0.00001565. On the other hand, if the price holds above 0.00001630, its next target could be 0.00001690.
(Blue line: EMA50, Red line: EMA200)
Supports 0.00001630 – 0.00001565 – 0.00001530
Resistances 0.00001690 – 0.00001765 – 0.00001810
LEGAL NOTICE
The investment information, comments and recommendations contained herein do not constitute investment advice. Investment advisory services are provided individually by authorized institutions taking into account the risk and return preferences of individuals. The comments and recommendations contained herein are of a general nature. These recommendations may not be suitable for your financial situation and risk and return preferences. Therefore, making an investment decision based solely on the information contained herein may not produce results in line with your expectations.
