MARKET SUMMARY
Latest Situation in Crypto Assets
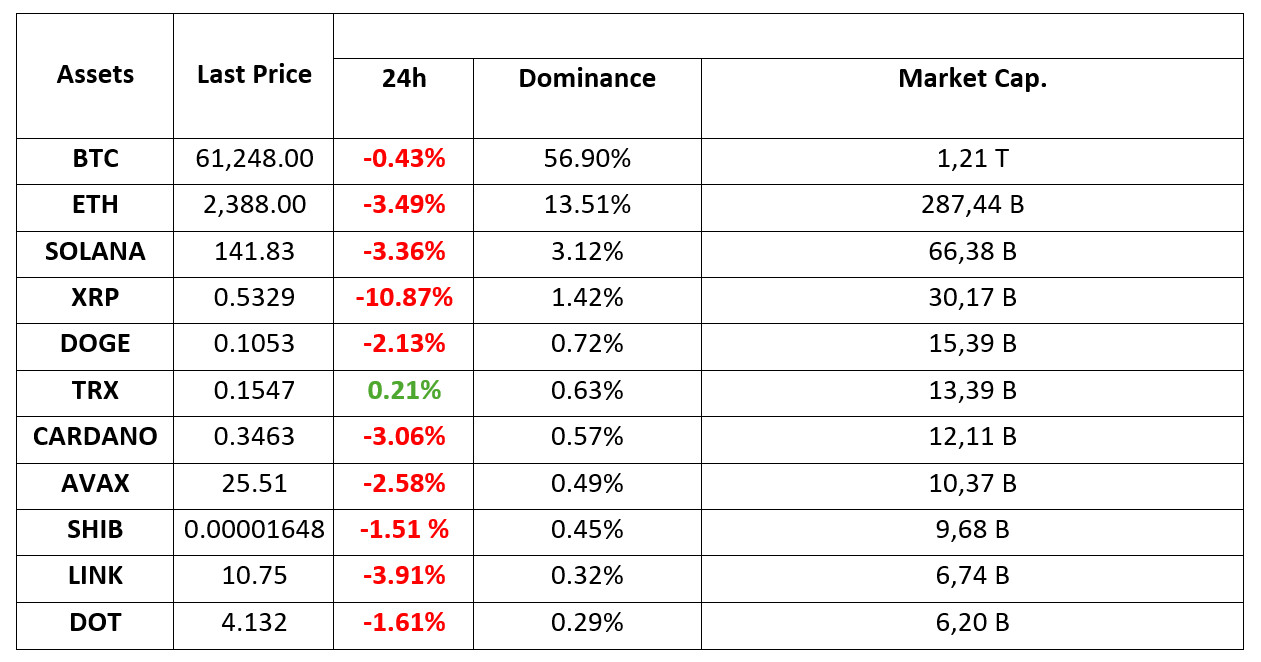
*Prepared on 10.3.2024 at 06:00 (UTC)
WHAT’S LEFT BEHIND
Geopolitical Tensions in the Middle East
The Middle East is edging closer to a full-blown regional war as Israel vowed to respond to Iran’s massive barrage of ballistic missiles fired at the country on Tuesday night, with Israeli Prime Minister Benjamin Netanyahu saying in a statement, “Iran made a big mistake tonight and will pay for it.” While the decline in Bitcoin (BTC) prices is attributed to these geopolitical developments, investors are worried about its reaction in the future.
New Era in Ripple Case!
The US Securities and Exchange Commission (SEC) has appealed the final decision in the Ripple Labs case. This move by the SEC has caused increased uncertainty in the XRP and crypto market. The case will be reviewed in the Second Court of Appeals and is of critical importance in terms of cryptocurrency regulations.
FTX Will Sell Its Cryptocurrency Cheaply
FTX plans to sell locked Worldcoin tokens at a discount to pay its debtors. Although these tokens will not be immediately available, investors are expected to show interest in the discounted price. The proceeds from the sale will help FTX pay off its debts.
HIGHLIGHTS OF THE DAY
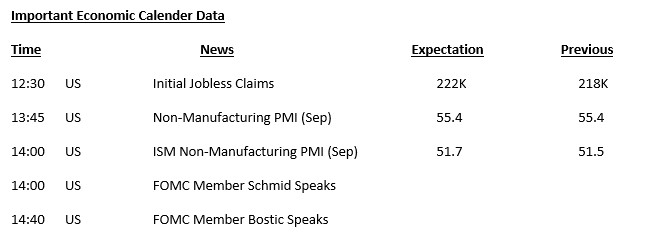
INFORMATION
*The calendar is based on UTC (Coordinated Universal Time) time zone.
The economic calendar content on the relevant page is obtained from reliable news and data providers. The news in the economic calendar content, the date and time of the announcement of the news, possible changes in the previous, expectations and announced figures are made by the data provider institutions. Darkex cannot be held responsible for possible changes that may arise from similar situations.
MARKET COMPASS
Escalating tension in the Middle East continues to be on the agenda of global markets. The expectation that Israel will retaliate after Hezbollah’s missile attack keeps investors on edge. The question mark over how high the tension in the region can rise and fears that the tension may spread to a wider geography push markets to remain cautious.
Israel says eight of its soldiers have been killed in clashes with Hezbollah in Lebanon. US President Biden responded to a question on whether Israel would support a possible attack on Iran’s nuclear facilities by saying “No”. Markets will continue to closely monitor the news from the region.
After yesterday’s higher-than-expected ADP non-farm private sector employment change data for the US, expectations that the Federal Reserve (FED) will cut interest rates by 25 basis points on November 7th continue to dominate the markets. Today, macro indicators from the US will be closely monitored. Afterwards, the evaluations of some Federal Open Market Committee (FOMC) officials will be followed.
European and US indices are expected to start the new day on the negative side. Asian markets are also on a downtrend this morning, except for Japan. Japanese indices rose after the yen depreciated after the new Prime Minister Ishiba stated that there is no urgent need for an interest rate hike. The dollar index continued to rise as expectations that the FED will cut the next interest rate by 25 basis points after the better-than-expected US data and the escalating tension in the Middle East increased safe-haven demand.
Digital assets remained under pressure amid the rising geopolitical risks. News flow from the Middle East remains important. In addition, macro data from the US may also be effective. In the absence of any new and major news flow, we can expect the markets to gradually get used to the environment brought by the increasing tension. However, the main issue here seems to be the dose of Israel’s potential retaliatory attack. Other than that, the cautious mood may continue and if there is no new news flow, digital assets may hold on for a while without expanding their recent losses. In this equation, which is too early to expect a rise, it would not be surprising to see new low price levels after horizontal price changes under the assumption that tensions will continue.
TECHNICAL ANALYSIS
BTC/USDT
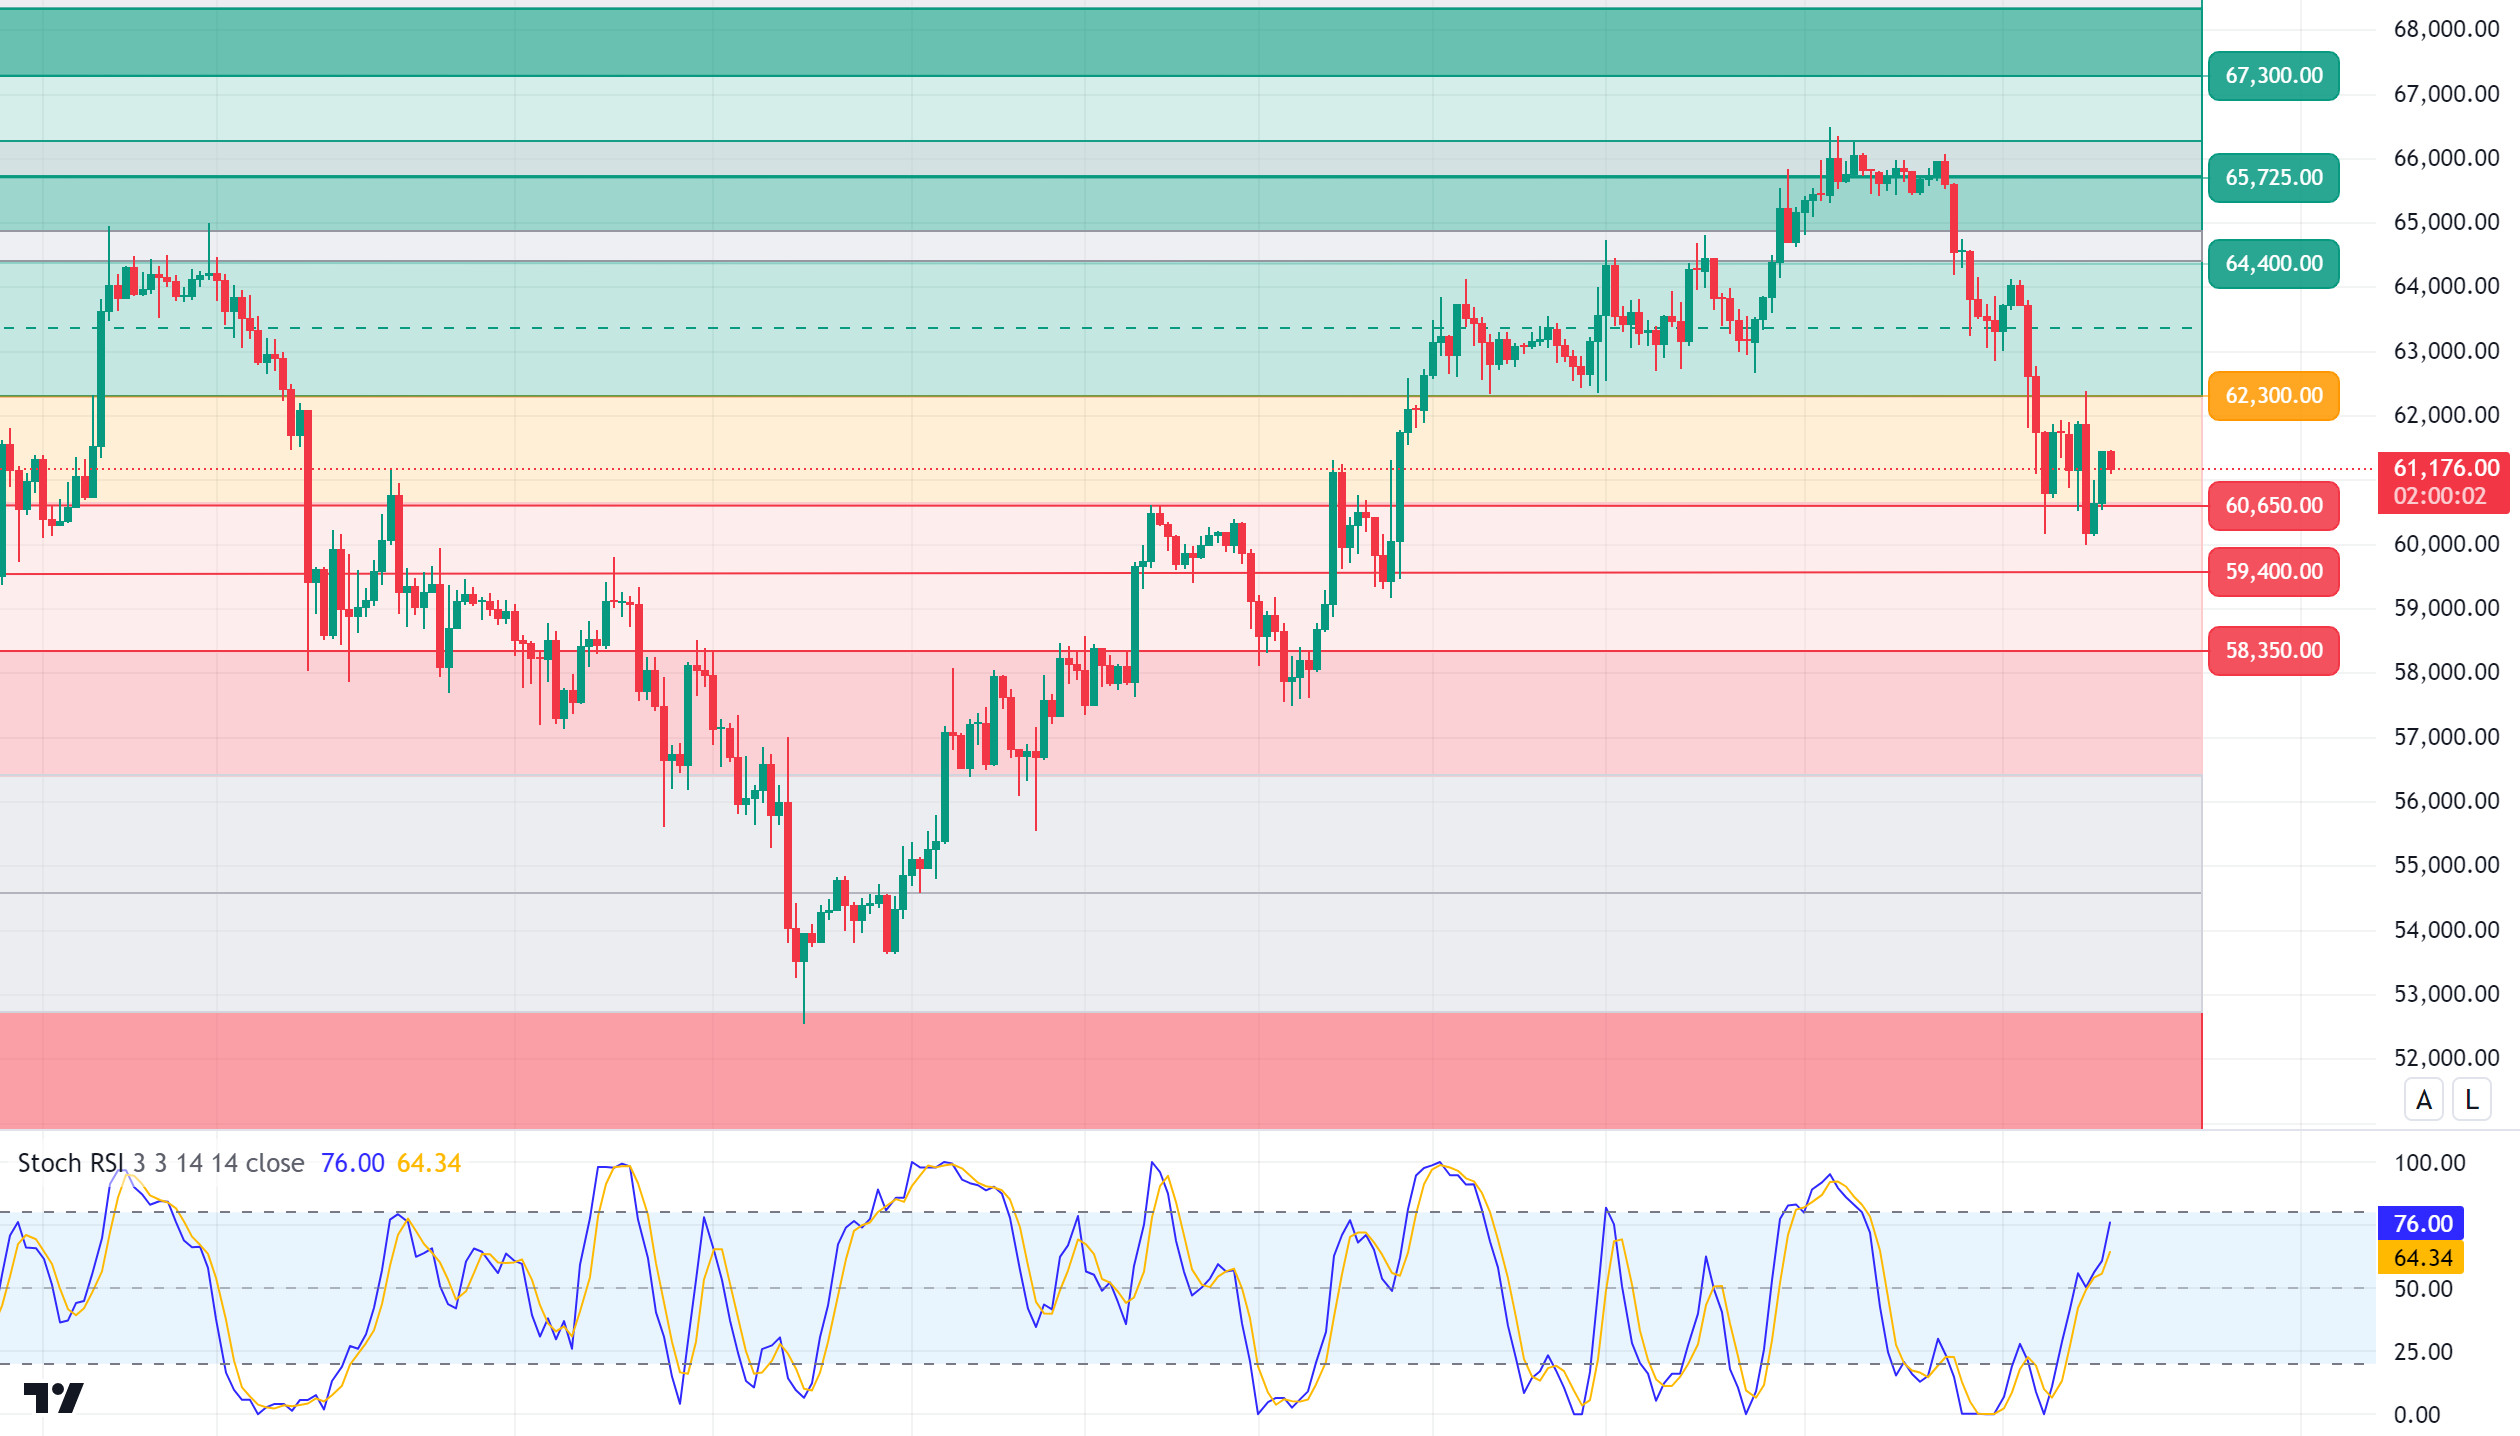
Is the decline in Bitcoin only due to geopolitical reasons? The recent escalation of geopolitical tensions in the Middle East has affected global markets and caused significant volatility in cryptocurrency markets. While the decline in the price of Bitcoin in particular is attributed to these geopolitical developments, it should not be forgotten that the market has been extremely “bullish” in recent days and the price may fall with the accumulation of positions in this direction and the direction of the futures market. In addition, the term “Uptober”, which has started to be used quite a lot in the market and which we have previously mentioned in the analysis, is another factor affecting the market looking for an excuse for the decline as it is now more adopted by the crypto masses. When we look at the overall picture, we can say that the decline in Bitcoin is influenced by market dynamics as well as tensions in the Middle East. Assuming that the market dynamics and the tension in the Middle East can continue with the response from the Israeli front, what levels await us if the decline deepens? In the BTC 4-hour technical analysis, we see that the price is moving in the band of 60,650, the support zone, and 62,300, the resistance zone. BTC, which tested the 62,300 resistance level with the opening of the US market yesterday, could not stay in this region and turned its direction down again. The higher-than-expected non-farm payrolls data released by the US may have a positive impact on the unemployment data to be released on Friday. We can say that BTC will be in an uptrend again in the long term after the tensions in the Middle East as macroeconomic data improve. In the medium term, the deepening of the declines with the increase in the size of the tension is among the possibilities to retest below 60,000 levels. In this direction, attention should be paid to closures below the 60,650 support level.
Supports 60,650 – 59,400 – 58,350
Resistances 62,300 – 64,400 – 65,725
ETH/USDT
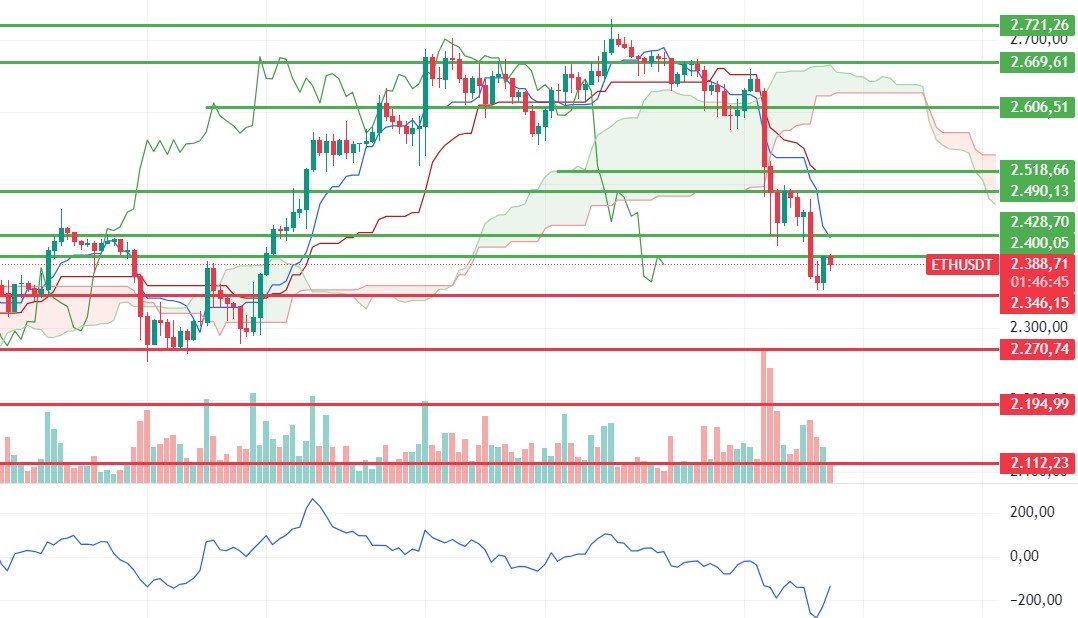
Ethereum, which fell to 2,346 support after yesterday’s developments, rose back to the 2,400 level and was rejected from here. RSI, MACD, OBV look negative while Momentum looks slightly positive. Breaching 2,400 resistance could start a short uptrend to 2,490. A break of 2,346 support may cause a pullback to 2,270 main support. This support level is one of the most important levels to follow and it can be said that it is the most critical zone to take a reaction. It can be interpreted as positive that the last reaction rise came from the spot side and funding rates turned negative again.
Supports 2,346 – 2,270 – 2,194
Resistances 2,400 – 2,428 – 2,490
LINK/USDT
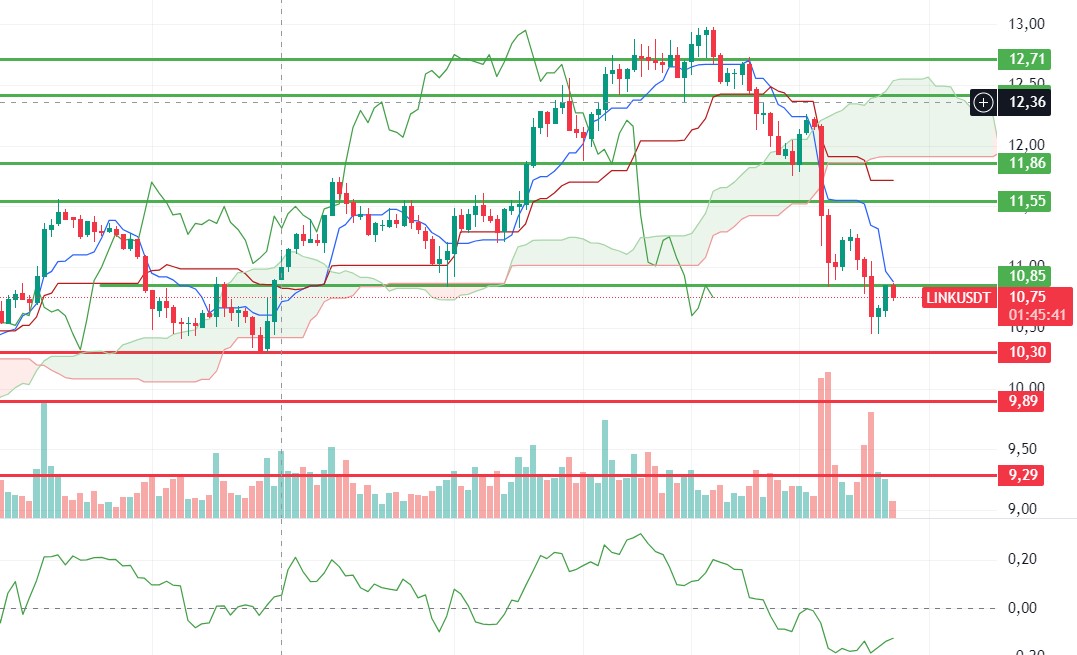
Yesterday, the loss of 10.85 support brought sharp declines. Today, LINK, which has risen to this level again, has been rejected. All indicators maintain their negative structures, in this context, it seems possible to experience some further decline with the news during the day. In order to talk about a positive structure, it can be said that the resistance levels of 10.85 and 11.55 need to be regained.
Supports 10.30 – 9.89 – 9.29
Resistances 10.85 – 11.55 – 11.86
SOL/USDT
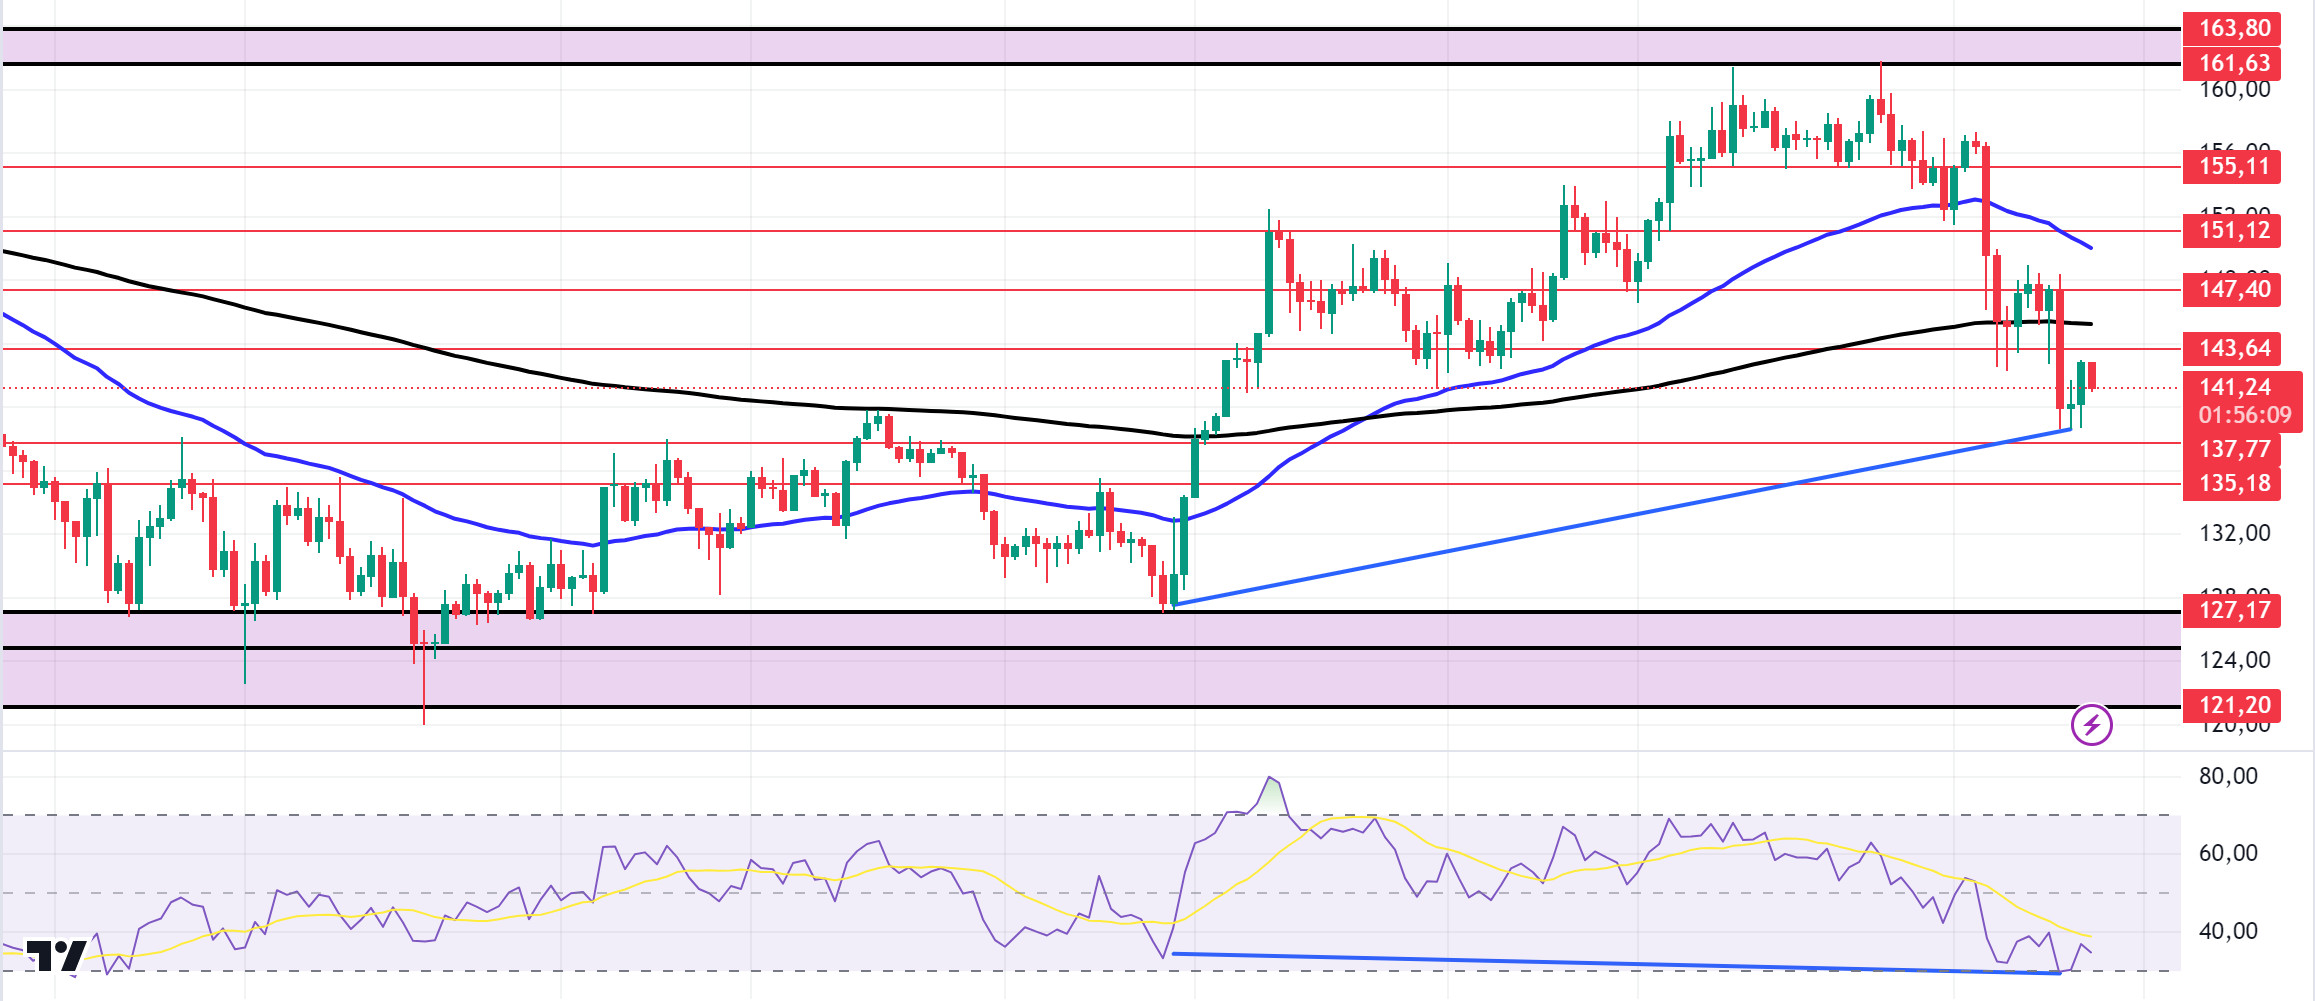
Tensions in the Middle East are on the rise. This caused a decline in cryptocurrency markets again yesterday. Today, the non-manufacturing purchasing managers index from the US is among the data to come. The price cannot maintain its level. In the Solana ecosystem, former NSA whistleblower Edward Snowden openly criticized the Solana blockchain network for its centralization. Speaking via video link at the Token2049 conference, Snowden expressed doubts about Solana’s operational model, describing it as a system that is open to manipulation by nation states and bad actors due to its centralized structure, stating that meme tokens are only used for fraud. The response came from Mert Mumtaz, CEO of Helius Labs and an ardent supporter of Solana. Rejecting Snowden’s allegations, Mumtaz emphasized the resilience of the network and challenged skeptics to prove how a centralized structure could abuse the Solana system and provide concrete evidence to critics. This suggests that there is a prevailing belief among Solana supporters that fears of centralization are exaggerated and unfounded. Technically, the price broke the 200 EMA on the 4-hour chart. There is a mismatch in the RSI (14). This mismatch in RSI and the positive OI-Weighted Funding Rate metric shows investors’ confidence in SOL. The levels of 143.64 – 147.40 appear as the first resistance levels in the uptrends driven by both macroeconomic conditions and innovations in the Solana ecosystem. If it rises above these levels, the rise may continue. In the sales that investors will make due to political and macroeconomic conditions, the support levels of 137.77 – 135.18 should be followed. If the price comes to these support levels, a potential bullish opportunity may arise.
Supports 137.77 – 135.18 – 127.17
Resistances 143.64 – 147.40 – 151.12
ADA/USDT
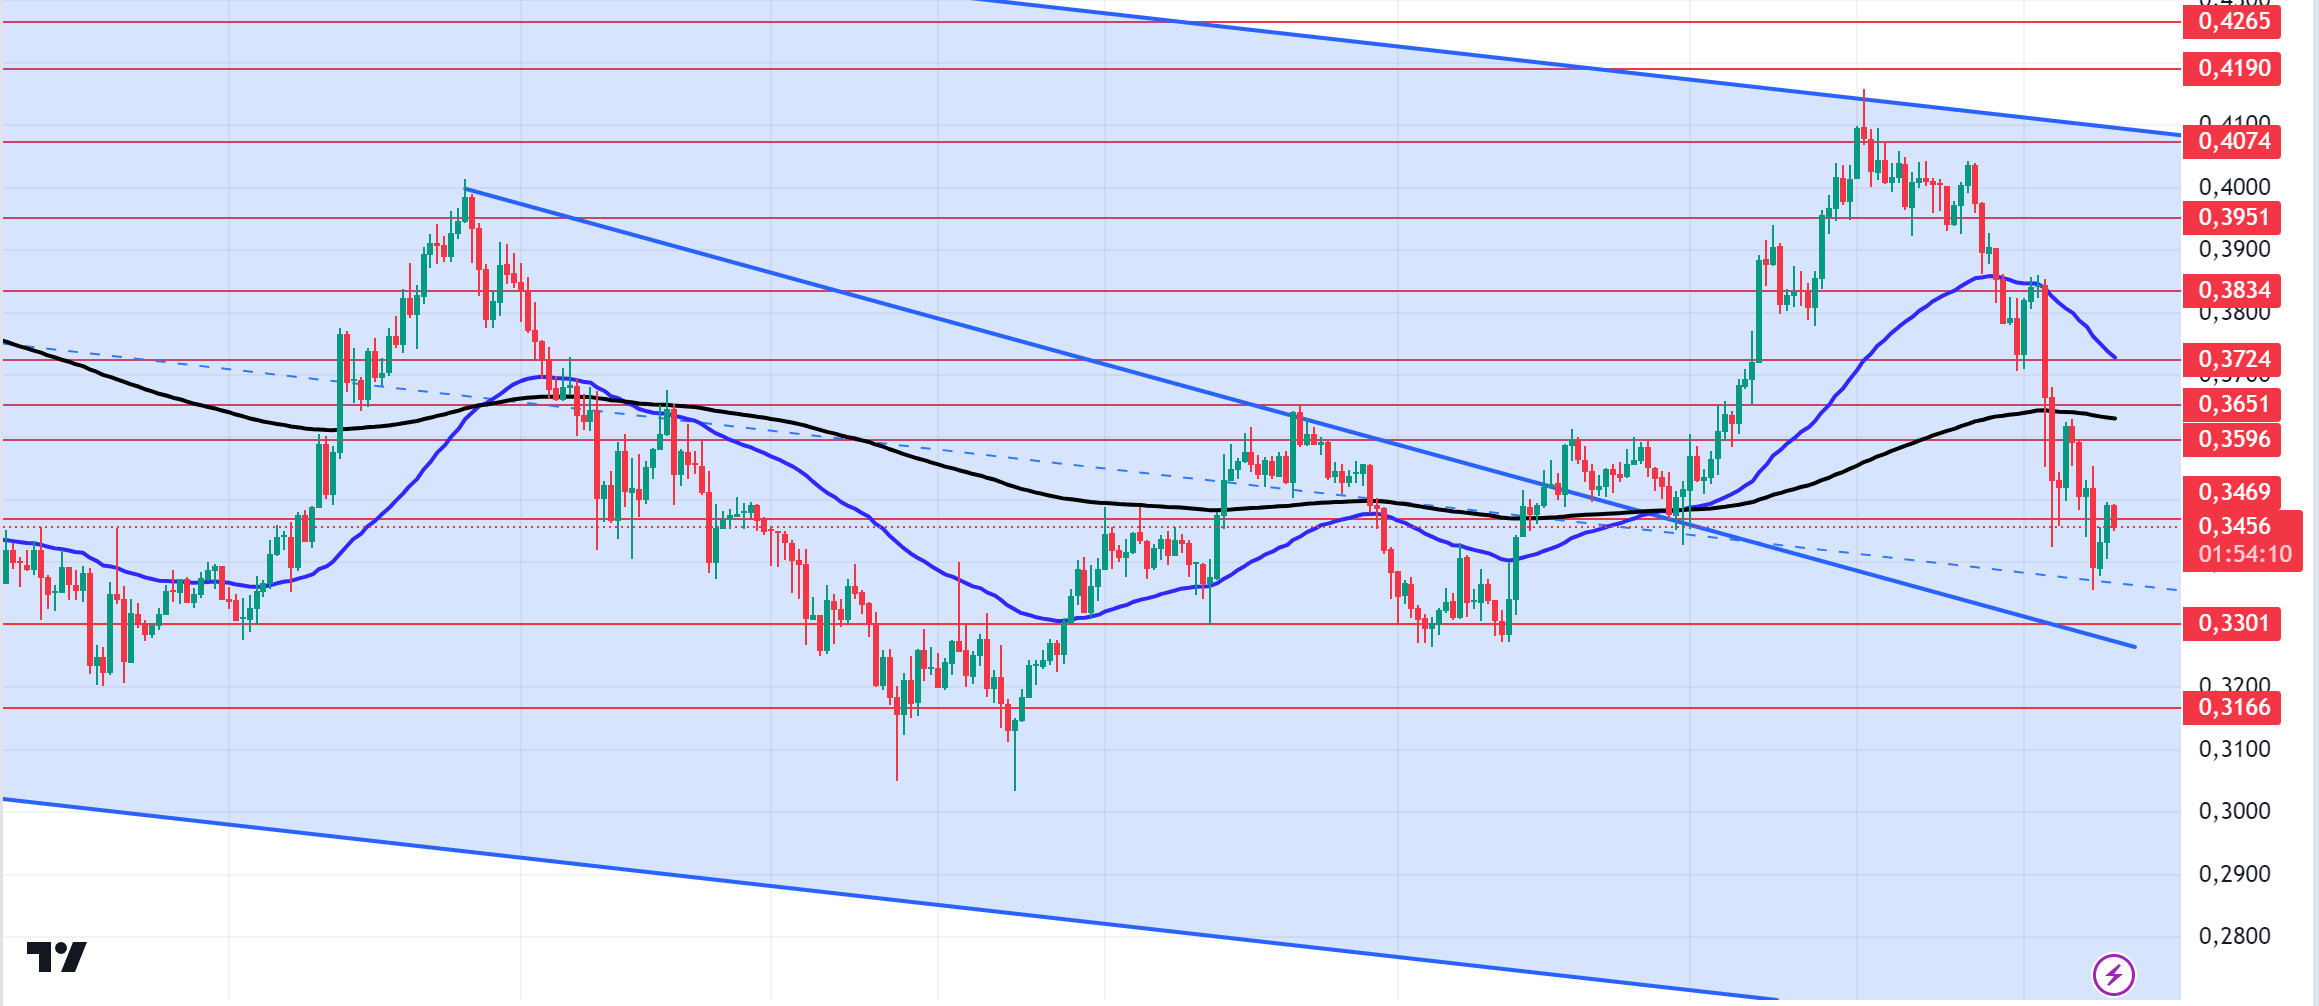
Tensions in the Middle East are on the rise. This caused a decline in cryptocurrency markets again yesterday. Today, the non-manufacturing purchasing managers index from the US is among the data to come. The testnet for the privacy protocol Midnight Network has been launched in the Cardano ecosystem. The new development brought Cardano back to the agenda in the blockchain world. The Midnight Protocol aims to legalize privacy on the Cardano network. It was developed especially for organizations and developers who want to maintain blockchain transparency. According to data from Santiment, the profit and loss indicator shows that investors aim to hold ADA in the long term. However, data from Artemis shows that the number of daily active addresses has generally decreased since September 7. We will see if this will be reflected in ADA as a sale. Technically, ADA, which is affected by the decline of BTC, has broken the 200 EMA when we examine it on the 4-hour chart. This could deepen the decline. The 0.3301 level stands out as a strong support in the pullbacks that will be experienced with possible political and macroeconomic news. If the positive atmosphere in the ecosystem continues and the data in the macroeconomy are positive, the 0.3596 level can be followed as a resistance point in the rises that will take place.
Supports 0.3469 – 0.3301 – 0.3166
Resistances 0.3596 – 0.3651 – 0.3724
AVAX/USDT
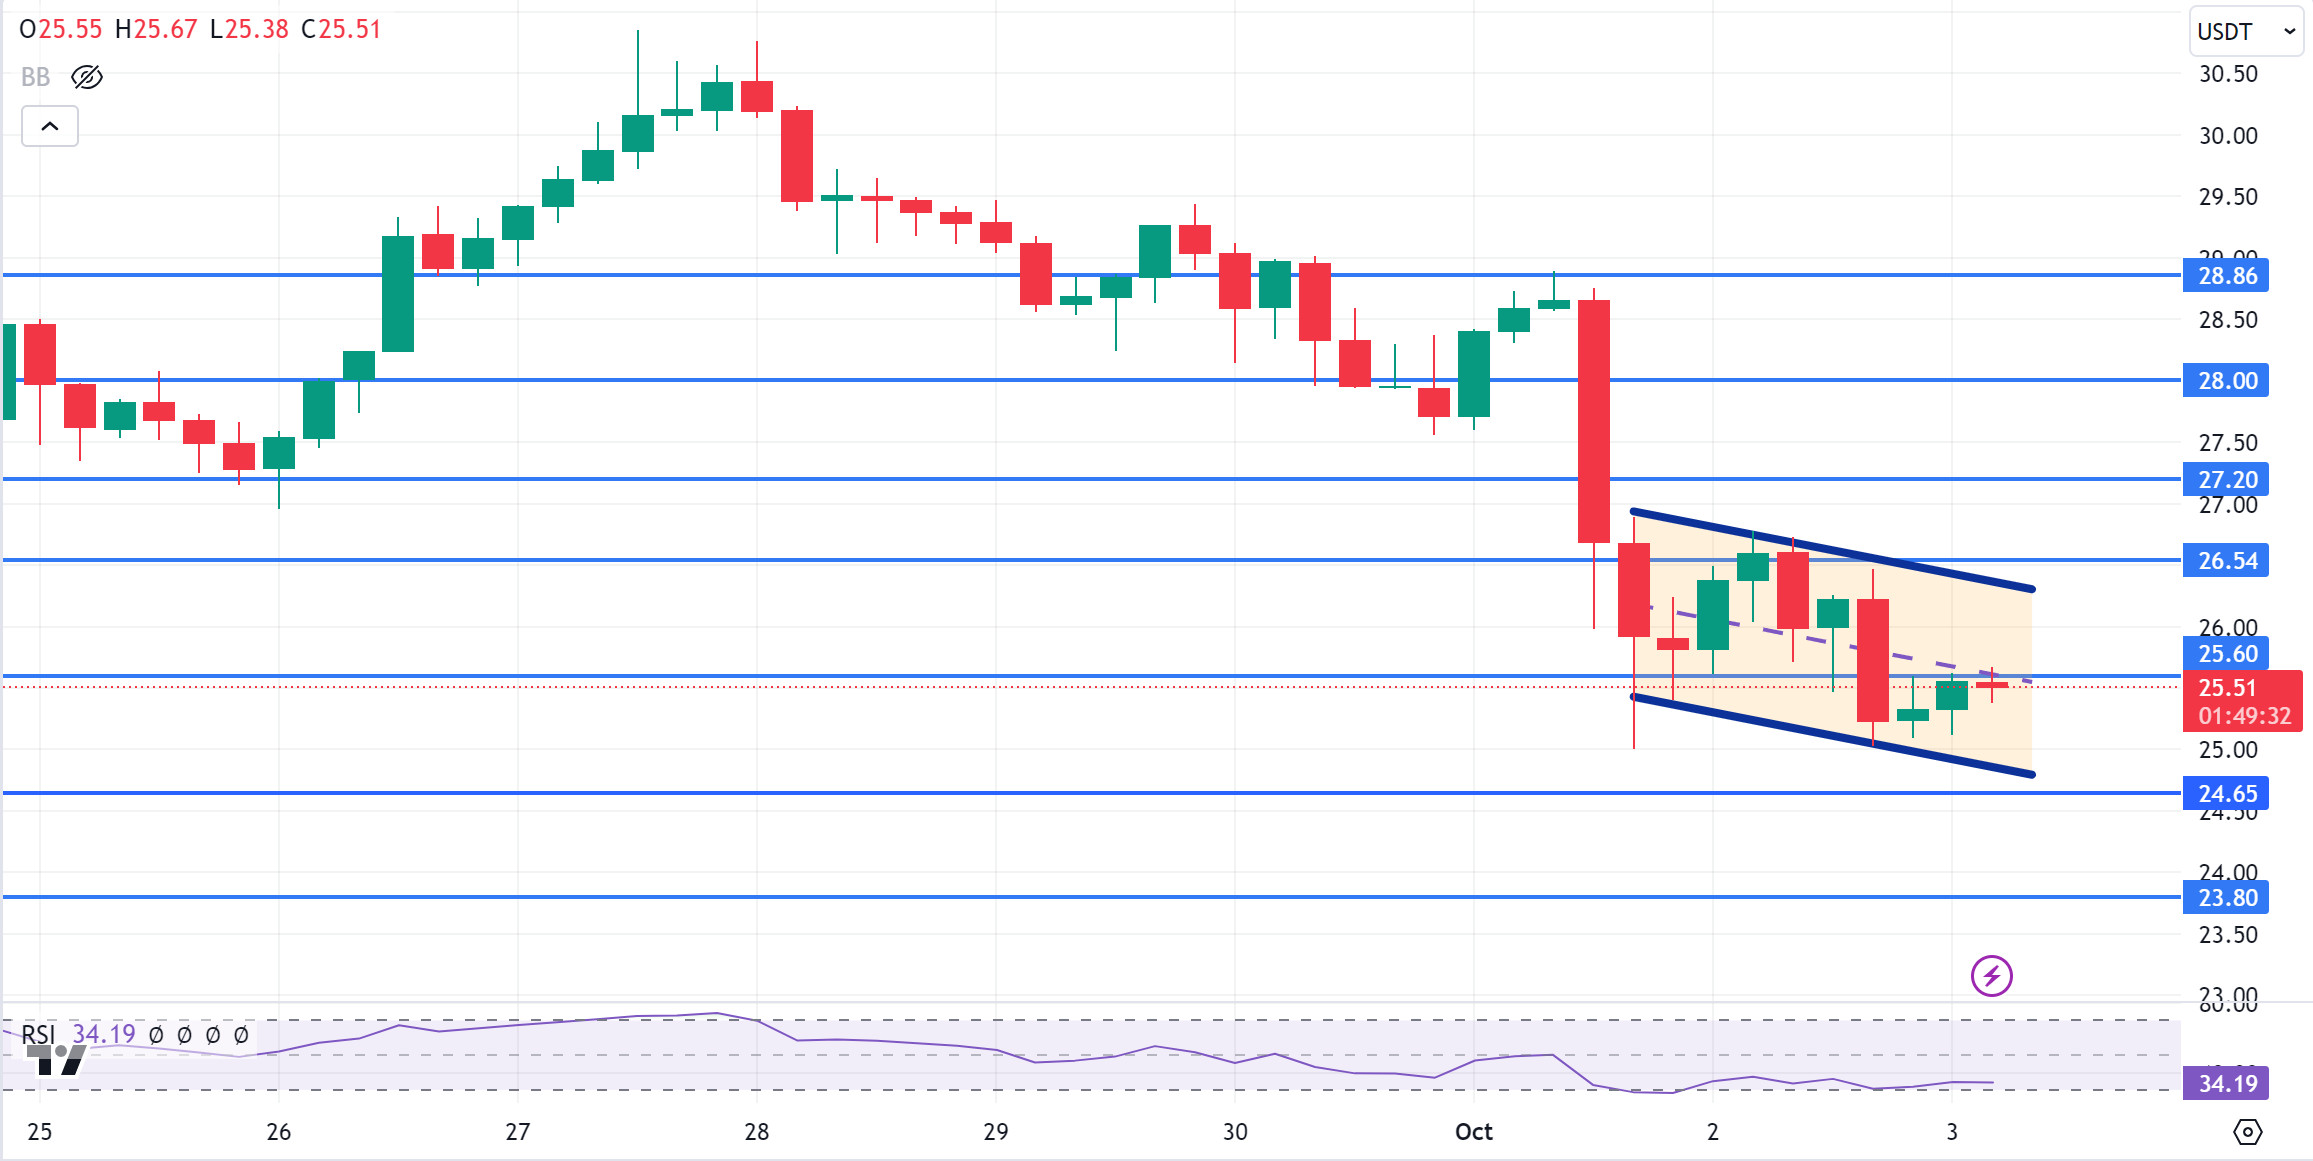
AVAX, which opened yesterday at 25.82, fell by about 2% due to the continued tension in the Middle East during the day and closed the day at 25.33. Today, unemployment claims, services purchasing managers index and ISM non-manufacturing purchasing managers index data will be released by the US. However, the market is currently following the tension in the Middle East more than the upcoming data and will determine the direction with the news from the region.
AVAX, currently trading at 25.51, is moving in a falling channel on the 4-hour chart. It is in the middle band of the falling channel and is very close to the oversold zone with an RSI value of 34. It can be expected to rise slightly from these levels. In such a case, it can be expected to move to the upper band of the channel and test the 26.54 resistance. In case of news of escalating tension from the Middle East, selling pressure may increase and test the 24.65 support. As long as it stays above 24.65 support during the day, the desire to rise may continue. With the break of 24.65 support, sales may increase.
Supports 24.65 – 23.80 – 22.80
Resistances 25.60 – 26.54 – 27.20
TRX/USDT
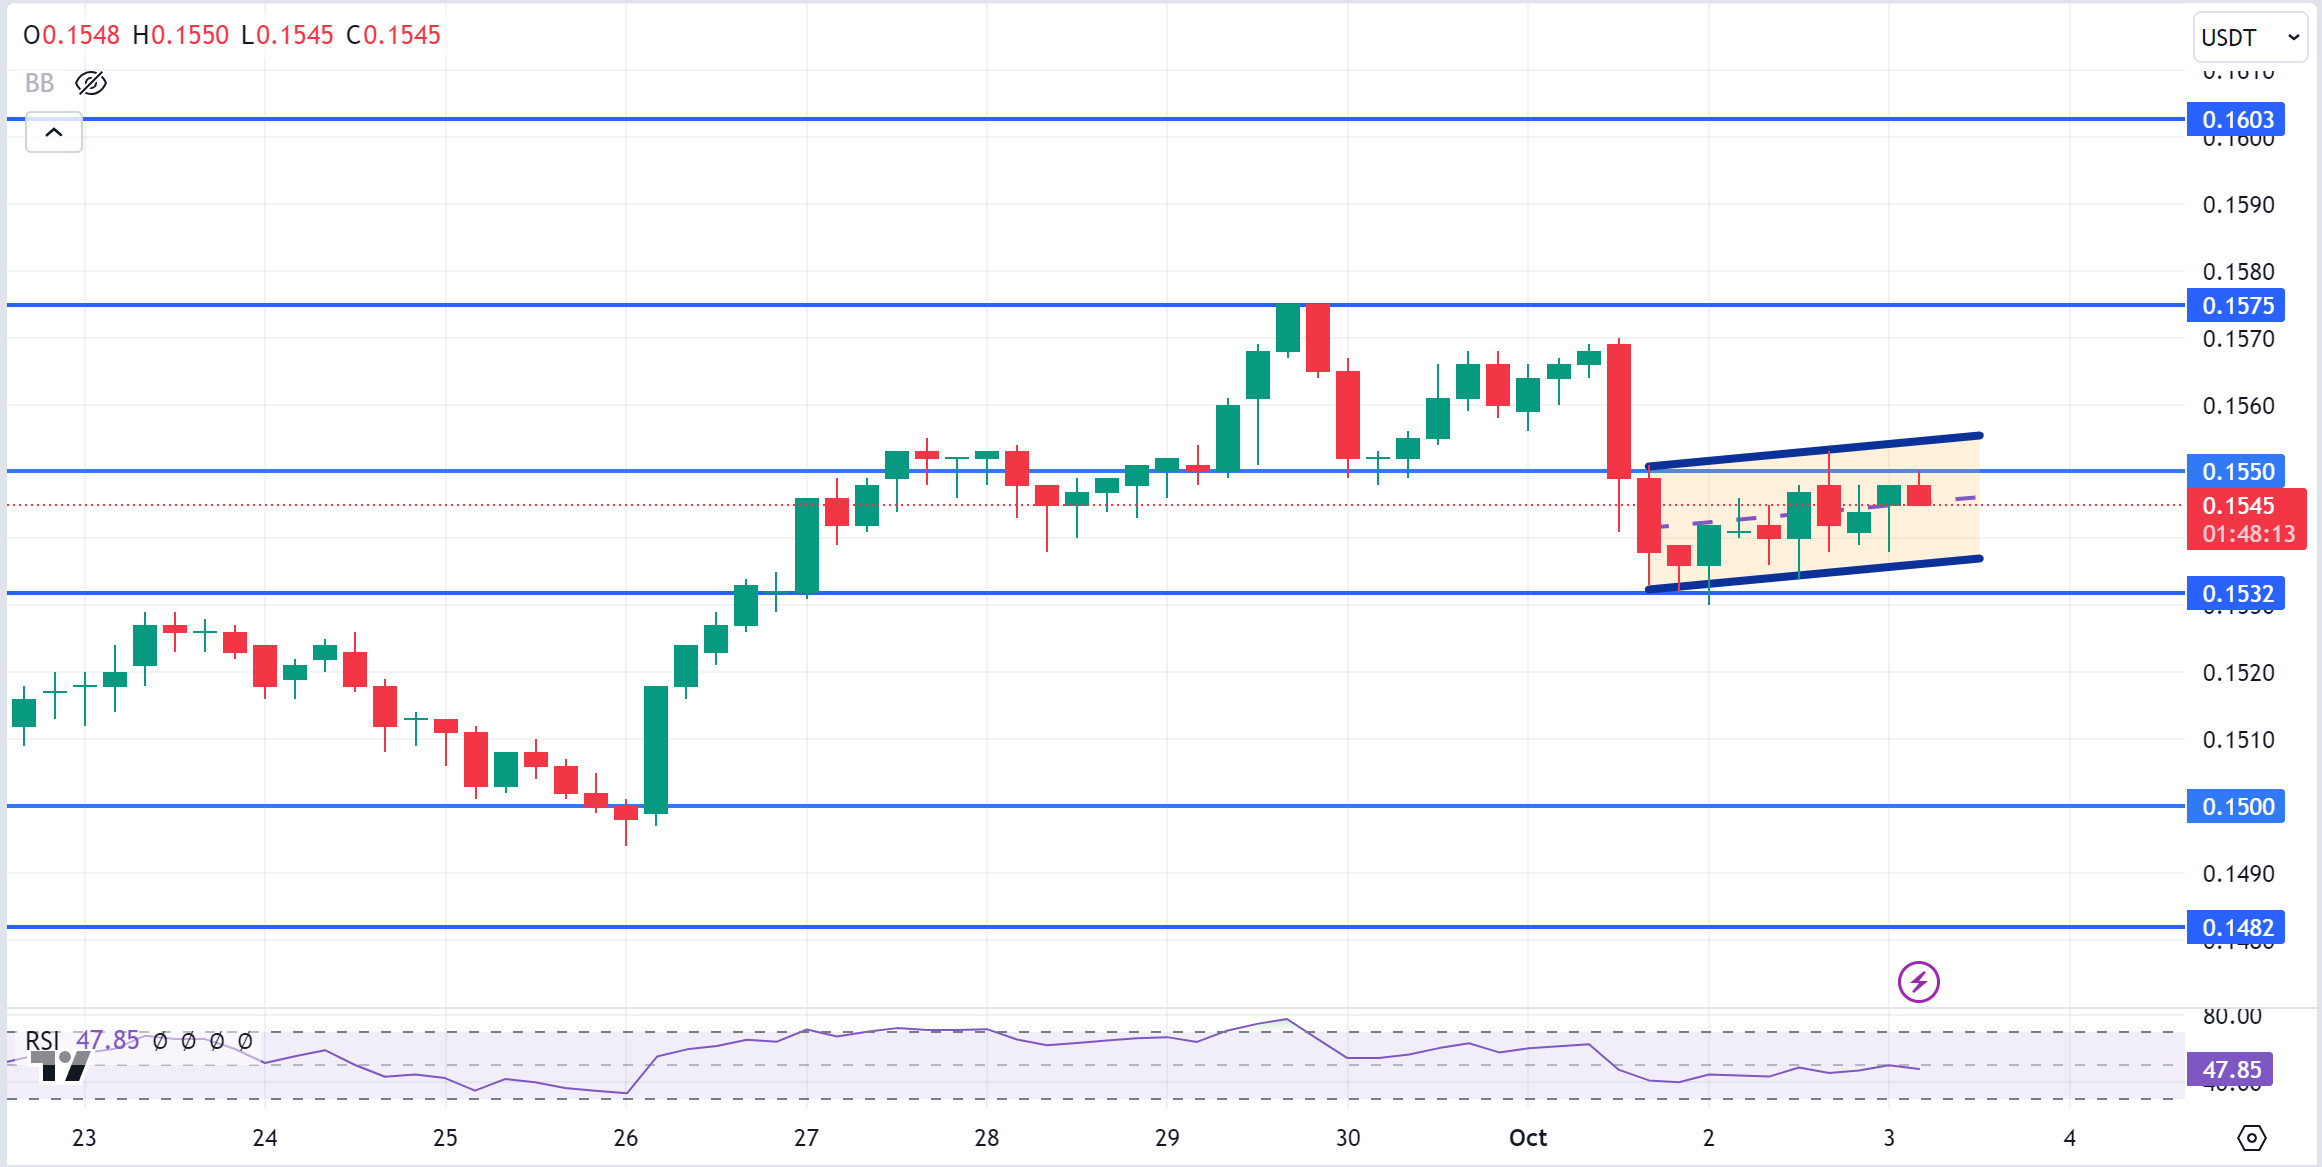
TRX, which started yesterday at 0.1536, rose slightly during the day and closed the day at 0.1544. Today, there are unemployment benefit claims, services purchasing managers index and ISM non-manufacturing purchasing managers index data to be released by the US, but the market is currently focused on news from the Middle East. The escalation of tension may be an important reason for increased sales. TRX, which is currently trading at 0.1545, is moving in an ascending channel on the 4-hour chart. It is in the middle band of the ascending channel and can be expected to move slightly up from its level with the RSI 47 value. In such a case, it may test the 0.1550 resistance. If selling pressure increases with negative news flows from the Middle East, it may test 0.1532 support. As long as TRX stays above 0.1482 support, the desire to rise may continue. If this support is broken downwards, sales can be expected to increase.
Supports 0.1532 – 0.1500 – 0.1482
Resistances 0.1550 – 0.1575 – 0.1603
XRP/USDT
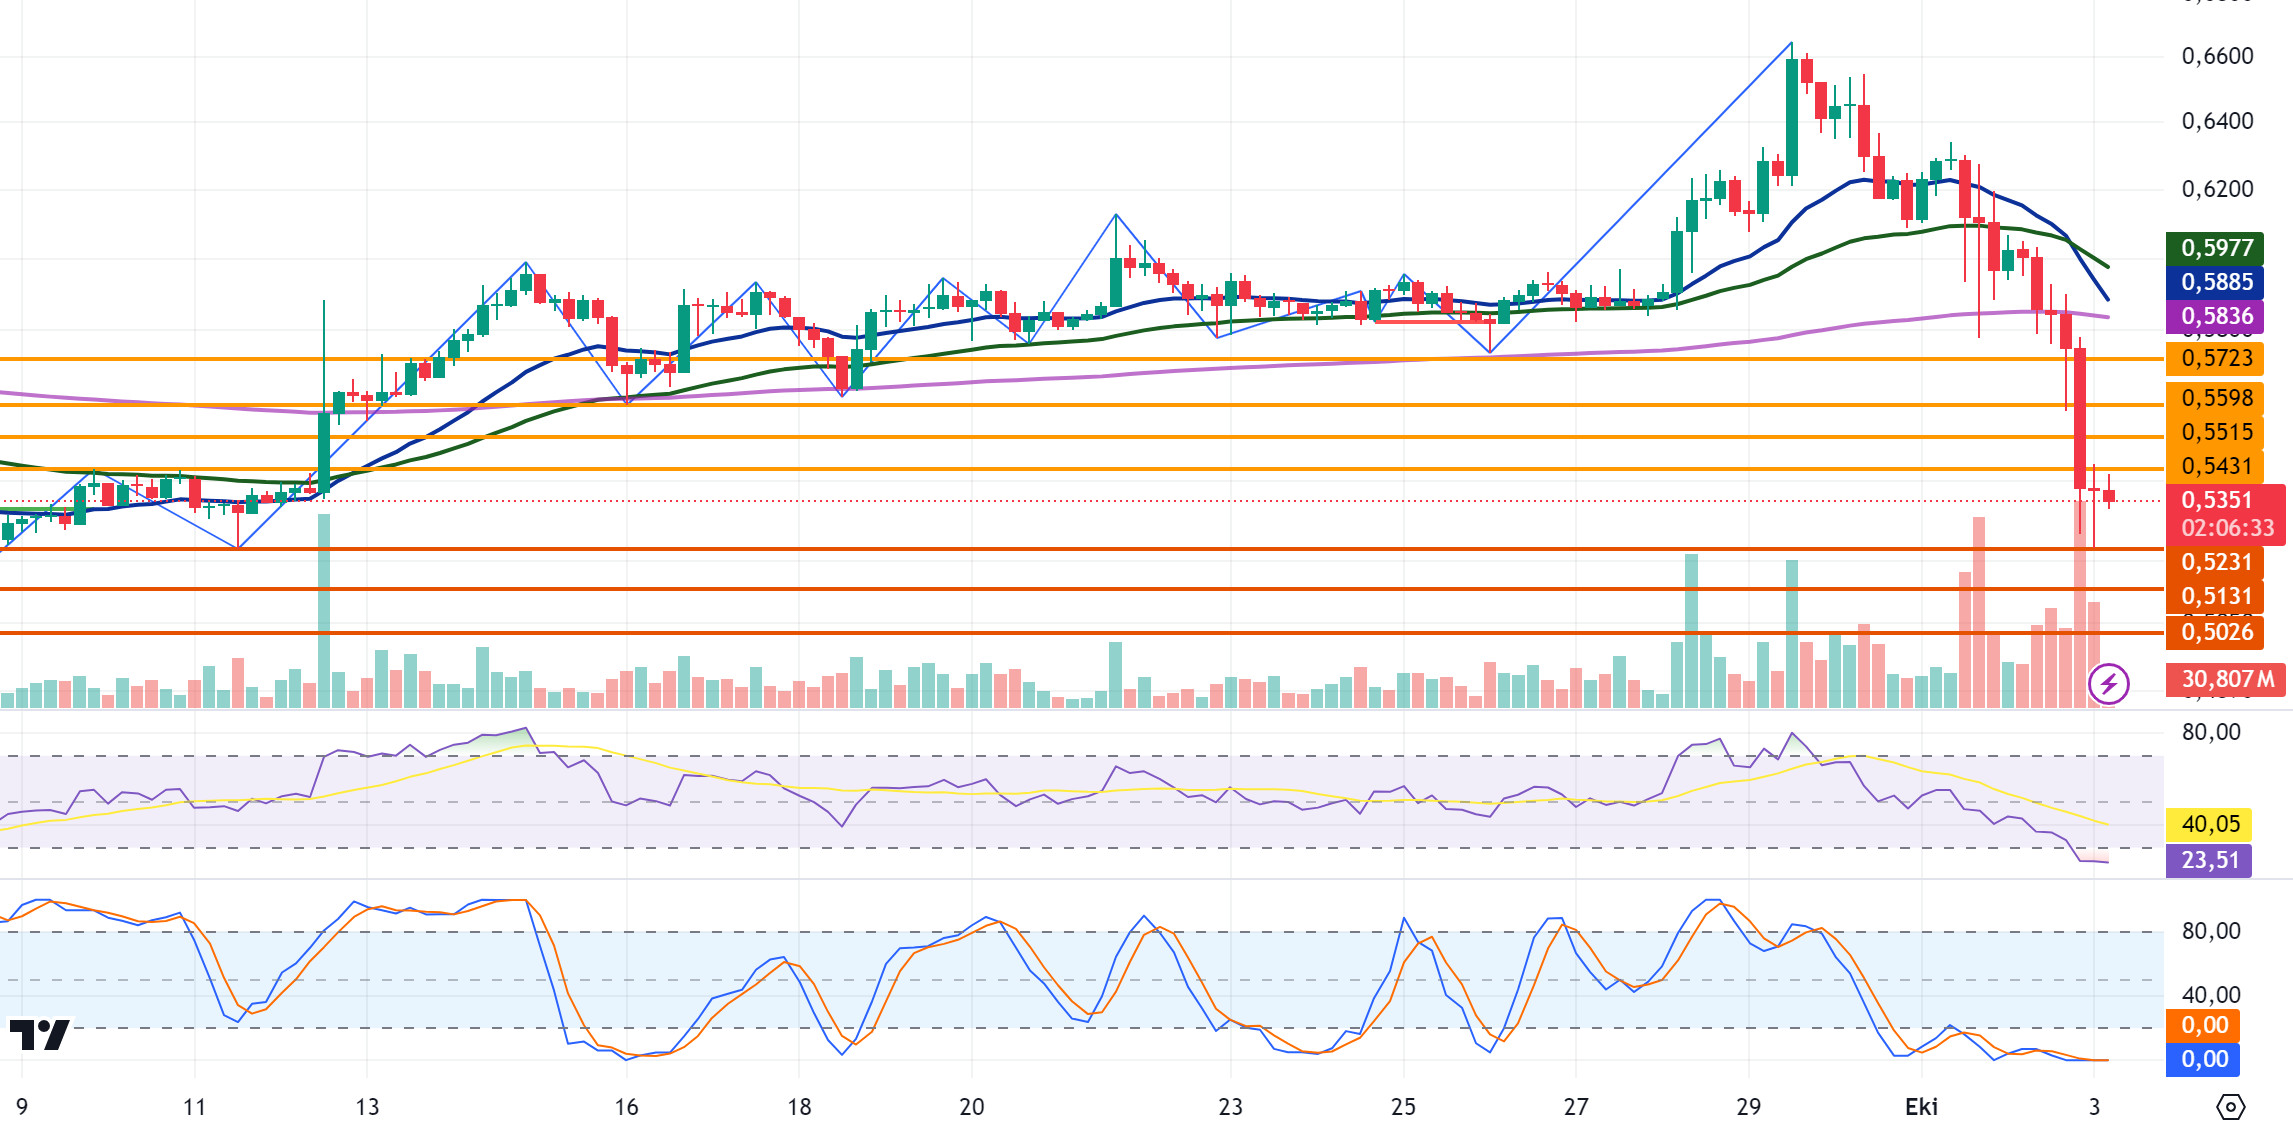
XRP, which declined yesterday under the influence of the ongoing tension in the Middle East, deepened the decline with the SEC’s appeal for the court decision of the case with the SEC and closed the day at 0.5379, losing 9.8% on a daily basis. In the 4-hour analysis, XRP, which fell sharply with the news of the appeal at the closing candle in the closing candle, continued its decline in the opening candle today. XRP, which fell to 0.5229, recovered with the incoming purchases and is currently trading at 0.5351. If the decline continues in XRP, where negative developments are experienced one after another, it may test support levels of 0.5231-0.5131-0.5026. It may test the resistance levels of 0.5431-0.5515-0.5598 if it rises with the reaction purchases that may come after the fall and the positive developments that may come from the XRP community and investors.
XRP is in a downtrend and negative developments are causing the decline to deepen. In this context, it can be traded in the 0.50-0.52 band with the deepening of the decline in the process when it is traded below the 0.54 level and may offer a short trading opportunity in this process. In its decline, it may rise to 0.54 level again with the purchases that may come at 0.52 level and may offer a long trading opportunity in this process.
EMA20 (Blue Line) – EMA50 (Green Line) – EMA200 (Purple Line)
Supports 0. 5231 – 0. 5131 – 0.5026
Resistances 0.5431 – 0. 5515 – 0.5598
DOGE/USDT
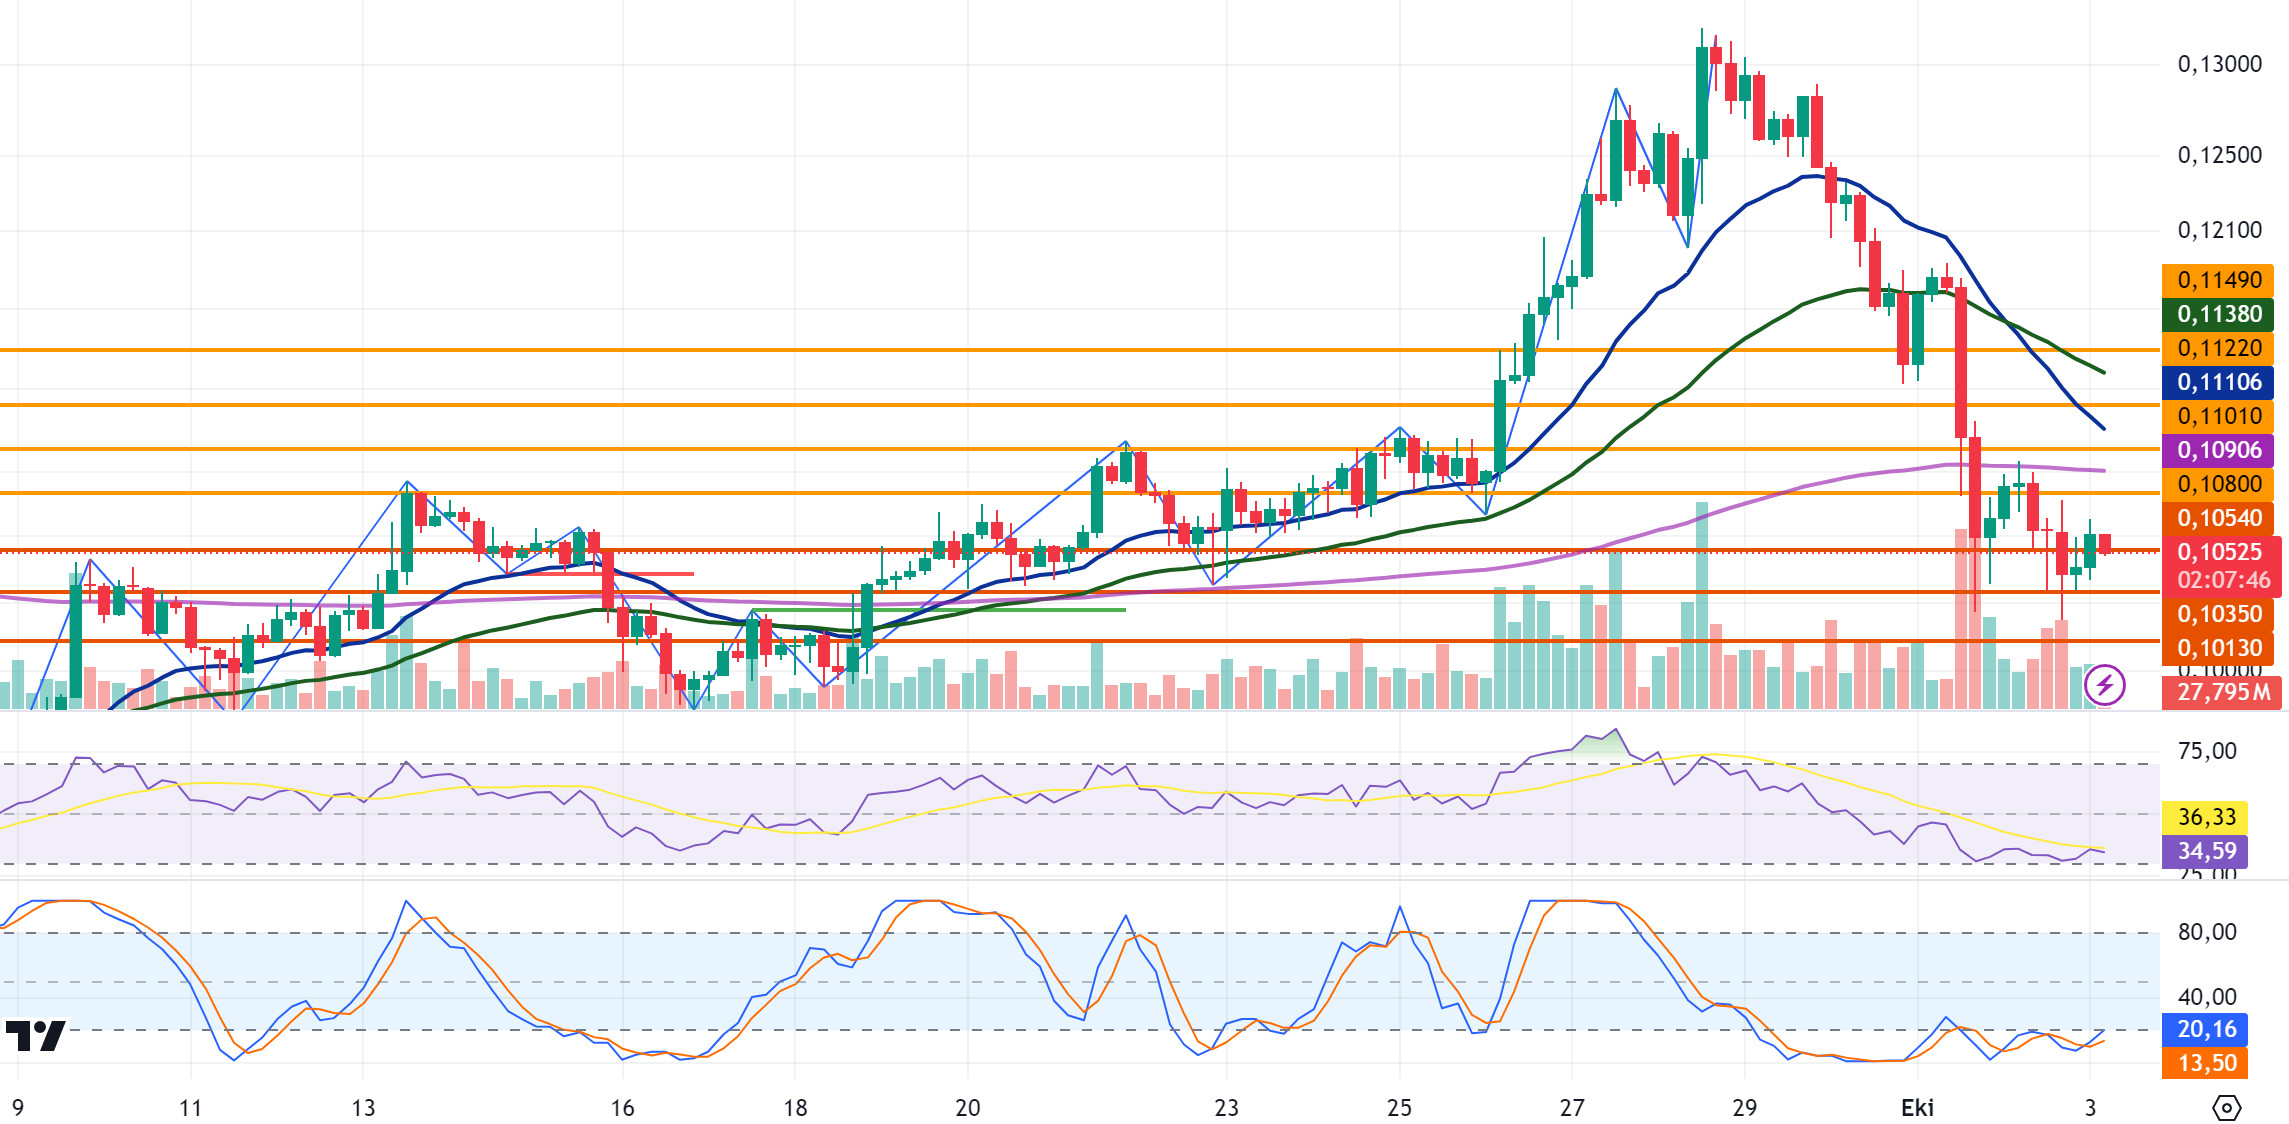
The negative impact of the tension in the Middle East on the crypto market was also seen on DOGE and the daily close was realized at 0.1045 with a 2% depreciation yesterday. In the 4-hour analysis, after testing the EMA200 level with the rise it experienced during the recovery process today, it could not break it and fell to 0.1021. In the 4-hour analysis, a rise was observed in the closing candle yesterday and the opening candle today, and if this rise continues, it may test the resistance levels of 0.1080-0.1101-0.1122. If the rise gives way to a decline, DOGE, which is in a downtrend as in the crypto market in general, may test support levels of 0.1054-0.1035-0.1013 in its decline.
If DOGE starts to rise, it may decline with possible sales from the EMA200 and 0.1080 resistance levels and may offer a short trading opportunity. If these levels are broken and the uptrend continues, it may offer a long trading opportunity.
EMA20 (Blue Line) – EMA50 (Green Line) – EMA200 (Purple Line)
Supports 0.1054 – 0.1035 – 0.1013
Resistances 0.1080 – 0.1101 – 0.1122
DOT/USDT
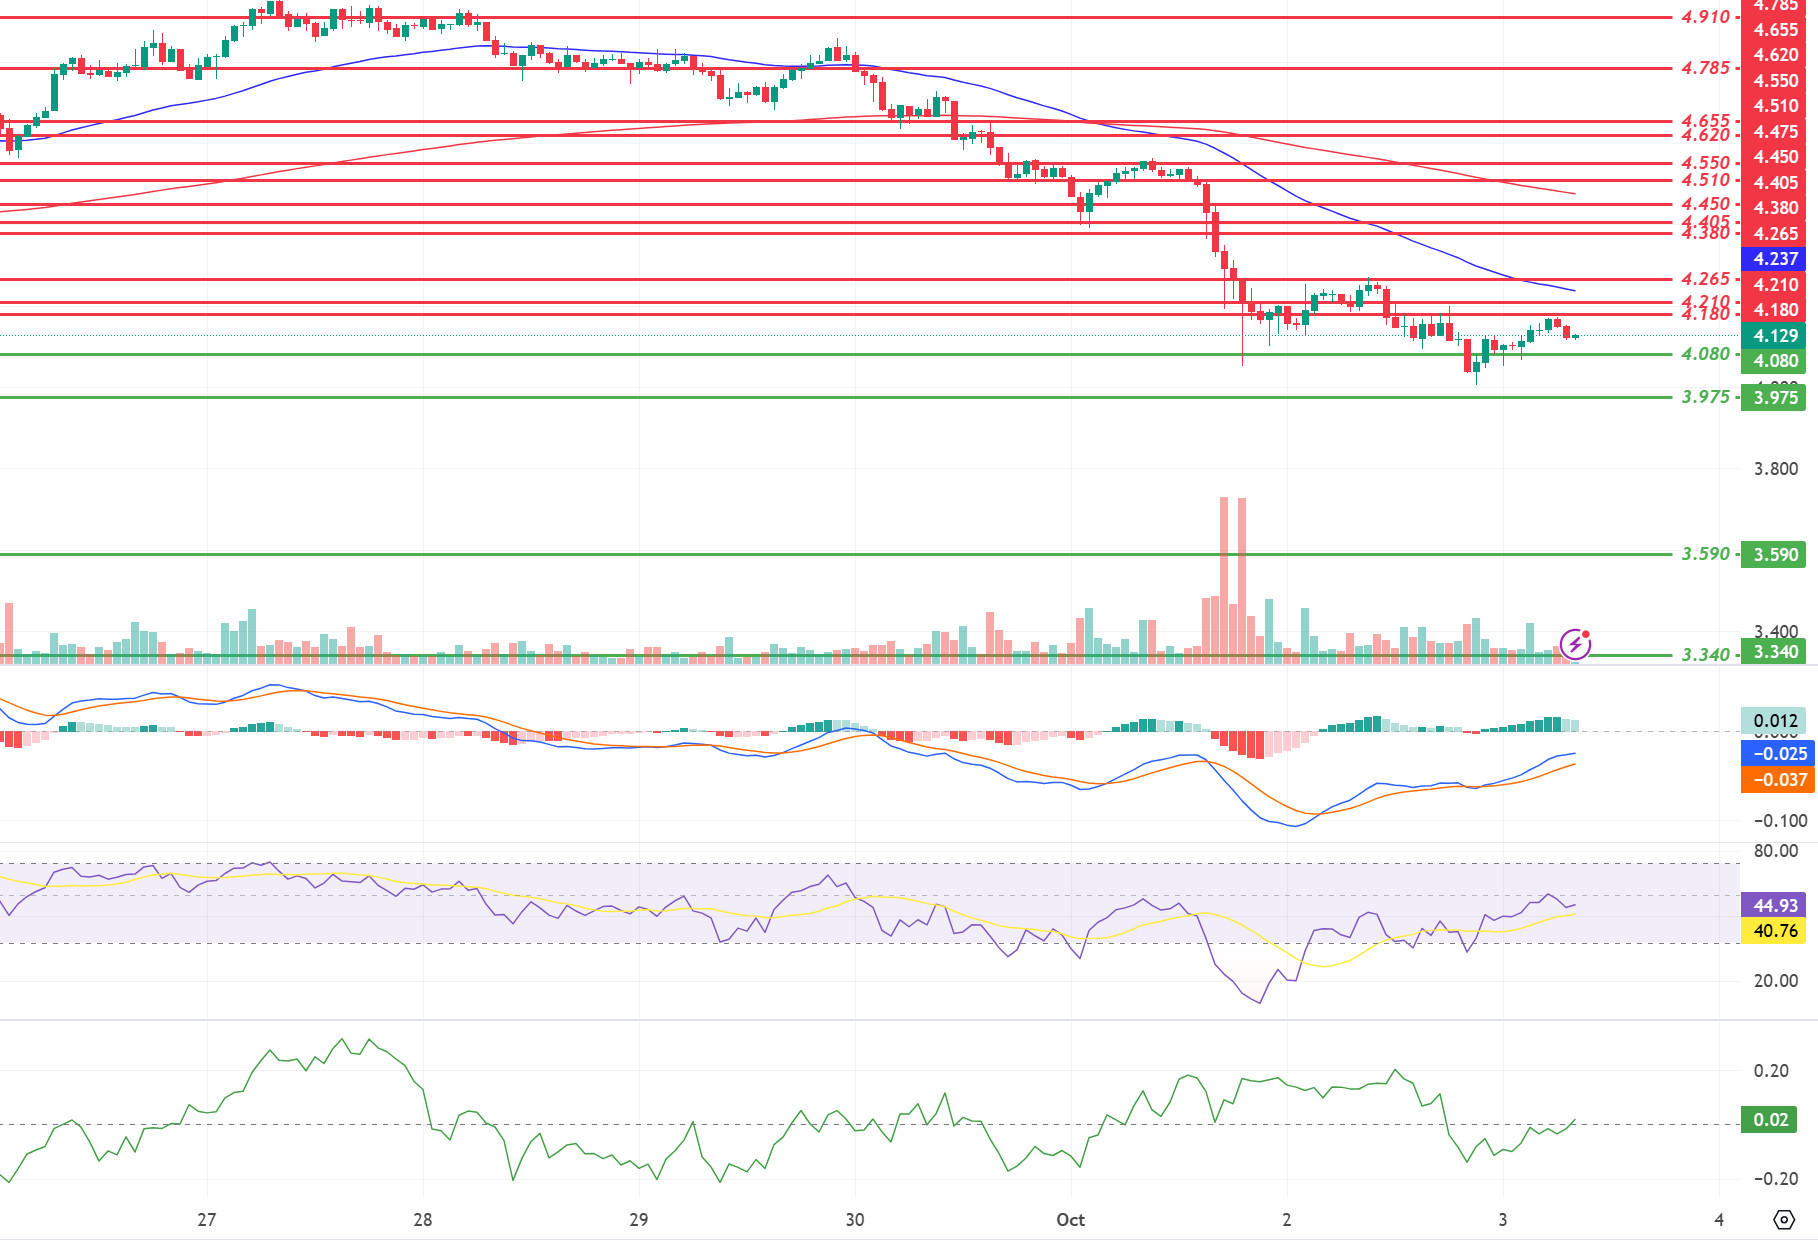
Polkadot (DOT) closed below the previous day’s closing price of 4,154. Reacting from 4,080 levels, the price rose to 4,180 resistance and seems to have been rejected from these levels. According to the CMF oscillator, buyer pressure seems stronger. If the price maintains above 4,180, it may move fast towards 4,210 and 4,265 resistance levels. On the other hand, according to the MACD oscillator, we see that the buying pressure decreased compared to the previous hour. If the price persists below the 4,180 level with the decrease in buying pressure, there may be a retracement to the next support level of 4,080.
(Blue line: EMA50, Red line: EMA200)
Supports 4.080 – 3.975 – 3.590
Resistances 4.180 – 4.210 – 4.265
SHIB/USDT
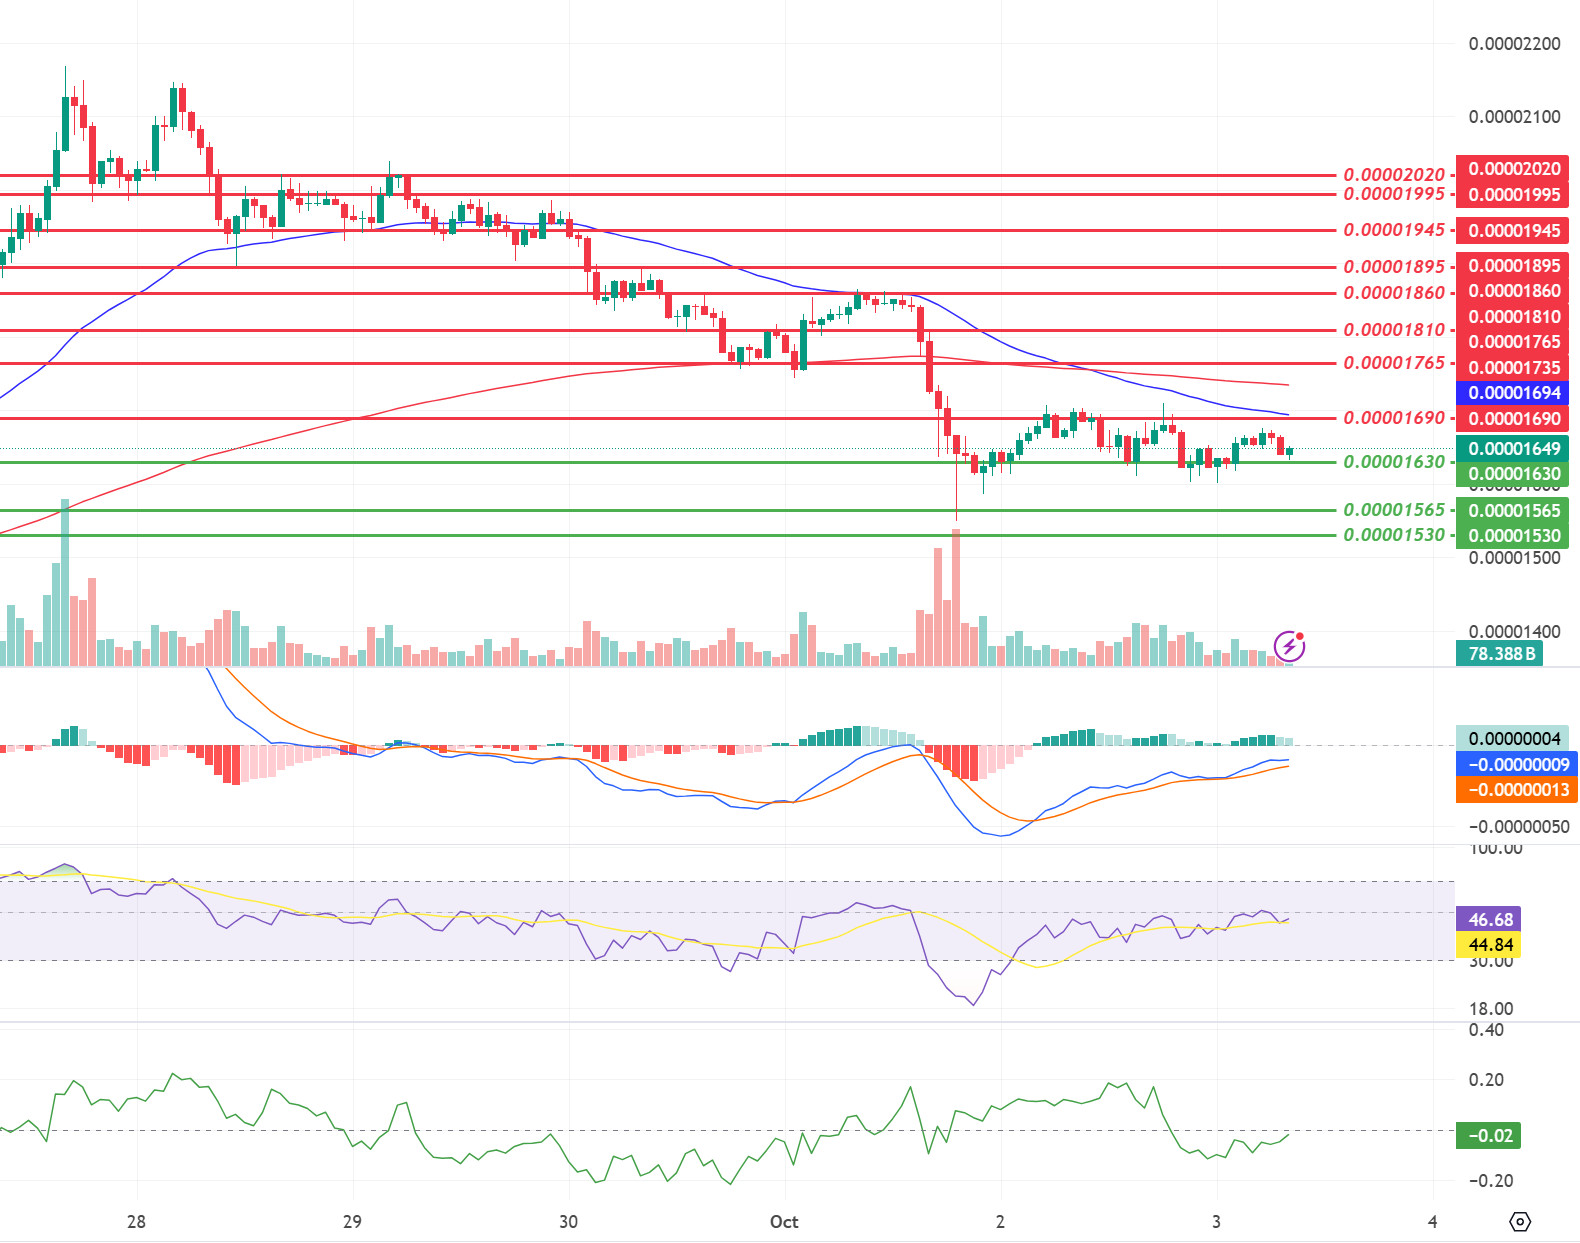
When we examine the Shiba Inu (SHIB) chart, the price seems to be persistent above the 0.00001630 support level. Positive mismatch continues on the RSI. Unless the price falls below 0.00001630, its first target may be 0.00001690 levels. On the other hand, if the price falls below 0.00001630, we can expect a reaction from 0.00001565 levels.
(Blue line: EMA50, Red line: EMA200)
Supports 0.00001630 – 0.00001565 – 0.00001530
Resistances 0.00001690 – 0.00001765 – 0.00001810
LEGAL NOTICE
The investment information, comments and recommendations contained herein do not constitute investment advice. Investment advisory services are provided individually by authorized institutions taking into account the risk and return preferences of individuals. The comments and recommendations contained herein are of a general nature. These recommendations may not be suitable for your financial situation and risk and return preferences. Therefore, making an investment decision based solely on the information contained herein may not produce results in line with your expectations.


