MARKET SUMMARY
Latest Situation in Crypto Assets
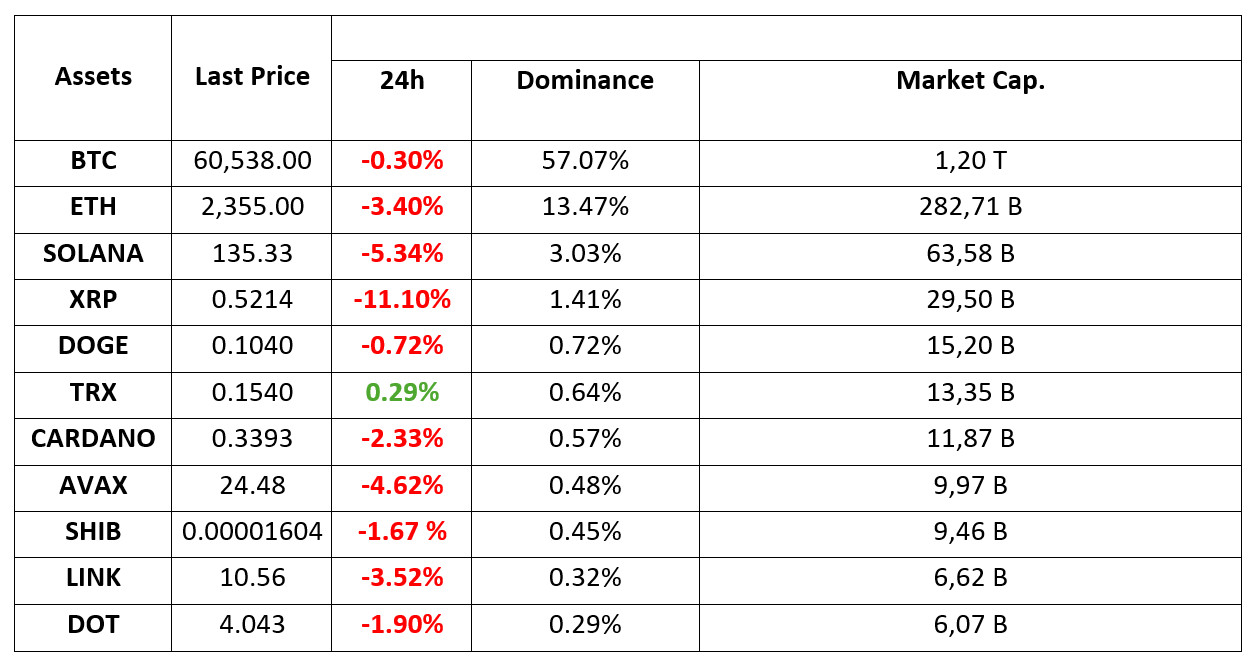
*Prepared on 3.10.2024 at 14:00 (UTC)
WHAT’S LEFT BEHIND
Metaplanet also started trading with Bitcoin
Metaplanet, the company that started buying Bitcoin this year and declared the largest cryptocurrency as a reserve asset, sold option contracts. The company earned 23.9 BTC from this sale and increased the total number of Bitcoins to 530.7.
Downgrade may come” from Standard Chartered
The heightened geopolitical tensions after Iran’s attack on Israel last night were also included in the latest report by Standard Chartered analysts. Analysts said that the declines could increase further and pointed to the end of the week.
HIGHLIGHTS OF THE DAY
Important Economic Calender Data

INFORMATION
*The calendar is based on UTC (Coordinated Universal Time) time zone. The economic calendar content on the relevant page is obtained from reliable news and data providers. The news in the economic calendar content, the date and time of the announcement of the news, possible changes in the previous, expectations and announced figures are made by the data provider institutions. Darkex cannot be held responsible for possible changes that may arise from similar situations.
MARKET COMPASS
“Anxious” mood continues in the markets due to the developments in the Middle East. European indices and US futures contracts are in the red. The dollar index is looking to continue its rise and the pressure on digital assets has not eased.
Investors continue to monitor the rising tensions between Iran and Israel. On the other hand, macro indicators are being monitored ahead of the critical US employment data to be released tomorrow. Unemployment Claims data released today showed that 225 thousand Americans applied for unemployment benefits last week. The expectations in the markets were around 222 thousand. There was no major change in asset prices after the data, which was not far from the forecasts. However, the PMI figures for the service sector will be monitored later in the day and will provide information about the health of the US economy. According to the CME FedWatch Tool, the probability of the US Federal Reserve cutting
interest rates by 25 basis points at its November meeting is around 62%.
The headlines that have dominated the prices of financial instruments in recent days have been the developments regarding geopolitical risks. Therefore, news from the Middle East will again be closely monitored. It is also useful to keep the US data under scrutiny. We are far from seeing signs of a recovery in digital assets and this is unlikely to happen for the time being without the news flow that the risks we mentioned have diminished.
TECHNICAL ANALYSIS
BTC/USDT
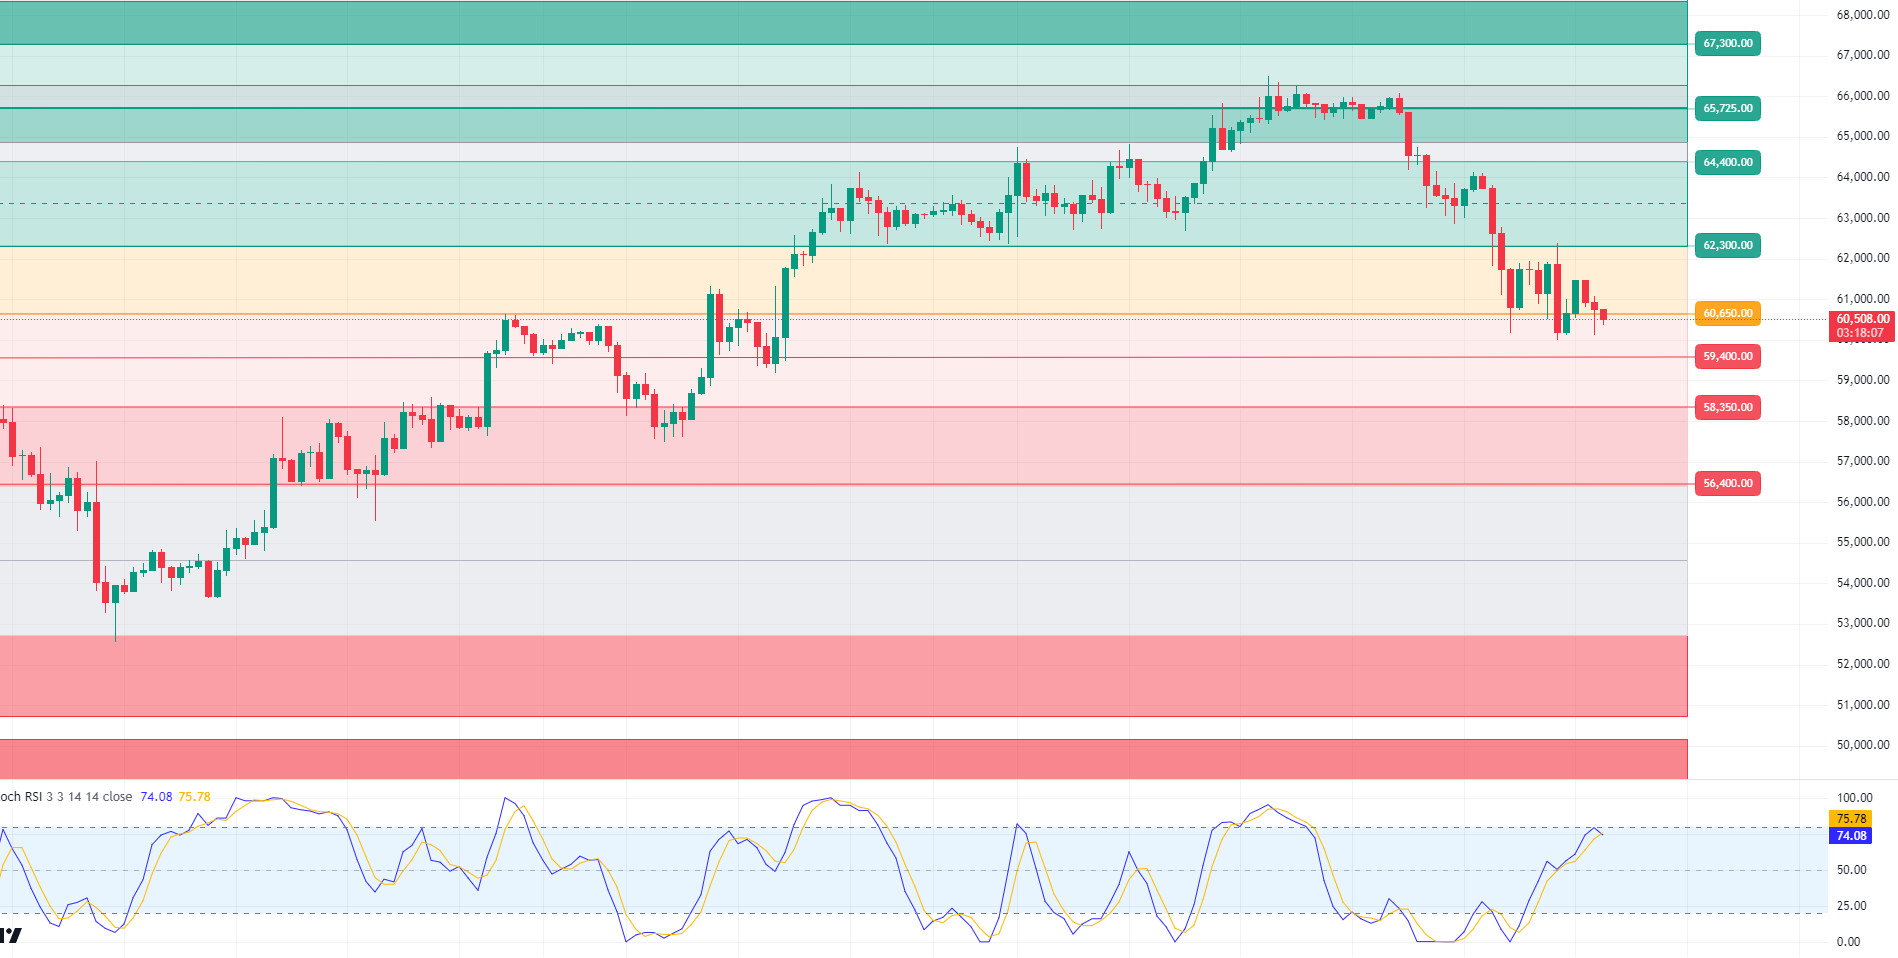
Bitcoin at critical support! Recent geopolitical risks directly affect global financial markets and crypto markets. Israel’s threat of retaliation against Iran has exacerbated these risks. Such tensions may cause investors to turn to safe-haven assets (such as gold) and stay away from risky assets (stocks and cryptocurrencies). Indeed, the recent rises in assets such as gold and Brent oil and declines in US equities summarize this situation. In the medium term, such tensions could negatively affect overall market sentiment and lead to selling pressure in the crypto market. In the BTC 4-hour technical analysis, BTC, which draws a similar picture with the previous price movements, continues to be priced in a downtrend from 65,000 levels. Closes below the 60,650 level, which is the support level we have frequently mentioned before, may lead us to retest below 60,000 levels. In the event of a break of 59,400, the first support level that we will encounter in a bearish scenario, the 58,350 level comes to the agenda. BTC, which is in the middle of geopolitical tensions, should monitor its closes above 61,200 and 62,300 respectively in case of a possible recovery.
Supports 60,650 – 59,400 – 58,350
Resistances 62,300 – 64,400 – 65,725
ETH/USDT
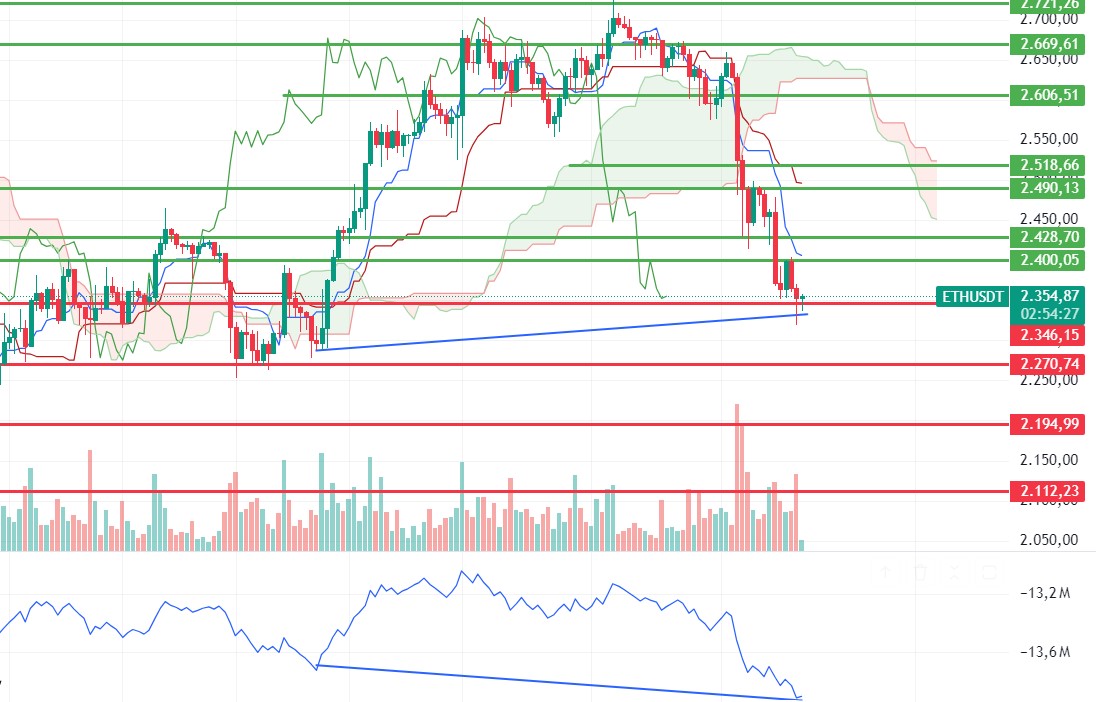
Ethereum pins below the 2,346 support after being rejected for failing to break the 2,400 level during the day. Momentum and CMF look negative, while RSI has failed to break out of oversold territory. The positive mismatch formed on OBV stands out. We see that locked Ethereums on the Restaking platform Eigenlayer are unclaimed, creating a selling pressure on Dexes. Under these circumstances, Ethereum, which needs to close above the 2,400 level for a positive trend to start again, may experience sharp declines to 2,270 main support if it cannot hold at 2,346.
Supports 2,346 – 2,270 – 2,194
Resistances 2,400 – 2,428 – 2,490
LINK/USDT
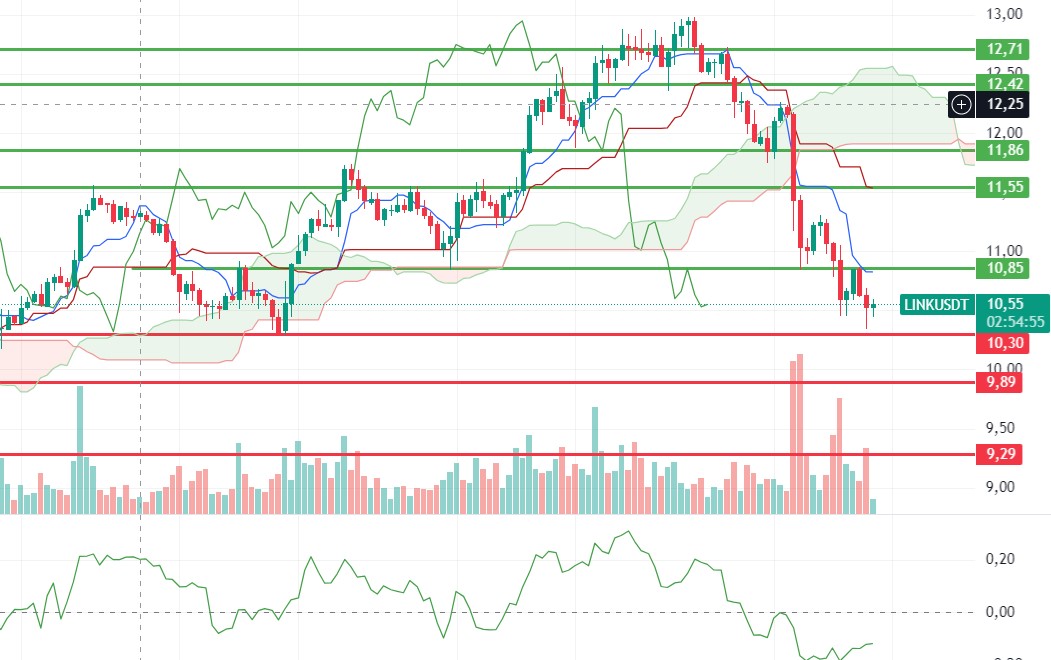
As predicted, the volume sales for LINK, which fell sharply after being rejected at the level of 10.85, indicate that there may be a further decline for a while. Especially the sharp price movements on Ethereum and Ethereum Betas and the decrease in transactions on the Ethereum network with the recent decline stand out as the factors that affect LINK the most. At the same time, it may look positive again with the break of the tenkan level of 10.85 on volume. However, the negative mismatch in CMF and the negative structure in RSI strengthen the possibility of another decline.
Supports 10.85 – 10.30 – 9.29
Resistances 11.55 – 11.86 – 12.42
SOL/USDT
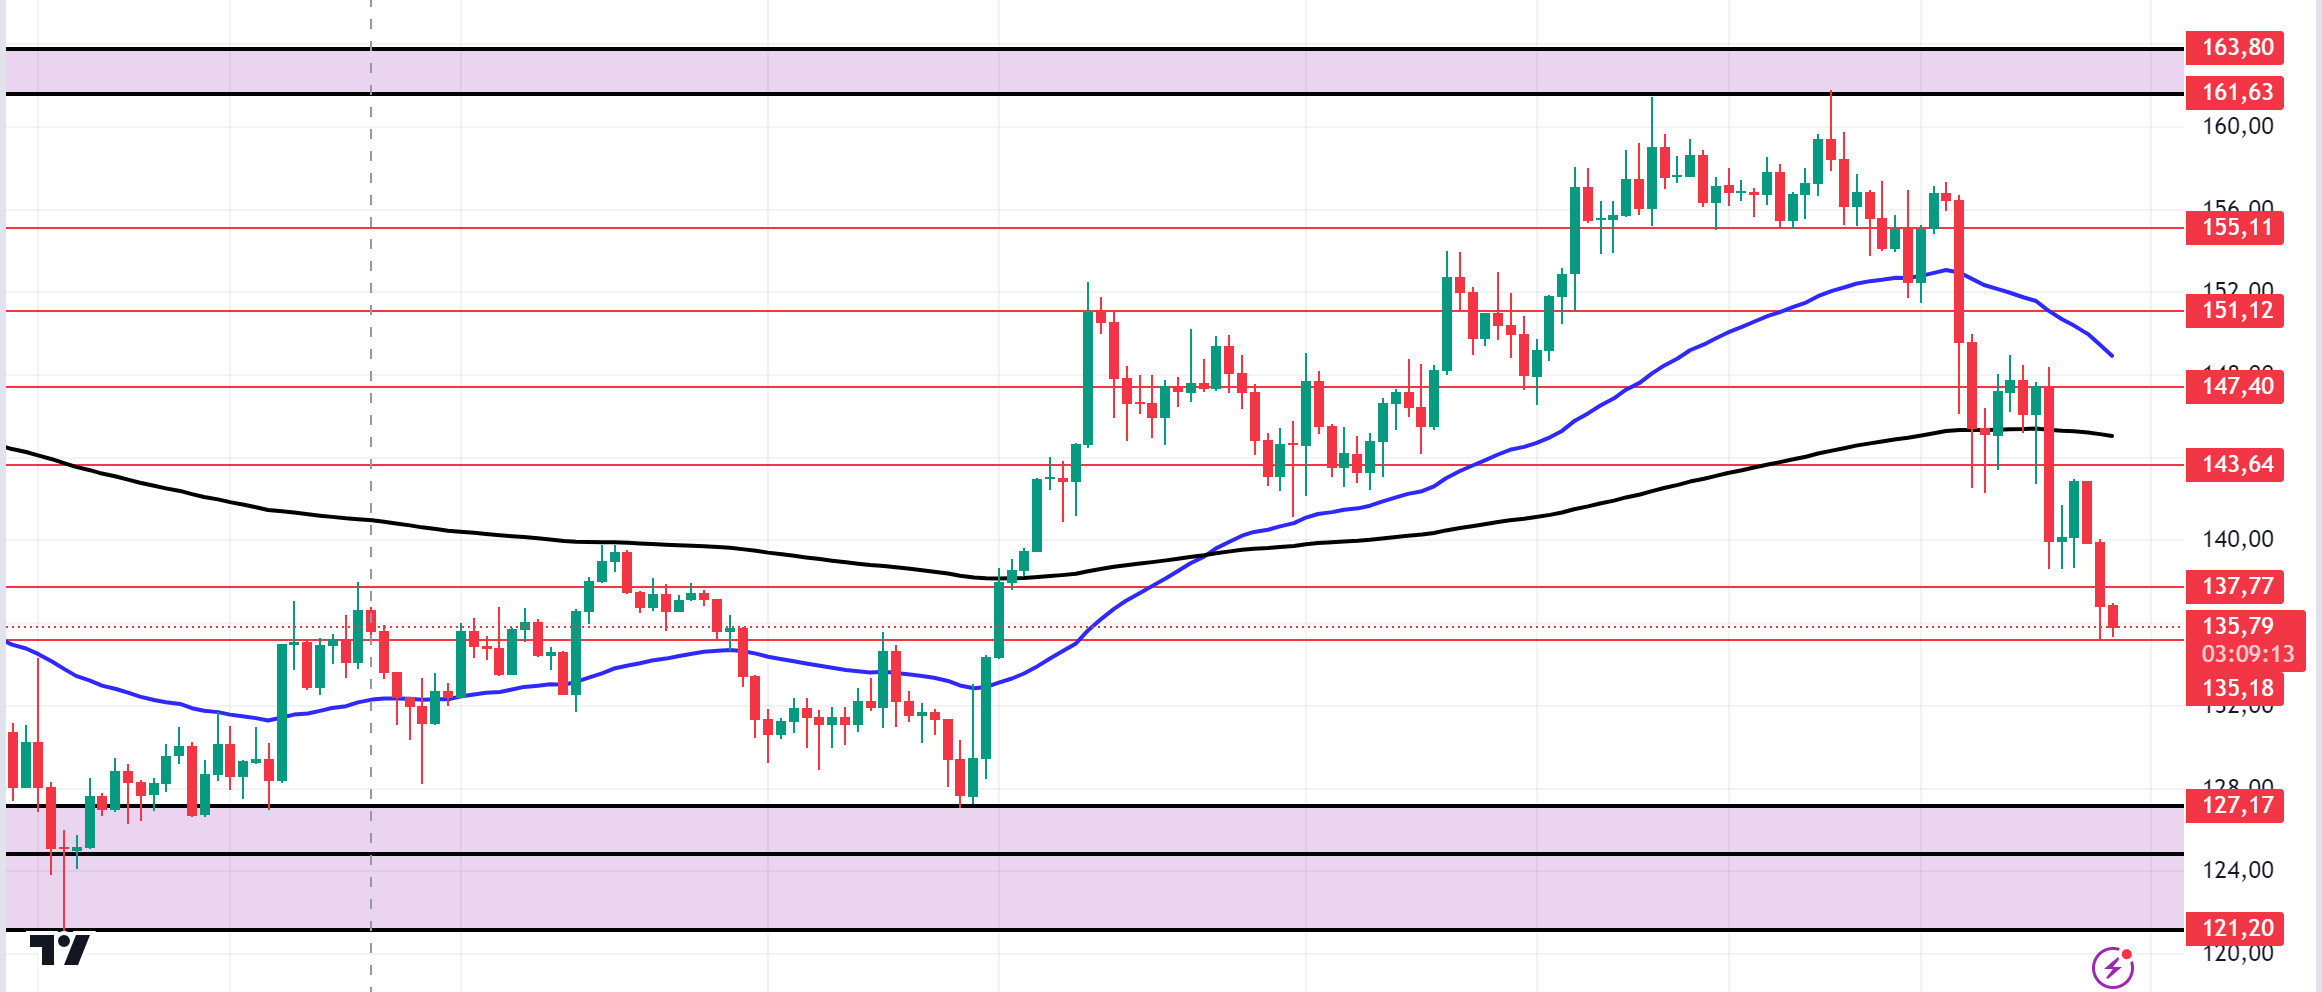
Today, non-manufacturing purchasing managers’ index from the US will be among the upcoming data. In the Solana ecosystem, Solayerlabs, in partnership with OpenEdenLabs, launched sUSD, the first yielding USD on Solana, offering US Treasury Bond interest and restructuring features. Technically, the market has been uneasy since our analysis in the morning. The price is unable to hold its level. The fear and greed index is 36. SOL is about to test 135.18, an important resistance level, down 3.60%. The levels 137.77 – 143.64 appear as the first resistance levels in the rises due to both macroeconomic conditions and innovations in the Solana ecosystem. If it rises above these levels, the rise may continue. In the sales that investors will make due to political and macroeconomic conditions, the support levels of 135.18 – 127.17 should be followed. If the price comes to these support levels, a potential bullish opportunity may arise.
Supports 135.18 – 127.17 – 121.20
Resistances 137.77 – 143.64 – 147.40
ADA/USDT
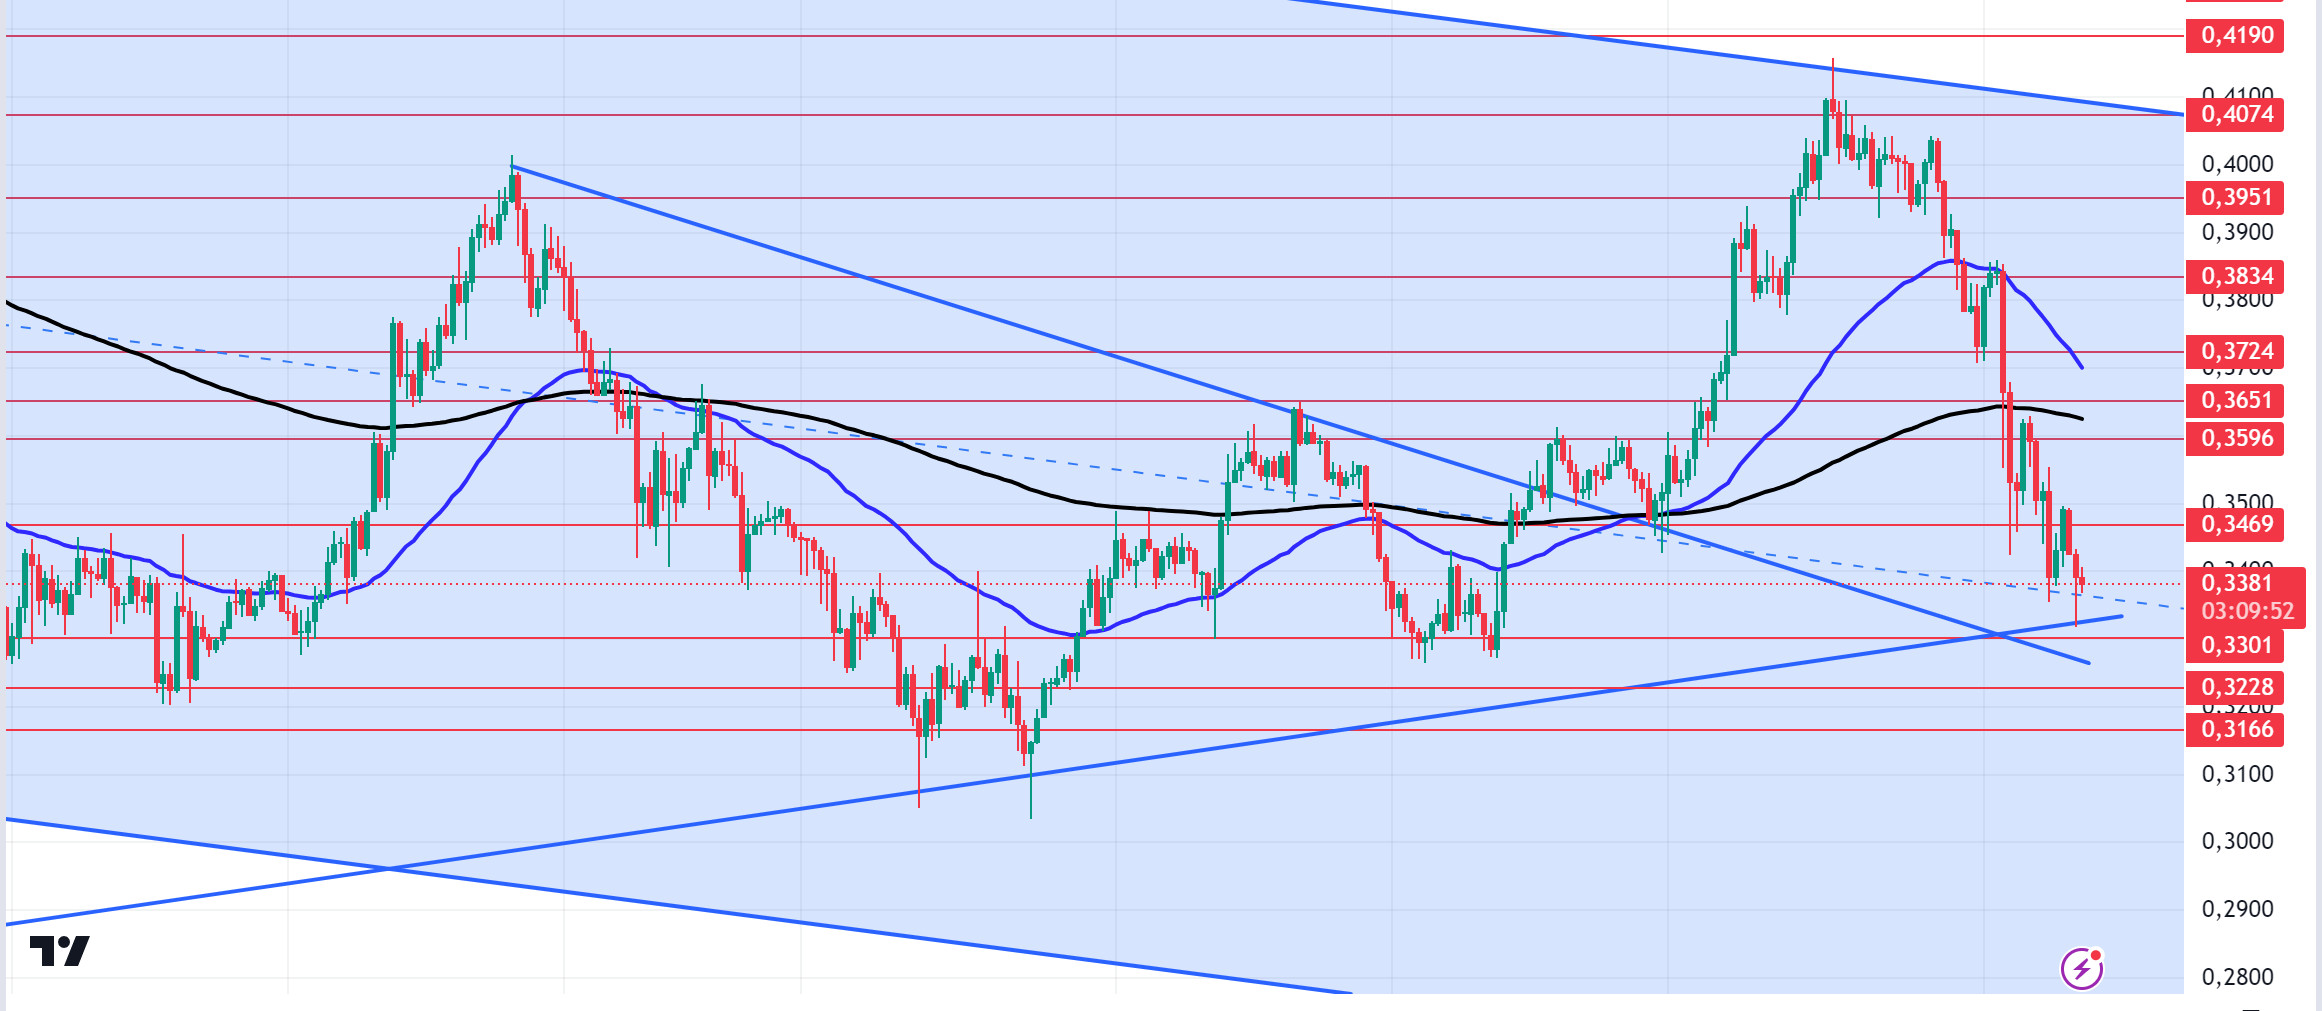
Today, the non-manufacturing purchasing managers index from the US will be among the data to be released. The price cannot maintain its level. Technically, when we look at it, it showed a slight rise by testing the support formed since August 6. The 0.3301 level stands out as a strong support in the retracements to be experienced with possible political and macroeconomic news. If the positive mood in the ecosystem continues and the Middle East tension decreases, 0.3596 – 0.3651 levels appear as a strong resistance. In the continuation of the fear in the market, 0.3301 – 0.3166 levels can be followed as support. If it breaks these levels, the decline may deepen.
Supports 0.3301 – 0.3228 – 0.3166
Resistances 0.3469 – 0.3596 – 0.3651
AVAX/USDT
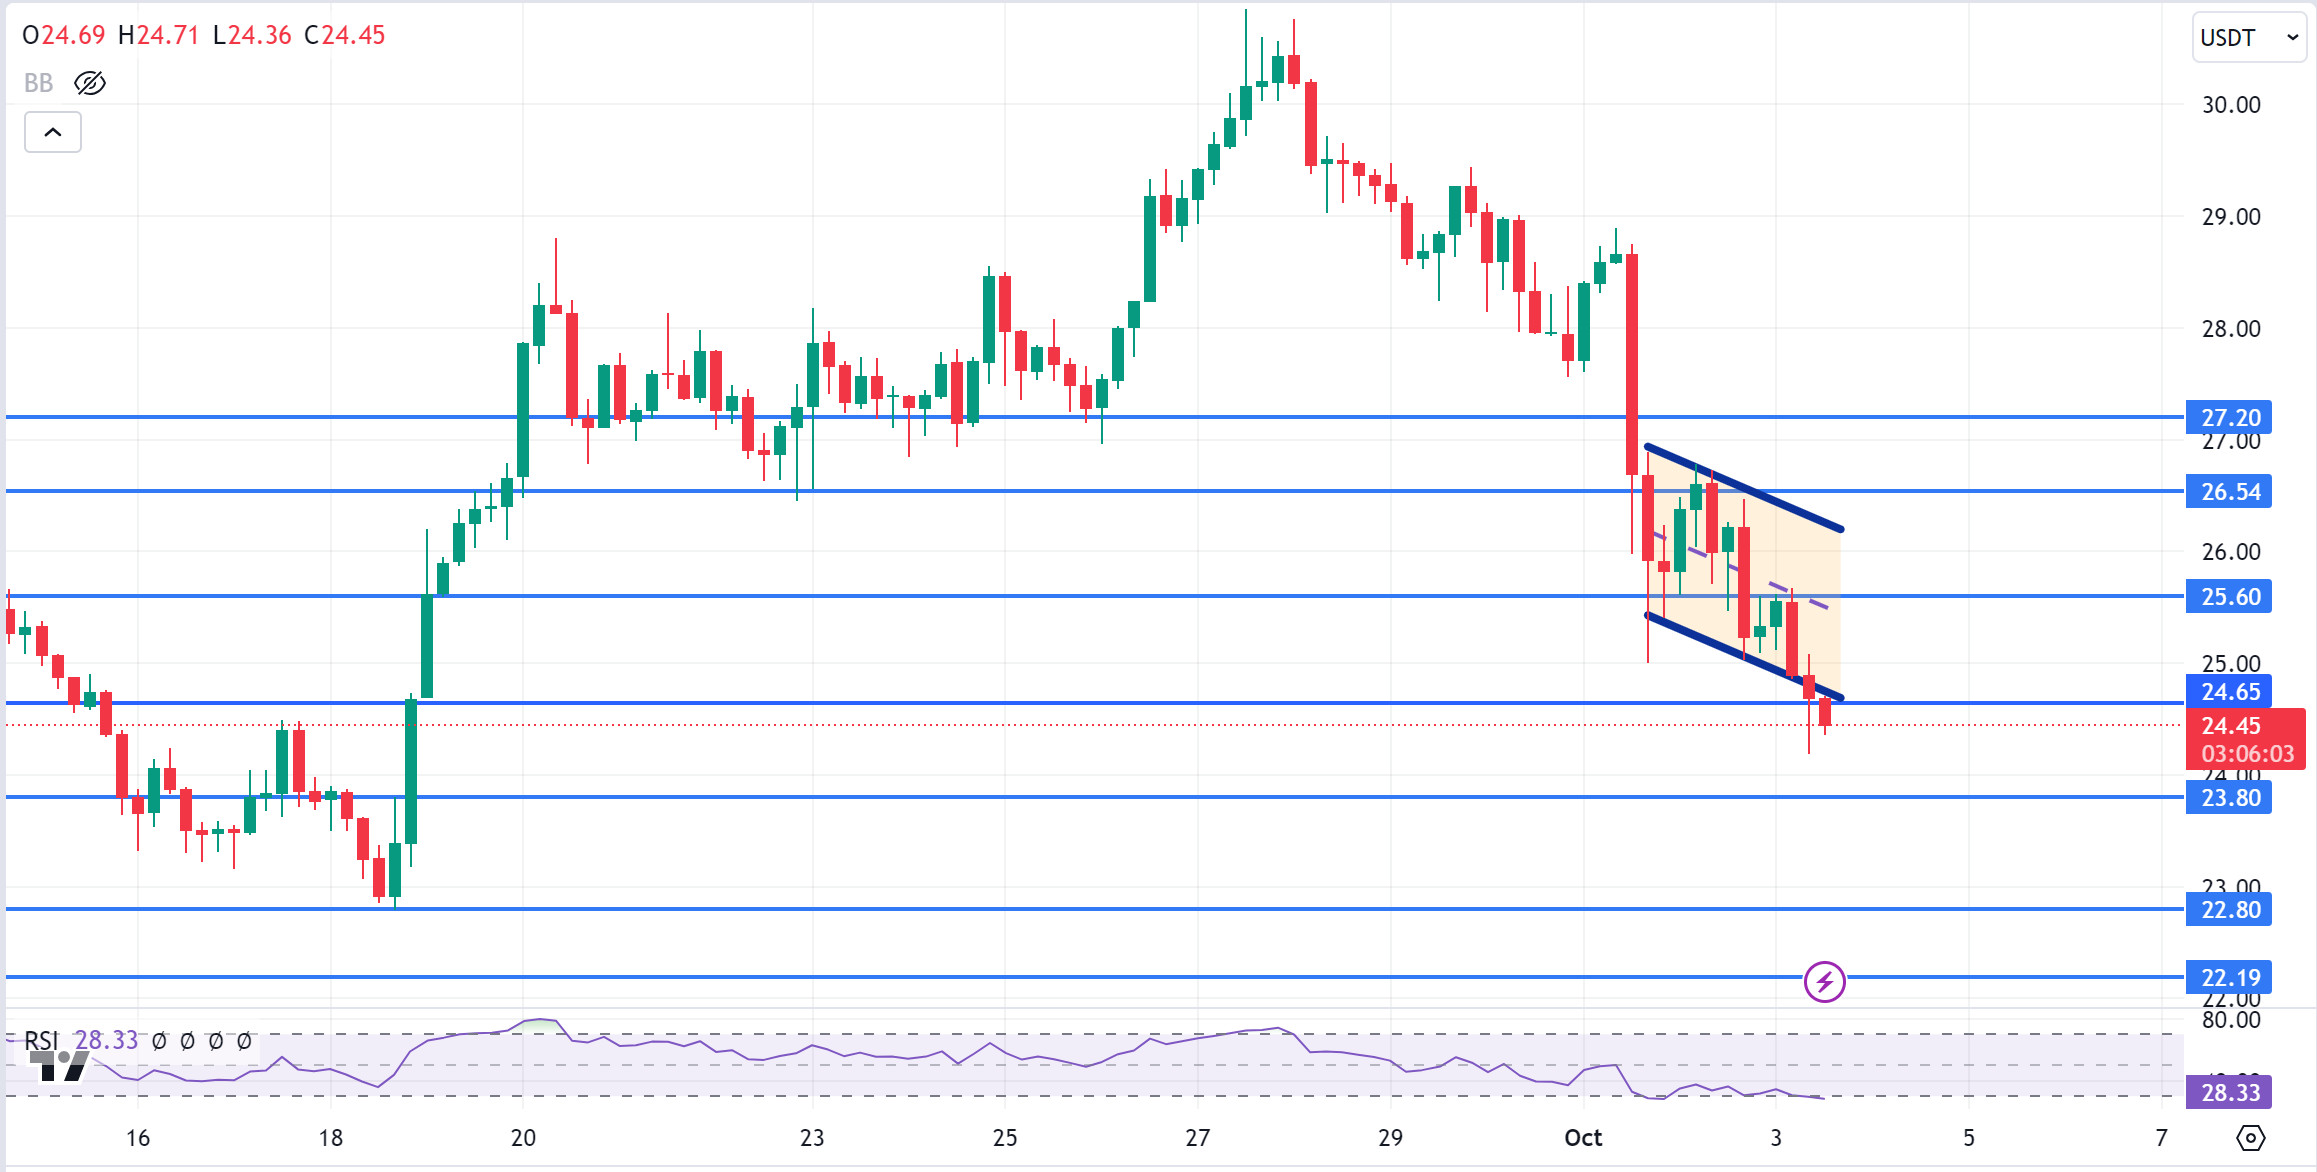
AVAX, which opened today at 25.33, fell about 3.5% during the day and closed the day at 24.45. Today, US unemployment claims data was announced. Since it was announced close to the expectation, it was seen that it did not affect the market much.
On the 4-hour chart, it is trying to break the falling channel downwards. RSI is in oversold territory with a value of 28. It is trying to break 24.65 support and can be expected to move to the channel mid-band with a buying reaction from here. In such a case, it may test the 25.60 resistance. However, if there is news of escalating tension from the Middle East, selling pressure increases and it may break 24.65, which is a strong support. As long as it stays above 24.65 support during the day, the desire to rise may continue. With the break of 24.65 support, sales may increase.
Supports 24.65 – 23.80 – 22.80
Resistancs 25.60 – 26.54 – 27.20
TRX/USDT
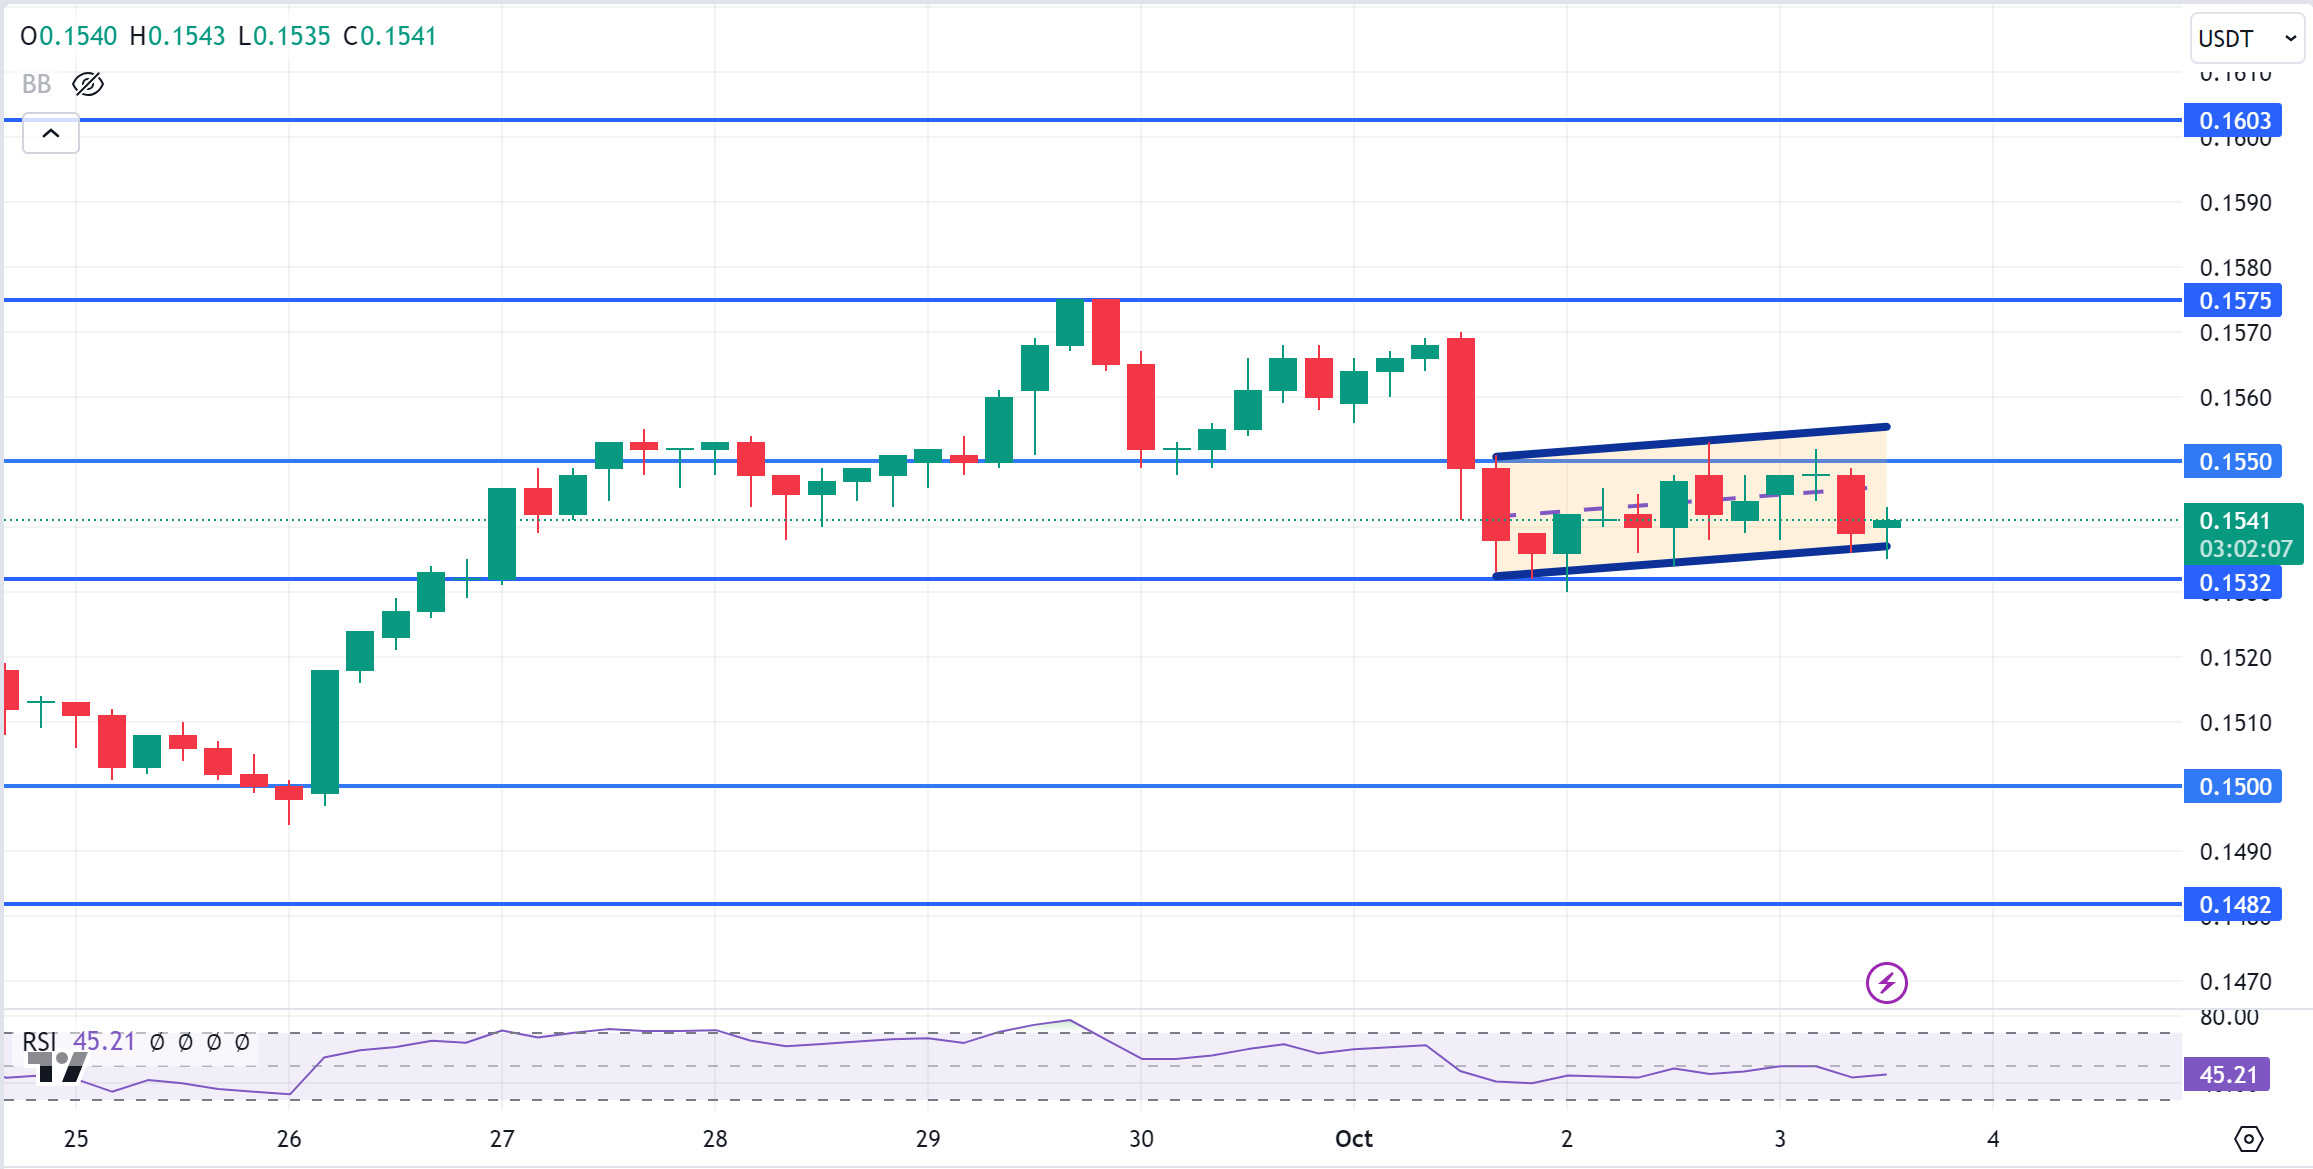
TRX, which started the day at 0.1545, fell slightly during the day and is trading at 0.1541. On the 4-hour chart, it moves within the ascending channel. It is in the lower band of the ascending channel and can be expected to move slightly up from its level with the RSI 45 value. In such a case, it may test the 0.1550 resistance. If selling pressure increases with negative news flows from the Middle East, it may test 0.1532 support. As long as TRX stays above 0.1482 support, the desire to rise may continue. If this support is broken downwards, sales can be expected to increase.
Supports 0.1532 – 0.1500 – 0.1482
Resistances 0.1550 – 0.1575 – 0.1603
 XRP/USDT
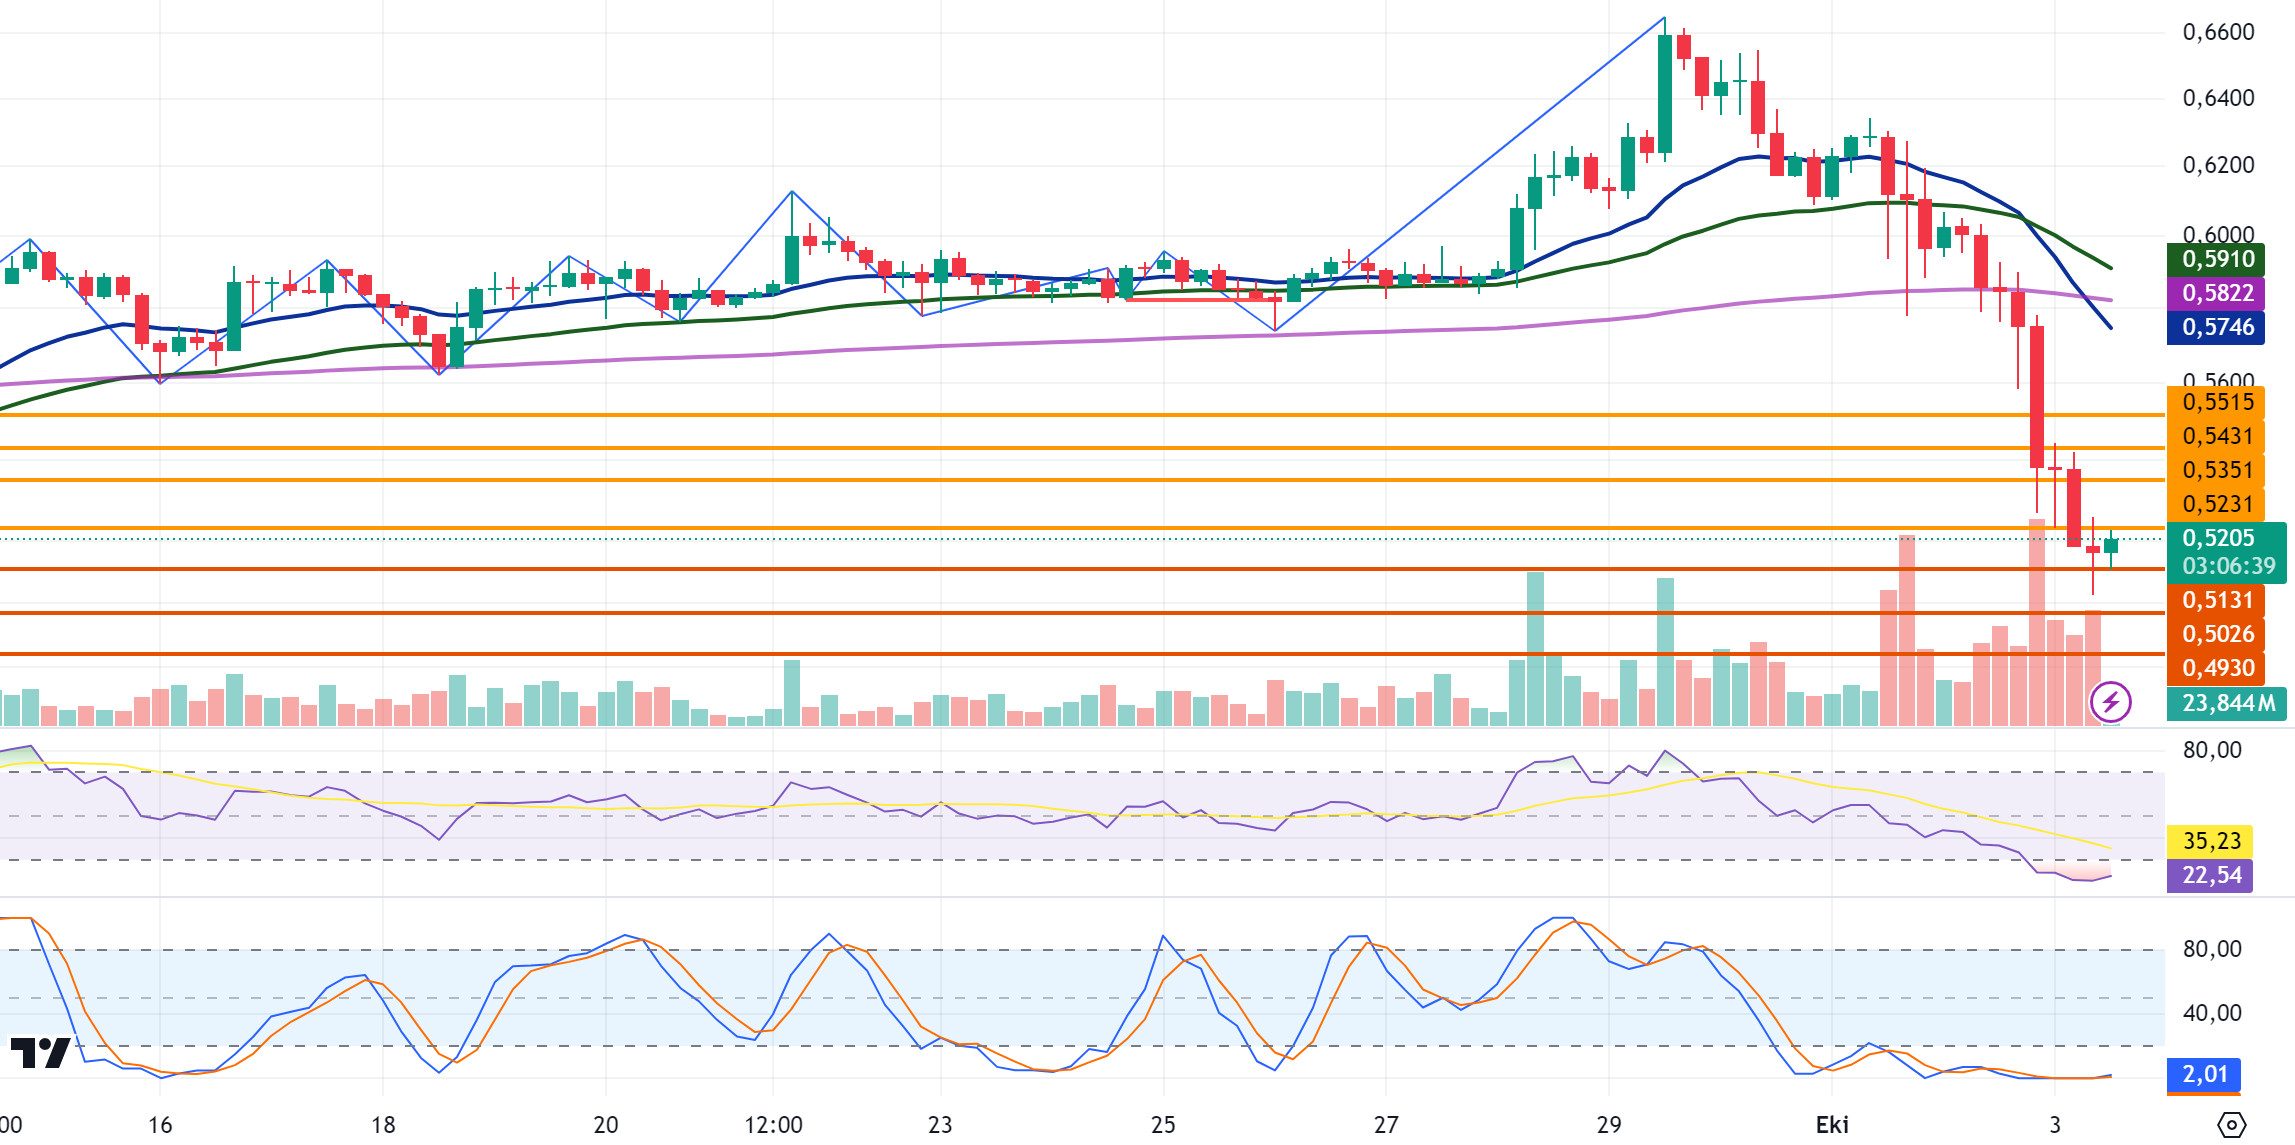
XRP, which started today at 0.5379, is currently trading at 0.5205 with a 3.2% loss in value. XRP, which has been affected by the downtrend that has dominated the crypto market in recent days, deepened yesterday with the SEC’s appeal and continued to decline today. As a result of the negative developments on behalf of XRP, it continues to lose value within the downtrend and may test the support levels of 0.5131-0.5026-0.4930 if the decline continues. With the positive developments that may come on behalf of the crypto markets, XRP may test the resistance levels of 0.5231-0.5351-0.5431 with its rise in the scenario where the decline is replaced by the rise.
If the decline in XRP continues and the candle closure occurs below 0.52 in the 4-hour analysis, the decline may deepen and offer a short trading opportunity. In its decline, it may rise with purchases from 0.49-0.50 levels and may offer a long trading opportunity.
EMA20 (Blue Line) – EMA50 (Green Line) – EMA200 (Purple Line)
Supports 0. 5131 – 0. 5026 – 0.4930
Resistances 0.5231 – 0. 5351 – 0.5431
DOGE/USDT
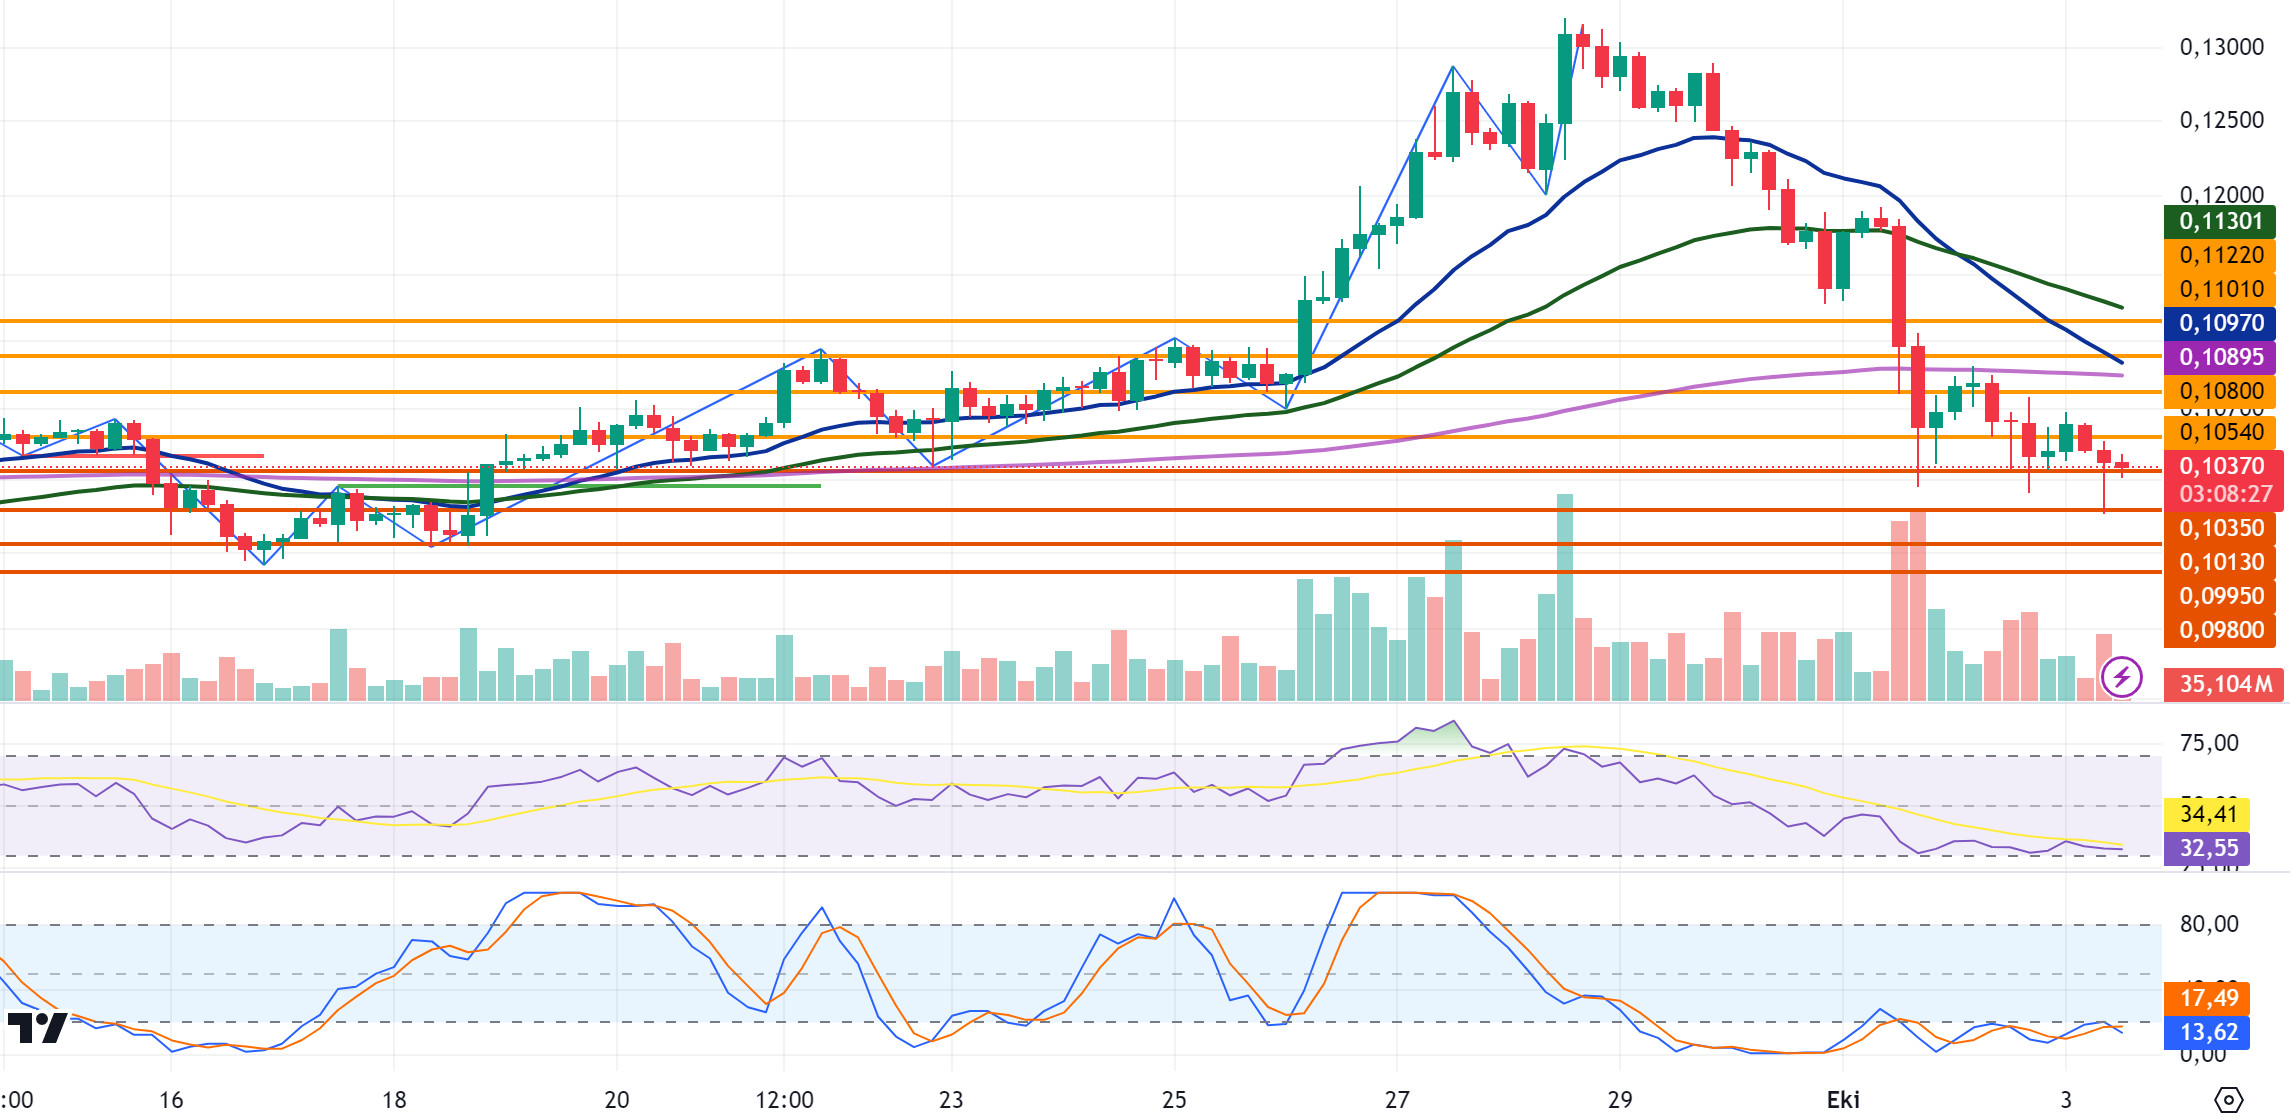
The decline in the crypto market continues in this period of high tension in the Middle East. In the last 5 days, DOGE has lost about 19% in value and is currently trading at 0.1037. DOGE continues to trade in a horizontal band between 0.1035 and 0.1080 levels in the 4-hour analysis today. In the decline it experienced today, it rose to 0.1040 levels again with purchases at the 0.1013 support level. In this process, which is dominated by the downtrend across the crypto market, if the decline in DOGE continues, it may test the support levels of 0.1035-0.1013-0.0995. If the decline is replaced by an uptrend after positive developments from the Middle East, it may test resistance levels of 0.1054-0.1080-0.1101.
DOGE, which is traded in a horizontal band today, may rise with the purchases that may come at the 0.1013 support level in its decline and may offer a long trading opportunity. If it closes the candle with its decline below the 0.1013 support level, the decline may deepen and offer a short trading opportunity.
EMA20 (Blue Line) – EMA50 (Green Line) – EMA200 (Purple Line)
Supports 0.1035 – 0.1013 – 0.0995
Resistances 0.1054 – 0.1080 – 0.1101
DOT/USDT
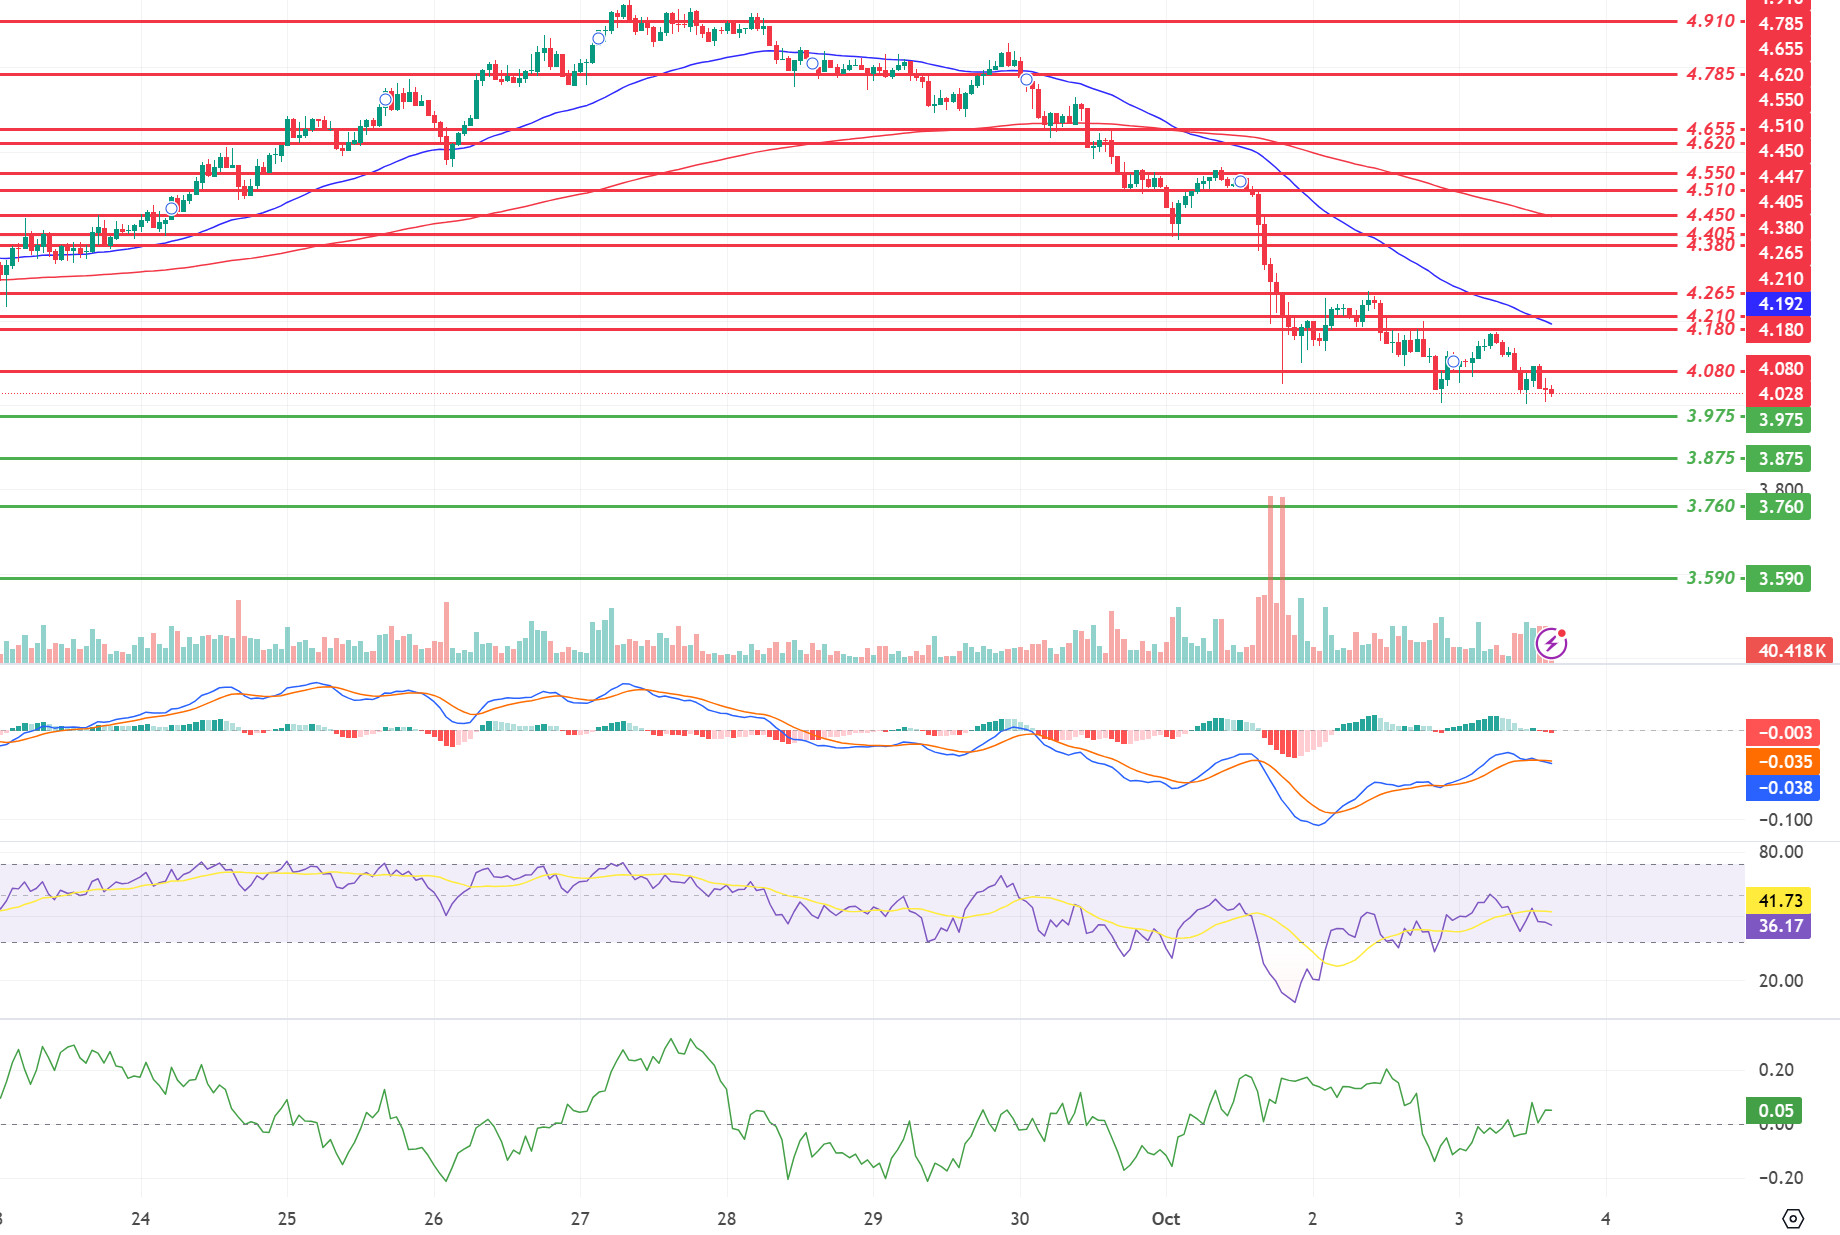
When we examine the Polkadot (DOT) chart, we see that the price broke the 4.080 support down. Moving towards 3.975 support, the price may move towards the 4.080 resistance level unless it falls below 3.975. According to the CMF oscillator, we see that buyers are strong. If the price stays above the 4.180 resistance, its next target could be 4.210 levels. If the selling pressure continues, the price may fall to 3.875 if it does not get a reaction from 3.975 support.
(Blue line: EMA50, Red line: EMA200)
Supports 3.975 – 3.875 – 3.760
Resistances 4.080 – 4.180 – 4.210
SHIB/USDT
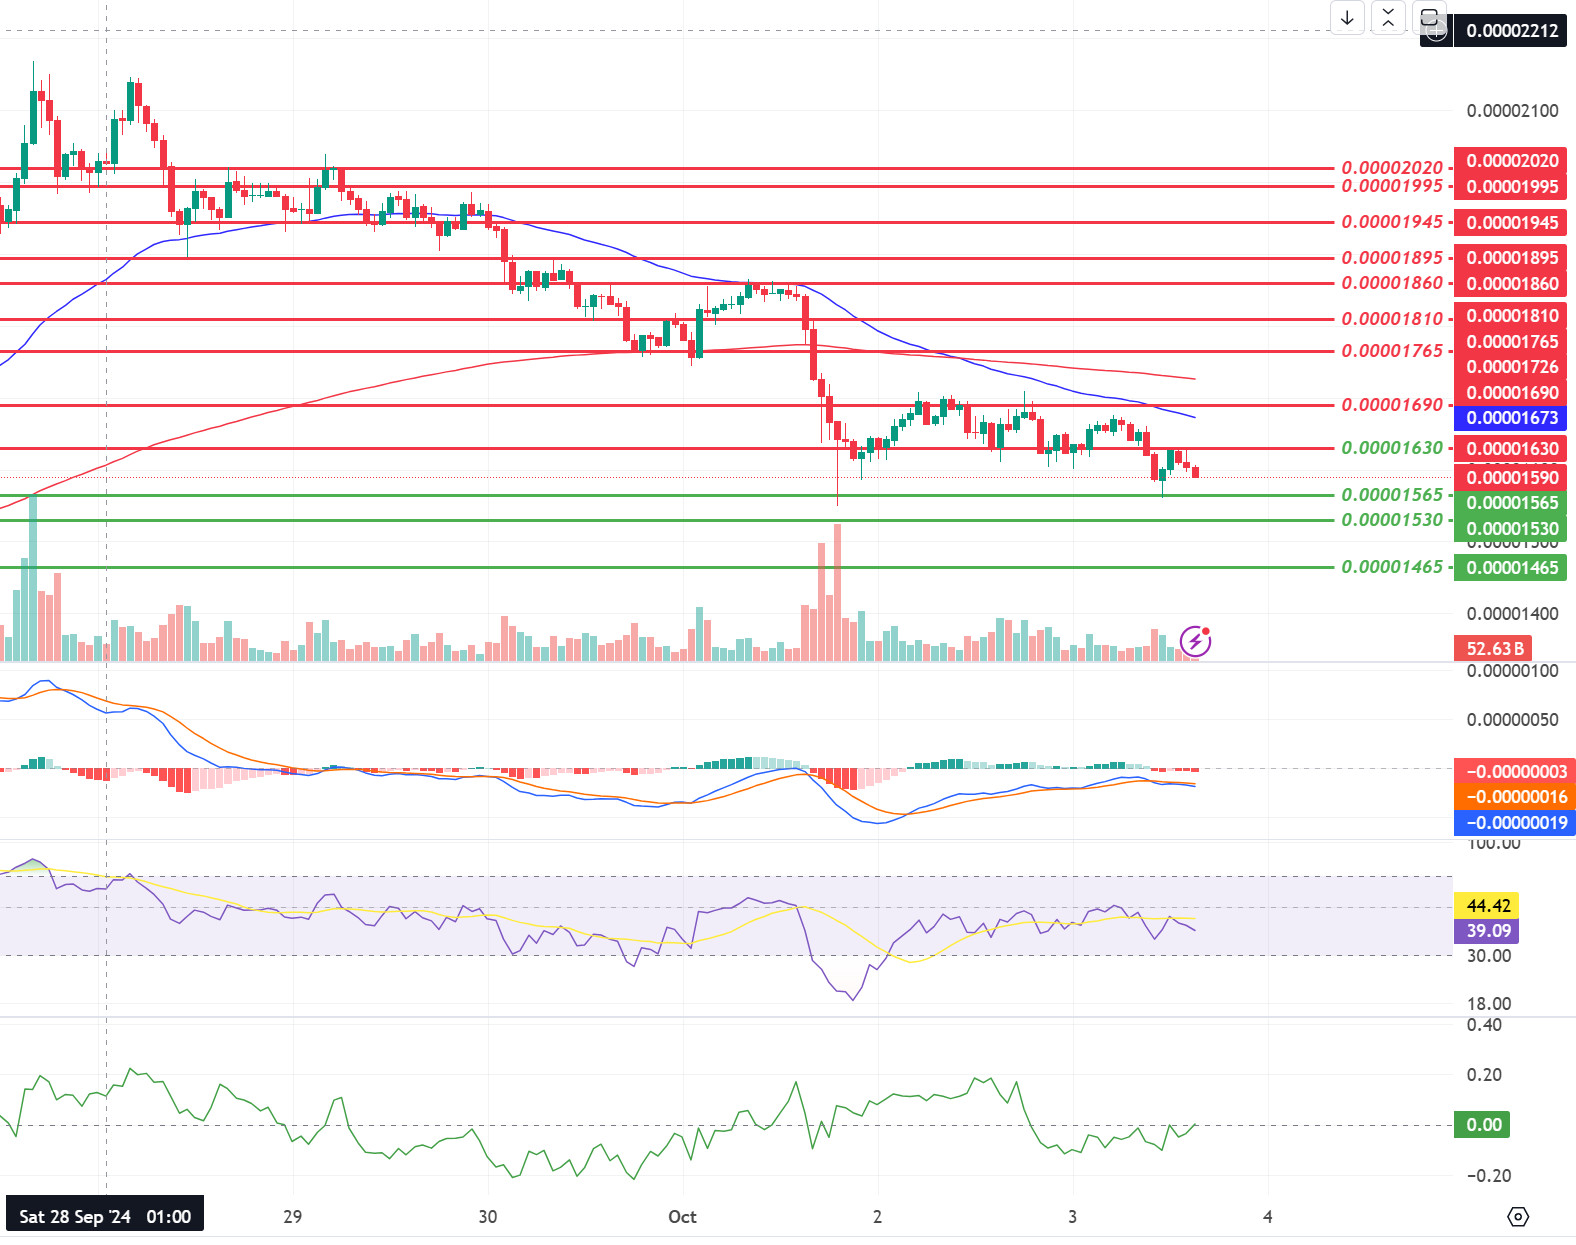
Shiba Inu’s (SHIB) burn rate increased by 229% in the last 24 hours and 2.6 million SHIB tokens were sent to dead wallets. In total, more than 410 trillion SHIBs were burned. SHIB, which lost the 0.00001630 support, reacted from the 0.00001565 support level. The increase in burn rates may prevent the loss of the 0.00001565 level. If the price does not lose the 0.00001565 level, it can be expected to rise towards the 0.00001630 level. On the other hand, if the selling pressure continues, we can expect the price to move towards the 0.00001530 level.
(Blue line: EMA50, Red line: EMA200)
Supports 0.00001565 – 0.00001530 – 0.00001465
Resistances 0.00001630 – 0.00001690 – 0.00001765
LEGAL NOTICE
The investment information, comments and recommendations contained herein do not constitute investment advice. Investment advisory services are provided individually by authorized institutions taking into account the risk and return preferences of individuals. The comments and recommendations contained herein are of a general nature. These recommendations may not be suitable for your financial situation and risk and return preferences. Therefore, making an investment decision based solely on the information contained herein may not produce results in line with your expectations.

