MARKET SUMMARY
Latest Situation in Crypto Assets
| Asset | Last Price | 24h Change | Dominance | Market Cap |
|---|---|---|---|---|
| BTC | $68,153.00 | -0.16% | 57.22% | $1.35 T |
| ETH | $2,695.00 | 1.94% | 13.77% | $324.48 B |
| SOLANA | $165.73 | 4.56% | 3.30% | $77.84 B |
| XRP | $0.5507 | 2.18% | 1.33% | $31.22 B |
| DOGE | $0.1443 | 4.21% | 0.90% | $21.10 B |
| TRX | $0.1575 | 0.79% | 0.58% | $13.63 B |
| CARDANO | $0.3607 | 2.25% | 0.54% | $12.61 B |
| AVAX | $28.11 | 0.58% | 0.49% | $11.43 B |
| SHIB | $0.00001868 | 0.60% | 0.47% | $10.99 B |
| LINK | $11.73 | 0.74% | 0.31% | $7.36 B |
| DOT | $4.455 | 0.20% | 0.29% | $6.72 B |
*Prepared on 10.21.2024 at 14:00 (UTC)
WHAT’S LEFT BEHIND
Russia’s step on crypto mining and artificial intelligence in BRICS countries
The Russian state fund and the country’s largest cryptocurrency mining company will establish data centers in BRICS countries. While the announcement was made at the BRICS Business World meeting held in Moscow, artificial intelligence projects will also be developed through these data centers.
A New Era for Investors After SEC Approves Bitcoin Spot ETF Options
Recently, the US Securities and Exchange Commission (SEC) officially approved Bitcoin Spot ETF options, which was considered an important milestone in the crypto market. The SEC also authorized options trading on the iShares Bitcoin Trust through the Nasdaq ISE. This decision increases the diversity of investment instruments for existing ETF products in the market. This gives investors access to both the price of Bitcoin and the opportunities it creates through options contracts.
Reaction to ECB’s Bitcoin report grows
A Bitcoin report published by the Central Bank of the European Union (ECB) slammed the largest cryptocurrency, claiming that Satoshi Nakamoto’s goal has not been realized. While the report stated that Bitcoin’s rise should be prevented and even everyone should work for its destruction, the article has been met with backlash.
HIGHLIGHTS OF THE DAY
Important Economic Calender Data
| Time | News | Expectation | Previous |
|---|---|---|---|
| 17:00 | US FOMC Member Kashkari Speaks | N/A | N/A |
| 21:05 | US FOMC Member Schmid Speaks | N/A | N/A |
| 22:40 | US FOMC Member Daly Speaks | N/A | N/A |
INFORMATION
*The calendar is based on UTC (Coordinated Universal Time) time zone. The economic calendar content on the relevant page is obtained from reliable news and data providers. The news in the economic calendar content, the date and time of the announcement of the news, possible changes in the previous, expectations and announced figures are made by the data provider institutions. Darkex cannot be held responsible for possible changes that may arise from similar situations.
MARKET COMPASS
Bitcoin, which hit four-month highs, continued its retreat during the European session today, starting with Asian trading. Major digital assets, including Solana, which has made notable gains on the back of activity in memecoins, are following a similar pattern after recent rallies. Recent gains have been driven by the belief that Trump, who is close to the crypto world, is leading the race in the upcoming US elections and signs that digital assets are gaining acceptance faster than traditional markets. In addition, the fact that the central banks that manage the monetary policies of the world’s major economies (such as the US-FED and China-PBOC…) are in an easing cycle has continued to keep risk appetite alive despite geopolitical issues.
In addition to these dynamics, which we have been talking about in our analyzes for a while and which form the basis for the long-term upward trend, if we come to the outlook during the day, we can say that we continue to see that crypto assets continue to breathe at intermediate stops due to the nature of the market. If we take into account the retreat in European stock markets and the US index futures pointing to a red opening, it would not be wrong to say that the decline in digital assets may continue with a lackluster course. There is currently no apparent reason for deepening losses. As long as there are no factors that could disrupt the risk appetite, such as the results of corporate balance sheets in the US, statements from FED officials or a potential news flow from the Middle East, it would not be right to attribute meaning to the declines. We will continue to see this as part of the dynamics of the market.
TECHNICAL ANALYSIS
BTC/USDT
Bitcoin ETFs approved in January opened a new investment door and attracted intense interest from institutional investors. Another critical approval from the SEC came from Bitcoin ETF options. With this approval, it leads to an increase in confidence in Bitcoin and its further adoption. As a matter of fact, the use of Bitcoin as a means of fierce competition between presidential candidates in the US election campaign confirms this. In the long term, Bitcoin seems to continue on its way with a steady growth, although there are sharp pullbacks from time to time.
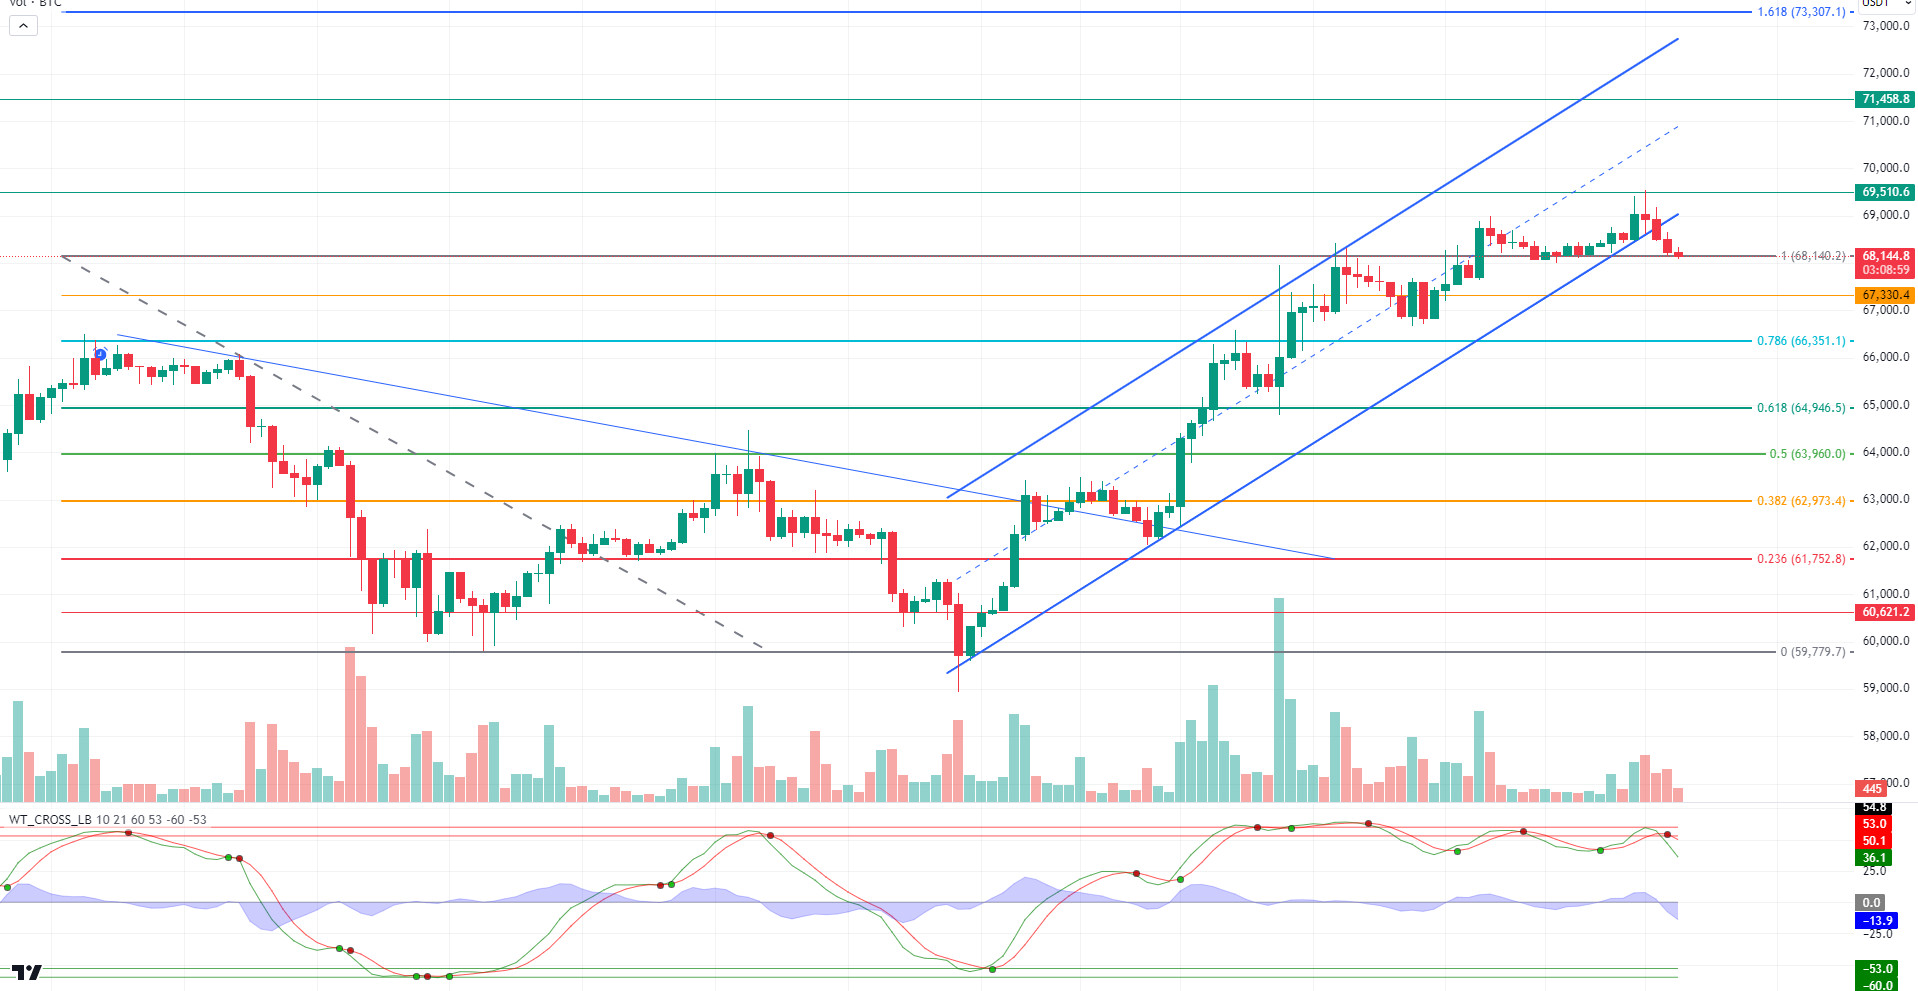
In the short term, when we examine the BTC 4-hour technical analysis chart, it is seen that a horizontal course is about to prevail in its price within the rising trend channel. BTC, which has been holding at the peak for a long time, fell to Fibonacci 1 (68,140) after testing the 69,510 resistance above. With a negative outlook on the Asian and European side in global markets, the US stock market accompanying this may turn the direction down in BTC. In case of a pullback, hourly closes below the support level may deepen the decline to the minor support level of 67,330. Due to market optimism and historical cycles, we can say that the break of the resistance level of 69,510 is important in a new upward attack attempt.
Supports 68,140 – 67,330 – 66,350
Resistances 69,510 – 71,470 – 73,700
ETH/USDT
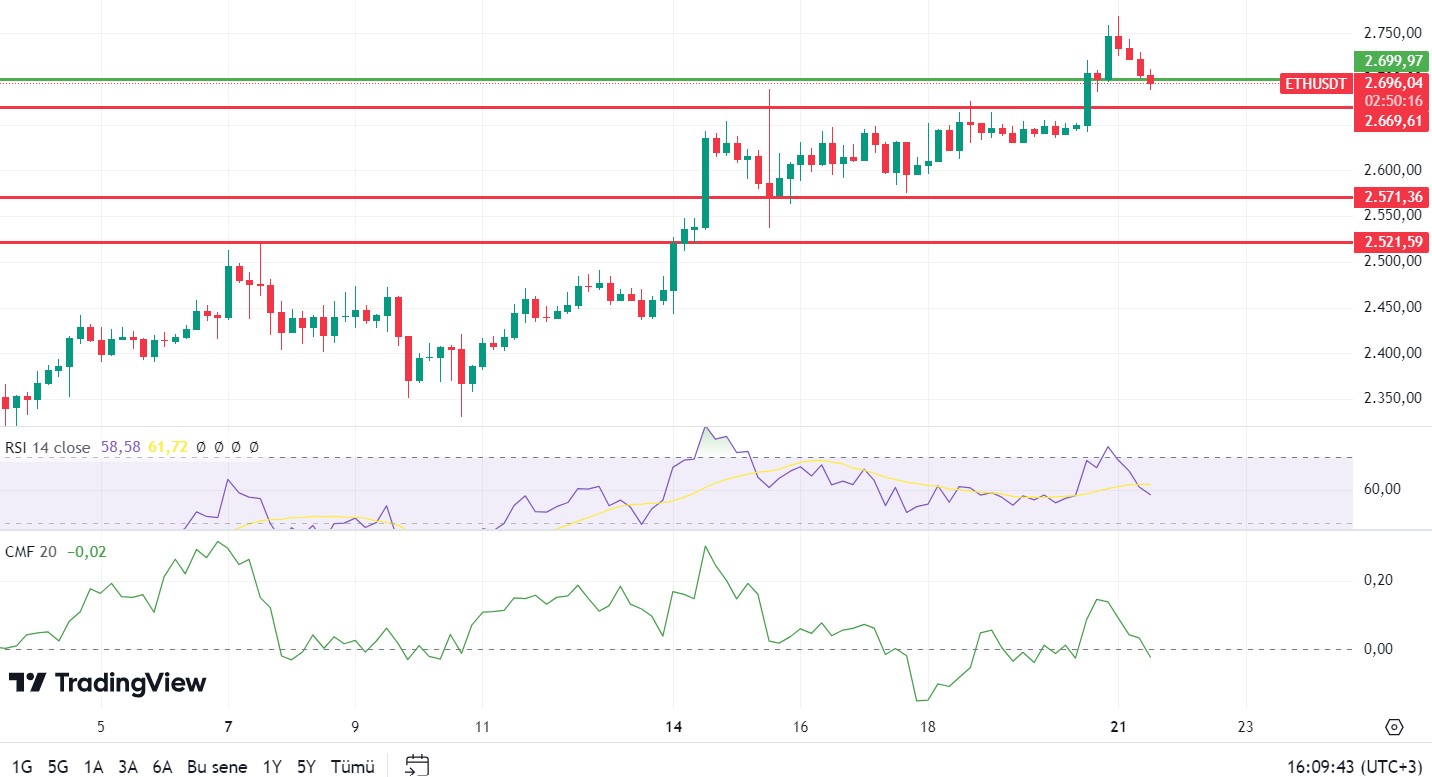
Ethereum is trying to hold in this region after correcting below the 2,700 level with negative divergences on Relative Strength Index (RSI), Chaikin Money Flow (CMF) and Money Flow Index (MFI) during the day. A possible positive divergence that may occur on RSI at this level stands out for ETH, which may decline to 2,669 in the scenario of continued declines in the evening hours. In summary, after falling to the 2,669 level, it seems likely that it will take some reaction from here and start to rise. Regaining the 2,700 level may indicate that some more horizontal movement may continue above this level.
Supports 2,669 – 2,571 – 2,521
Resistances 2,700 – 2,815 – 2,933
LINK/USDT
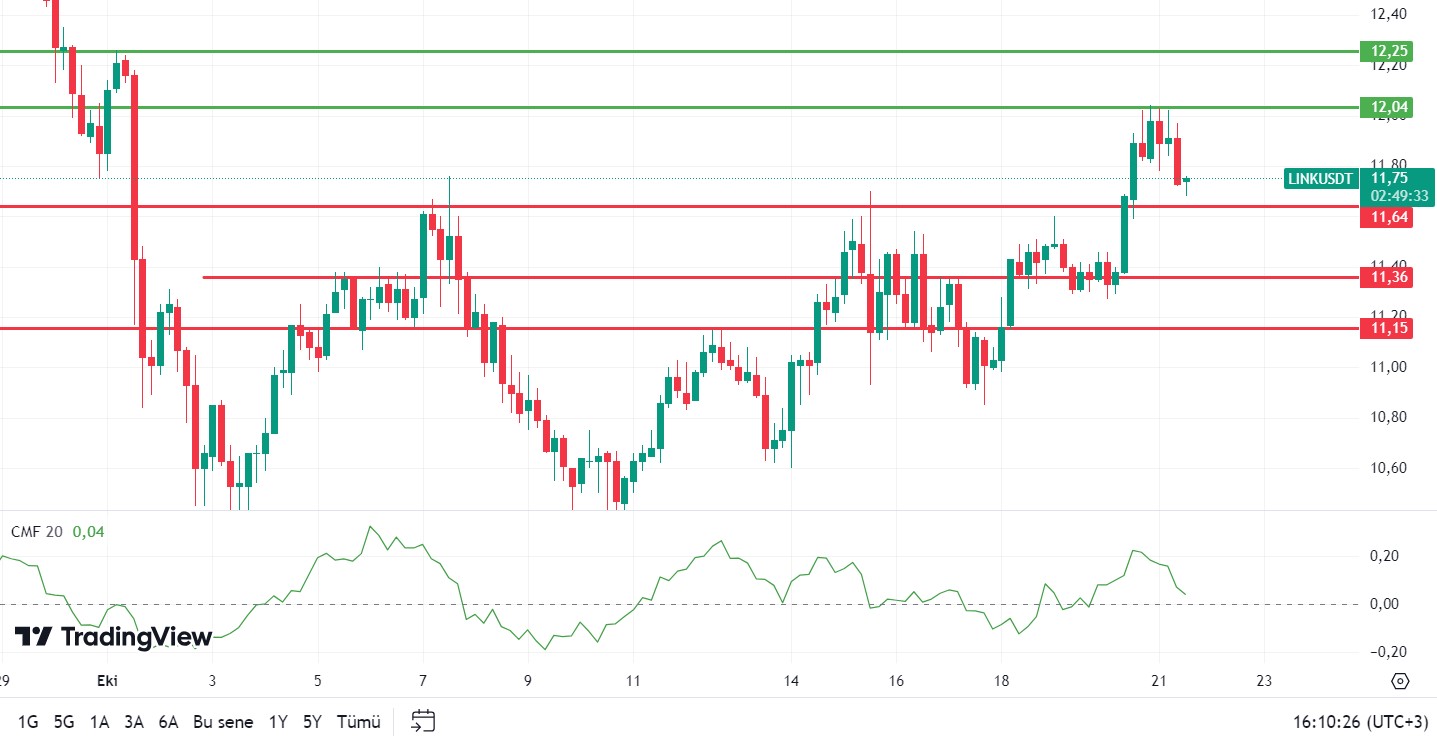
It is seen that LINK, which approached the 11.64 resistance level with the retracement in the market, received some reaction with the decline. Chaikin Money Flow (CMF) converged to 0.04 levels again, indicating that a potential sell signal may occur. CMF, which will fall below 0 with the break of the 11.64 level, suggests that the declines may deepen. For LINK, whose continuity of the positive trend depends on exceeding the 12.04 level, we can see sharp rises with the exceeding of this level.
Supports 11.64 – 11.36 – 11.15
Resistances 12.04 – 12.25 – 12.71
SOL/USDT
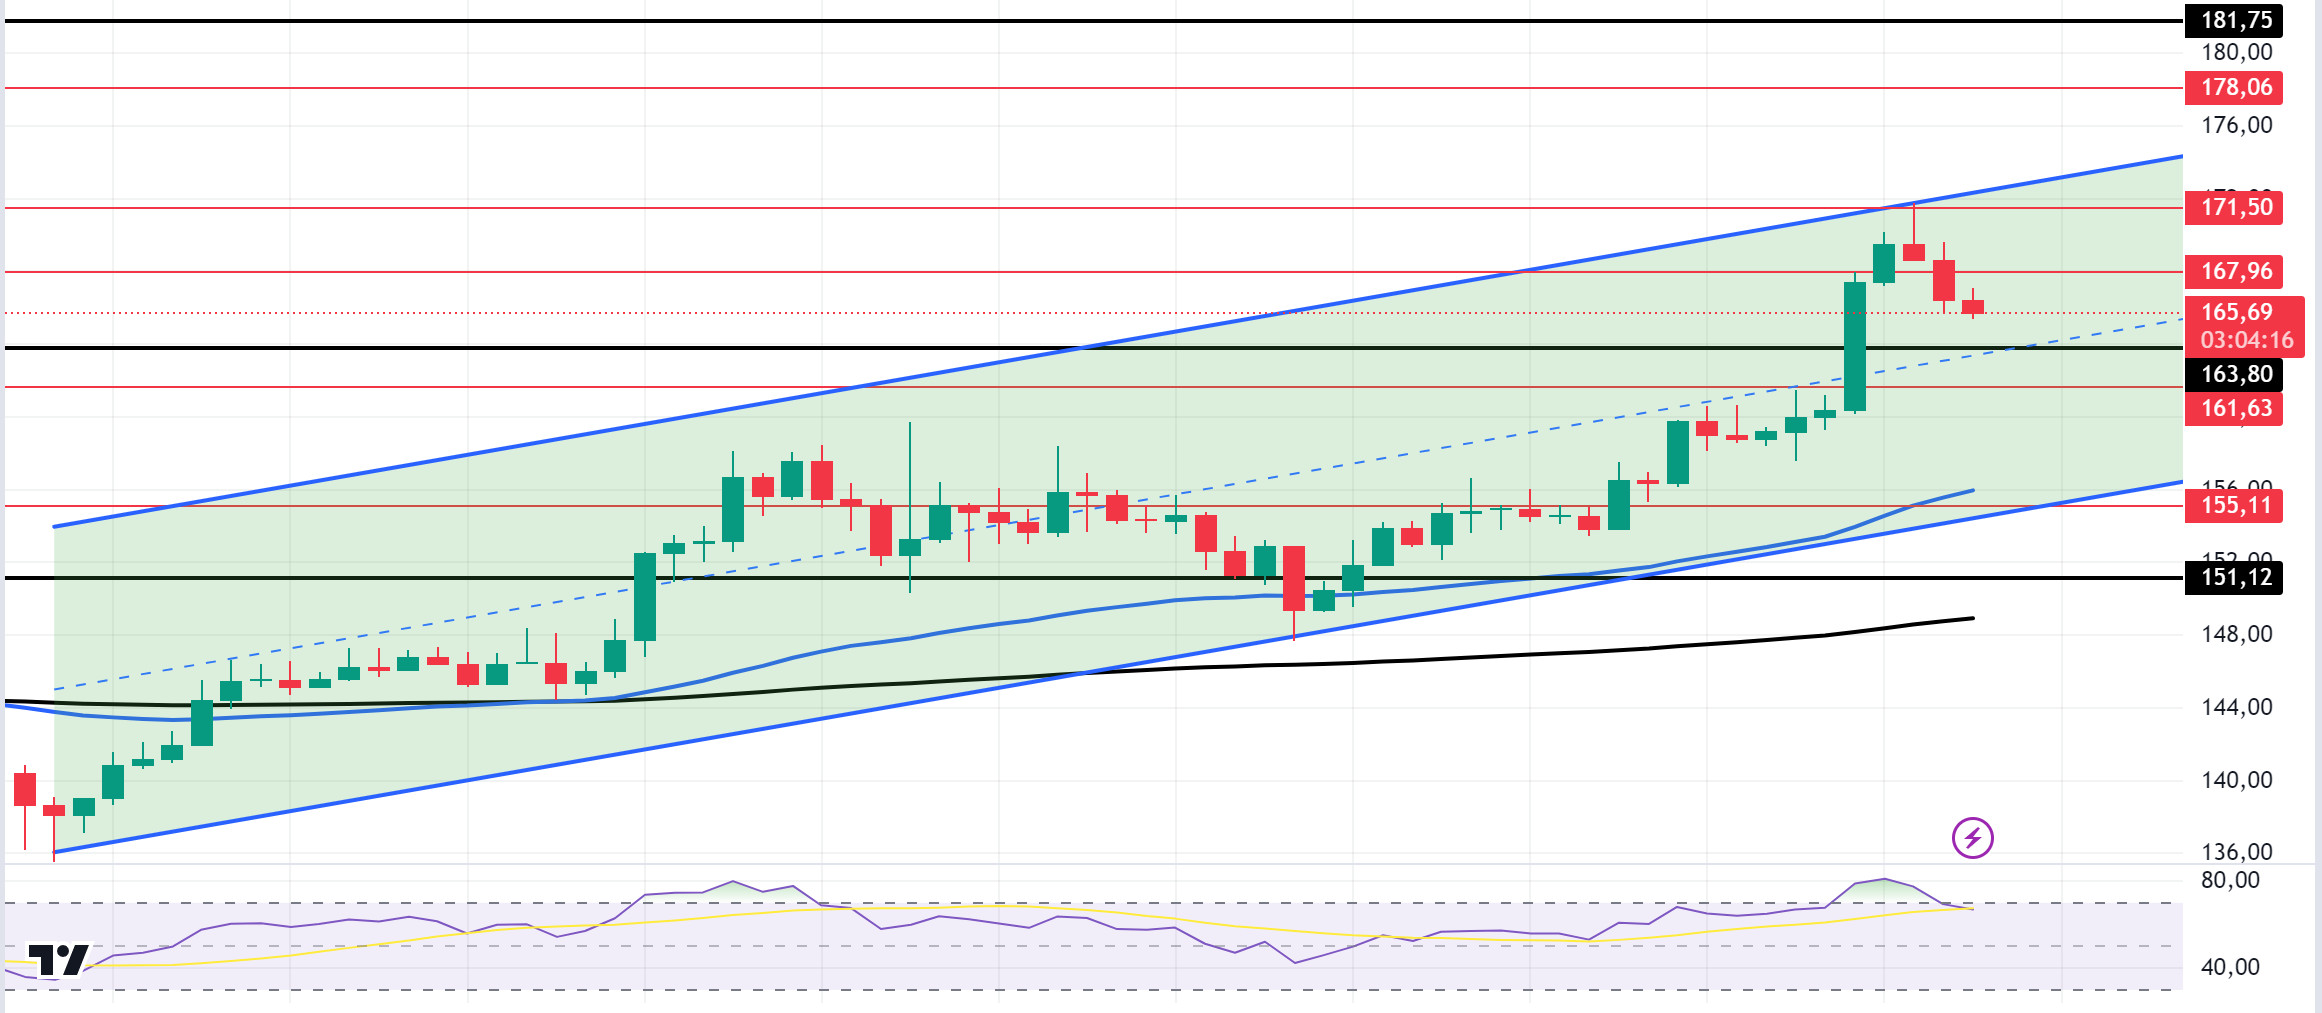
According to Coinshares data, digital asset investment products experienced the largest inflows since July with $2.2 billion last week. Bitcoin saw inflows of $2.13 billion, while Ethereum recorded inflows of $58 million. On Solana, Open Interest has increased significantly and has now reached nearly $3 billion, an increase of 27% since October 18. When we look at the SOL chart, since our analysis in the morning, it has declined by 2.7% as of the time of writing. It can be said that profit sales were effective in this. On the other hand, the Funding Rate is 0.0168%. This shows us that the market’s demand for the Long position continues. On the 4-hour timeframe, the 50 EMA (Blue Line) continues to be above the 200 EMA (Black Line). This could mean that the uptrend will continue. The price broke an important resistance level of 163.80 on volume, continuing the uptrend that started on October 10. However, the Relative Strength Index (RSI)14 indicator is in the overbought zone. This may bring profit sales. This means that the SOL price may fall. The 181.75 level is a very strong resistance point in the uptrend driven by both macroeconomic conditions and innovations in the Solana ecosystem. If it rises above this level, the rise may continue strongly. In case of possible profit sales, support levels of 163.80 – 161.63 should be followed. If the price comes to these support levels, a potential bullish opportunity may arise.
Supports 163.80 – 161.63 – 155.11
Resistances 167.96 – 171.50 – 178.06
ADA/USDT
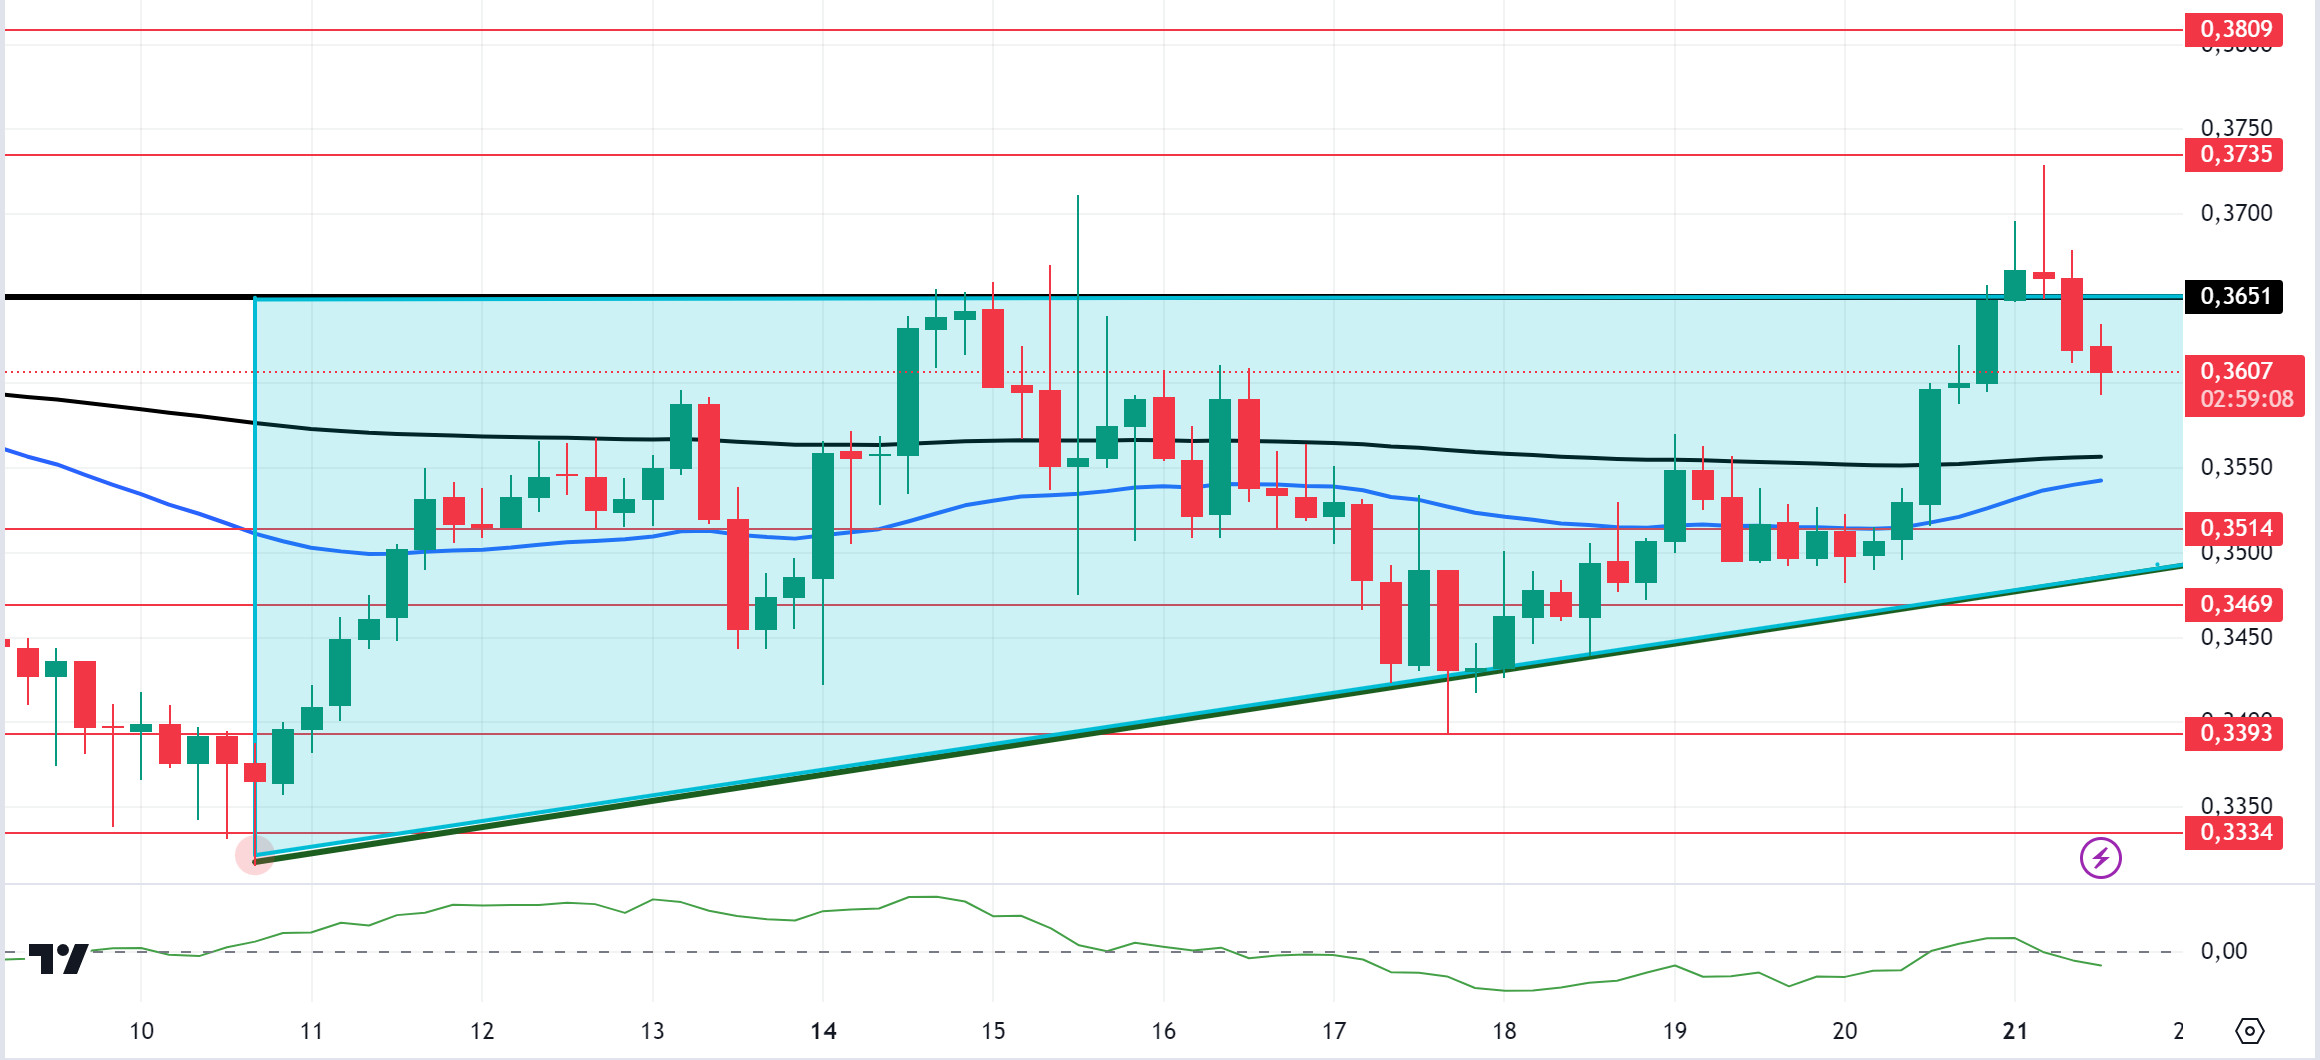
According to Coinshares data, digital asset investment products experienced the largest inflows since July with $2.2 billion last week. Bitcoin saw inflows of $2.13 billion, while Ethereum recorded inflows of $58 million. On the 4-hour chart, the downtrend that started on October 15 continues. ADA is struggling to gather enough volume to recover from its recent pullback. The Chaikin Money Flow (CMF) 20 indicator has turned negative. This shows that money inflows are decreasing. On the 4-hour chart, the price is pricing above the 50 EMA and 200 EMA. At the same time, the 50 EMA (Blue Line) continues to hover below the 200 EMA (Black Line). This supports that the trend is bearish. At the same time, ADA, which is testing the ceiling level of the ascending triangle pattern, may test the resistance level of 0.3905 if it breaks this level. The continued decline in money flow and the recent rejection from 0.3651 resistance may signal a potential decline towards the 0.3514 support zone. If this happens, 0.3514 is a strong support level and can be followed as a good place to buy.
Supports 0.3514 – 0.3469 – 0.3393
Resistances 0.3651 – 0.3735 – 0.3809
AVAX/USDT
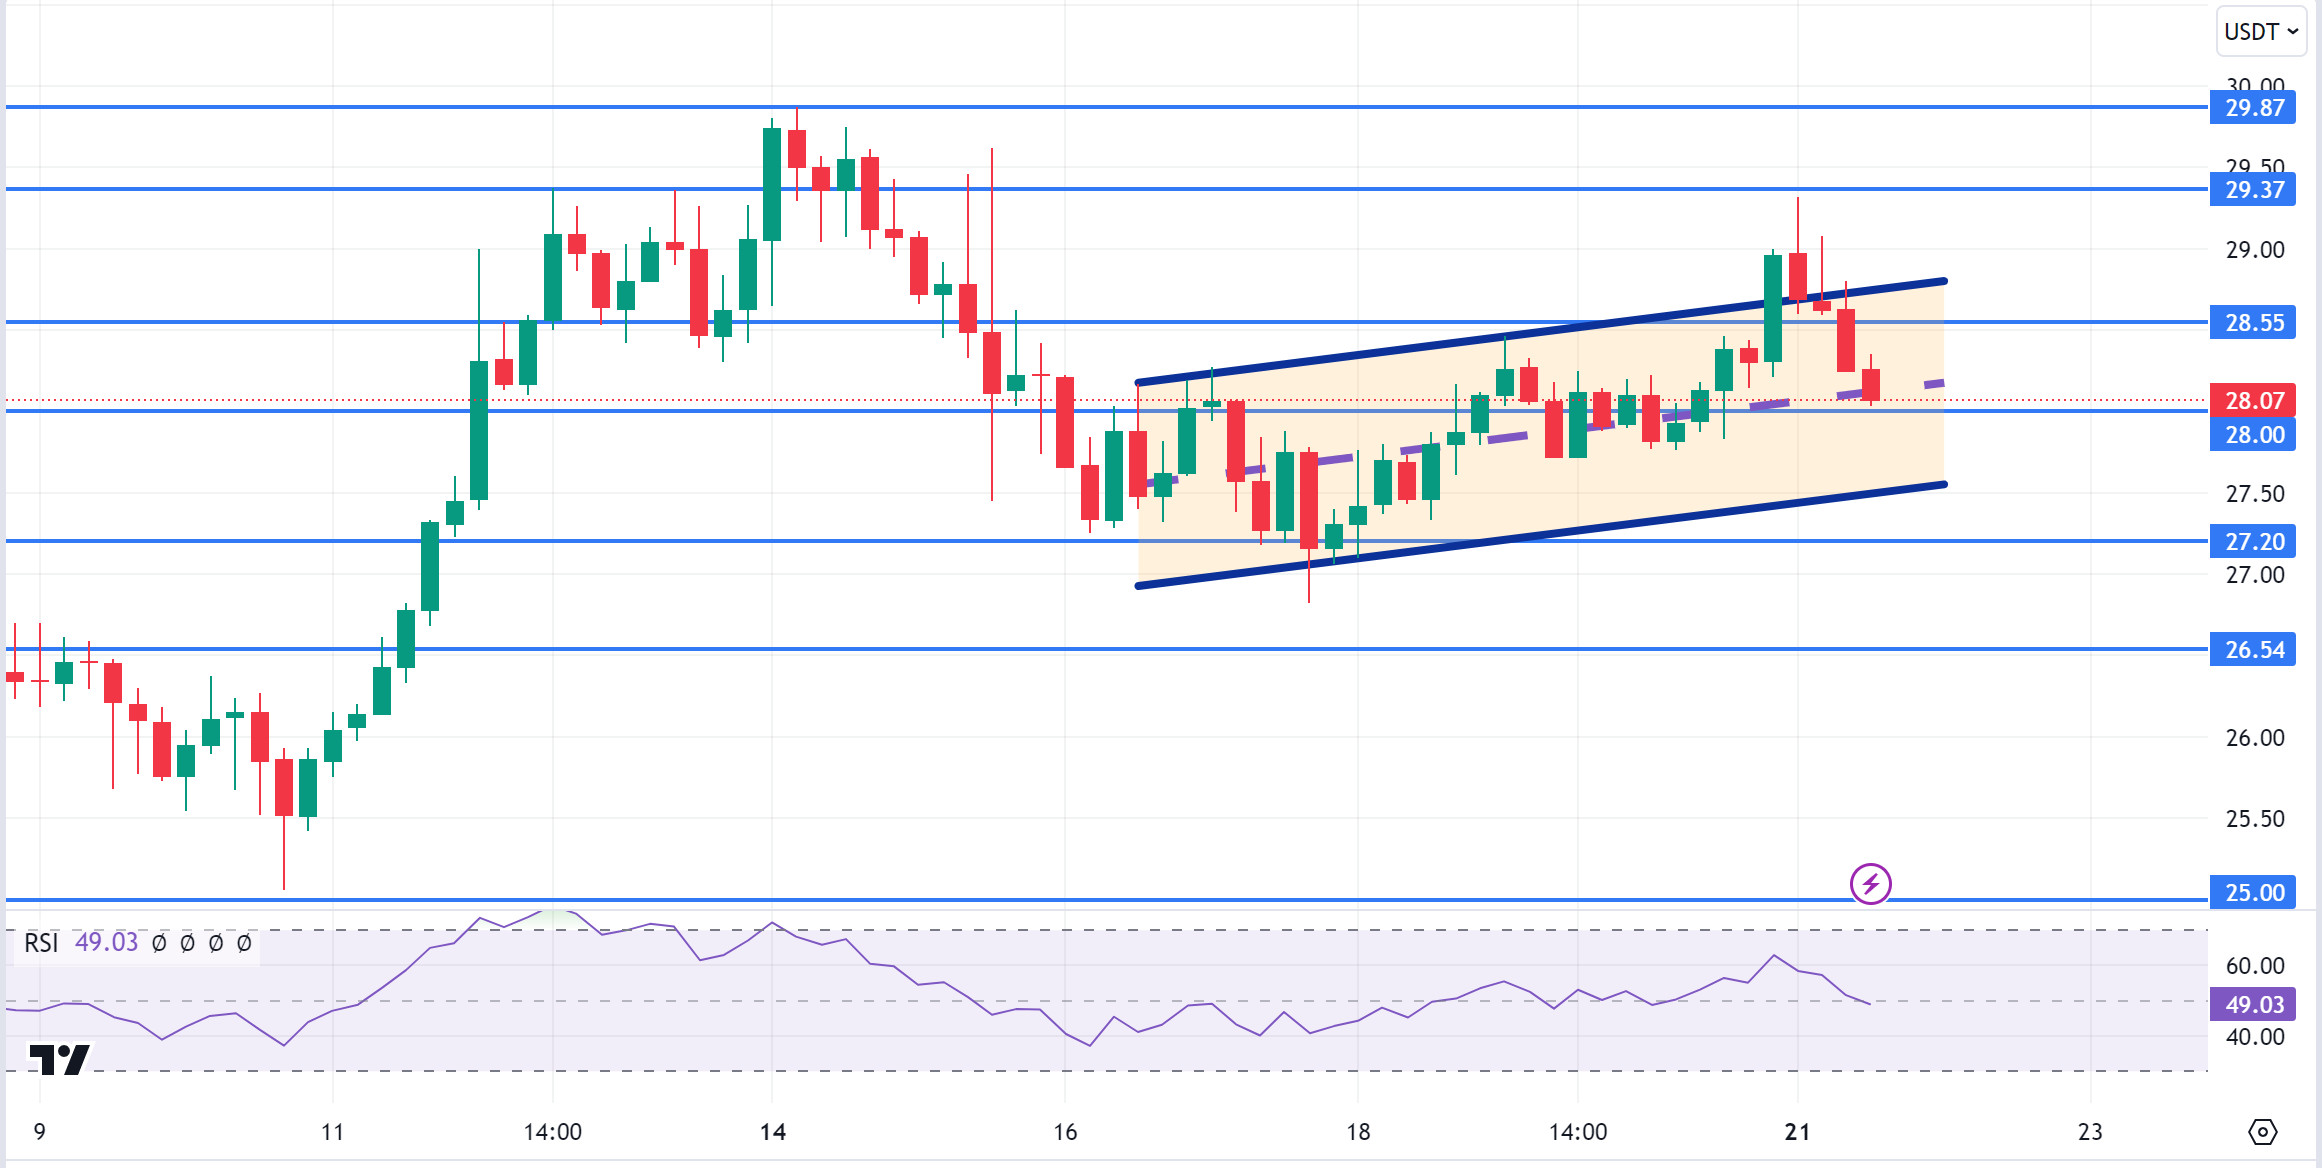
AVAX, which opened today at 28.97, is trading at 28.07, down about 3% during the day. Today, there is no planned data to be announced especially by the US and expected to affect the market. For this reason, it may be a low-volume day where we may see limited movements. News flows from the Middle East will be important for the market.
On the 4-hour chart, it is moving in an uptrend. It is in the middle band of the uptrend and with a Relative Strength Index value of 49, it can be expected to rise from these levels and move to the upper band. In such a case, it may test the 28.55 resistance. However, sales may increase in case of news of increasing tension in the Middle East. In such a case, it may move to the lower band of the trend and test the 27.20 support. As long as it stays above 25.00 support during the day, the desire to rise may continue. With the break of 25.00 support, sales may increase.
Supports 28.00 – 27.20 – 26.54
Resistances 28.55 – 29.37 – 29.87
TRX/USDT
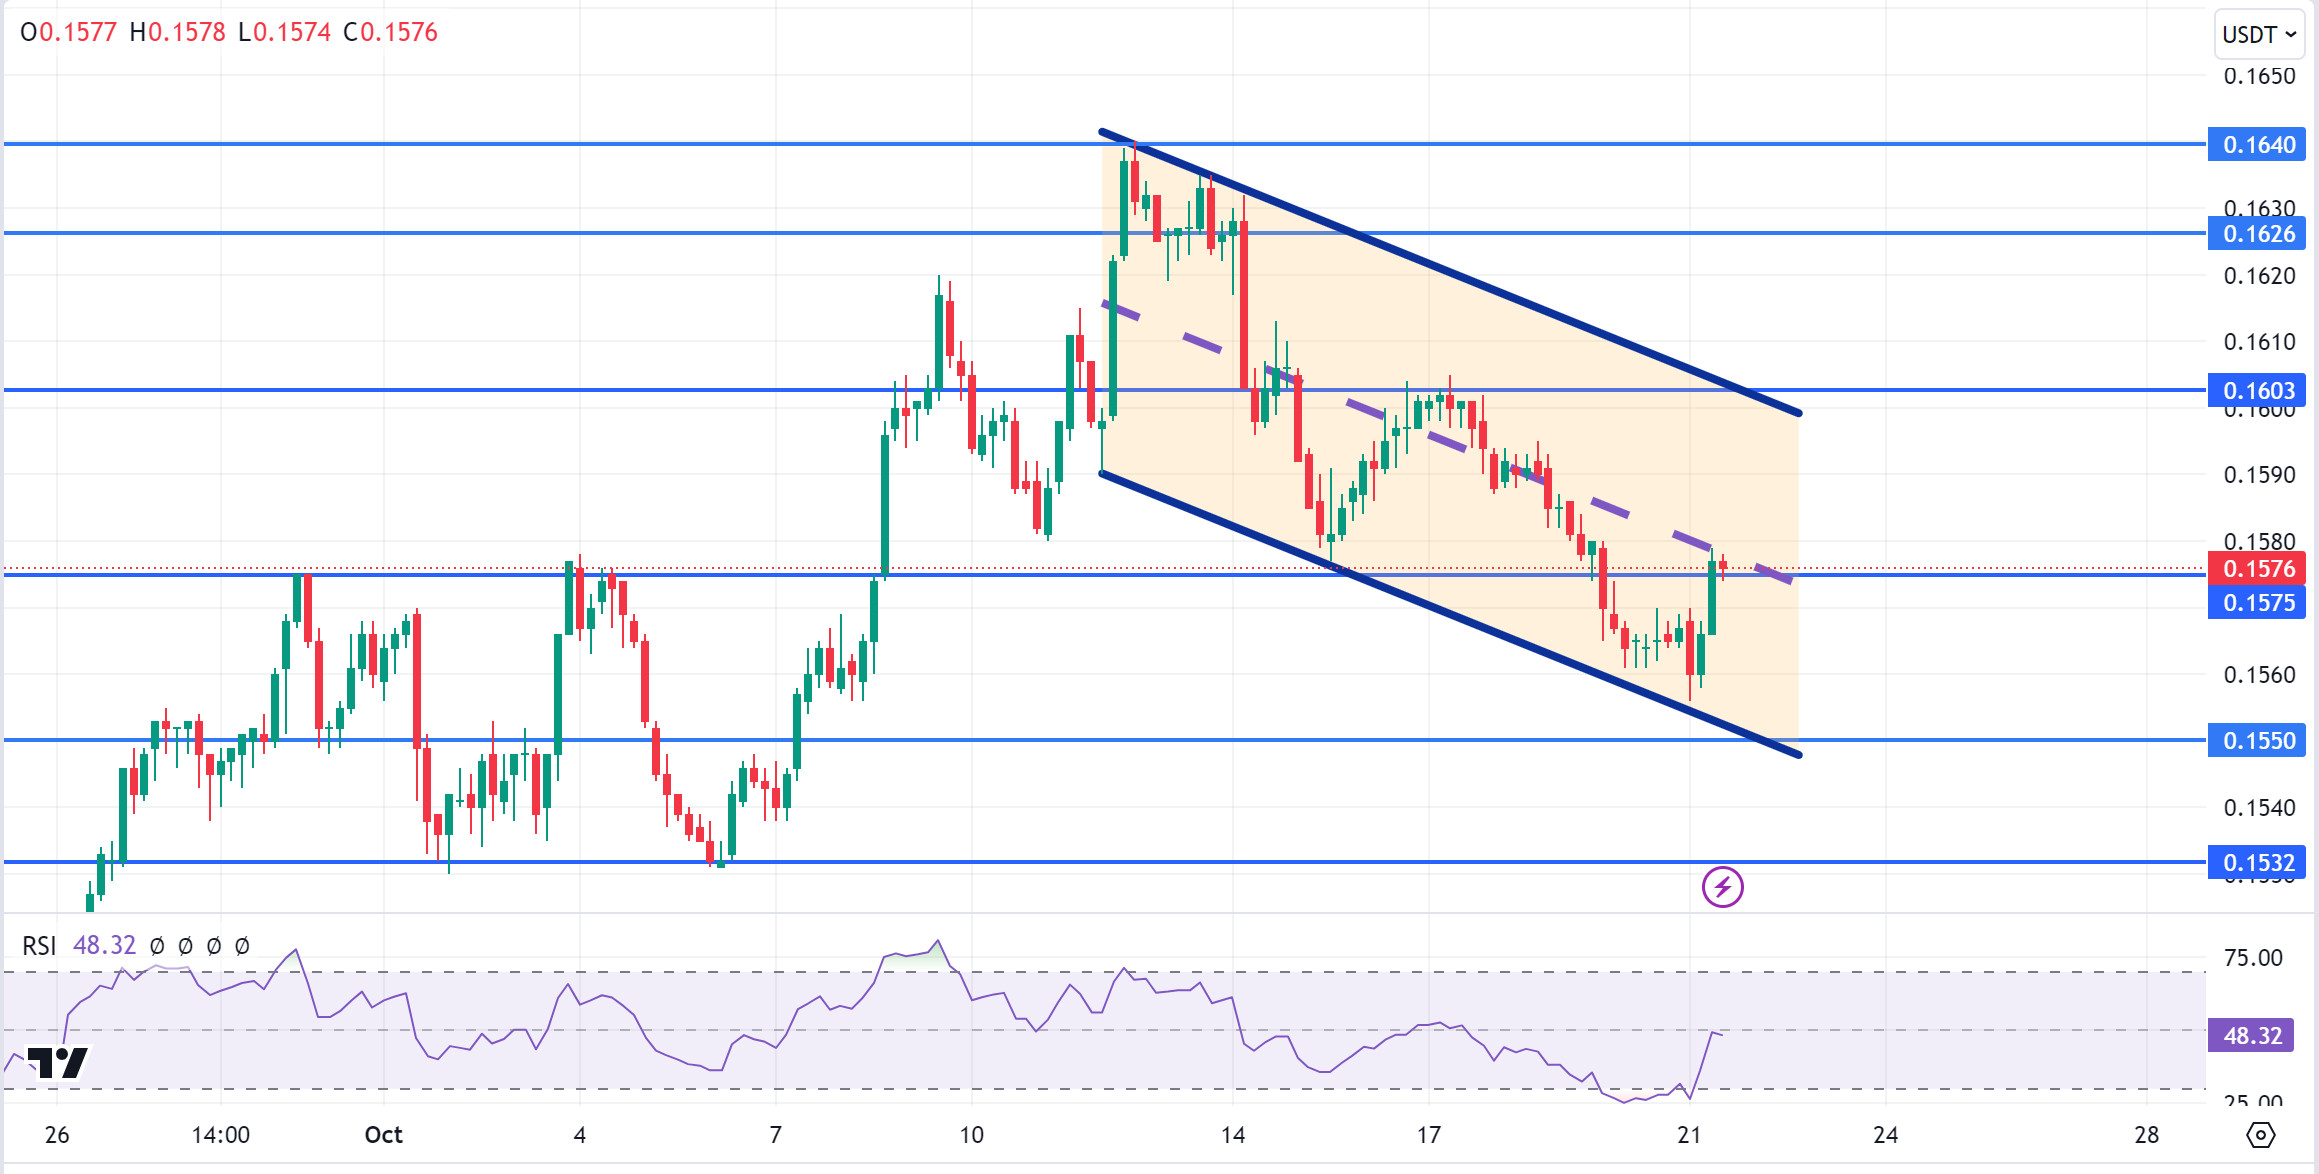
TRX, which started today at 0.1568, rose slightly during the day and is trading at 0.1576. There is no scheduled data for the market today. The market will be closely following the news flows regarding the tension in the Middle East.
On the 4-hour chart, it is in the middle band of the downtrend. With a Relative Strength Index value of 48, it can be expected to rise a little more from its current level. In such a case, it may move to the upper band of the trend and test the 0.1603 resistance. However, if it cannot close the candle above 0.1603 resistance, it may test 0.1575 support with the selling pressure that may occur. As long as TRX stays above 0.1482 support, the desire to rise may continue. If this support is broken downwards, sales can be expected to increase.
Supports 0.1575 – 0.1550 – 0.1532
Resistances 0.1603 – 0.1626 – 0.1640
XRP/USDT
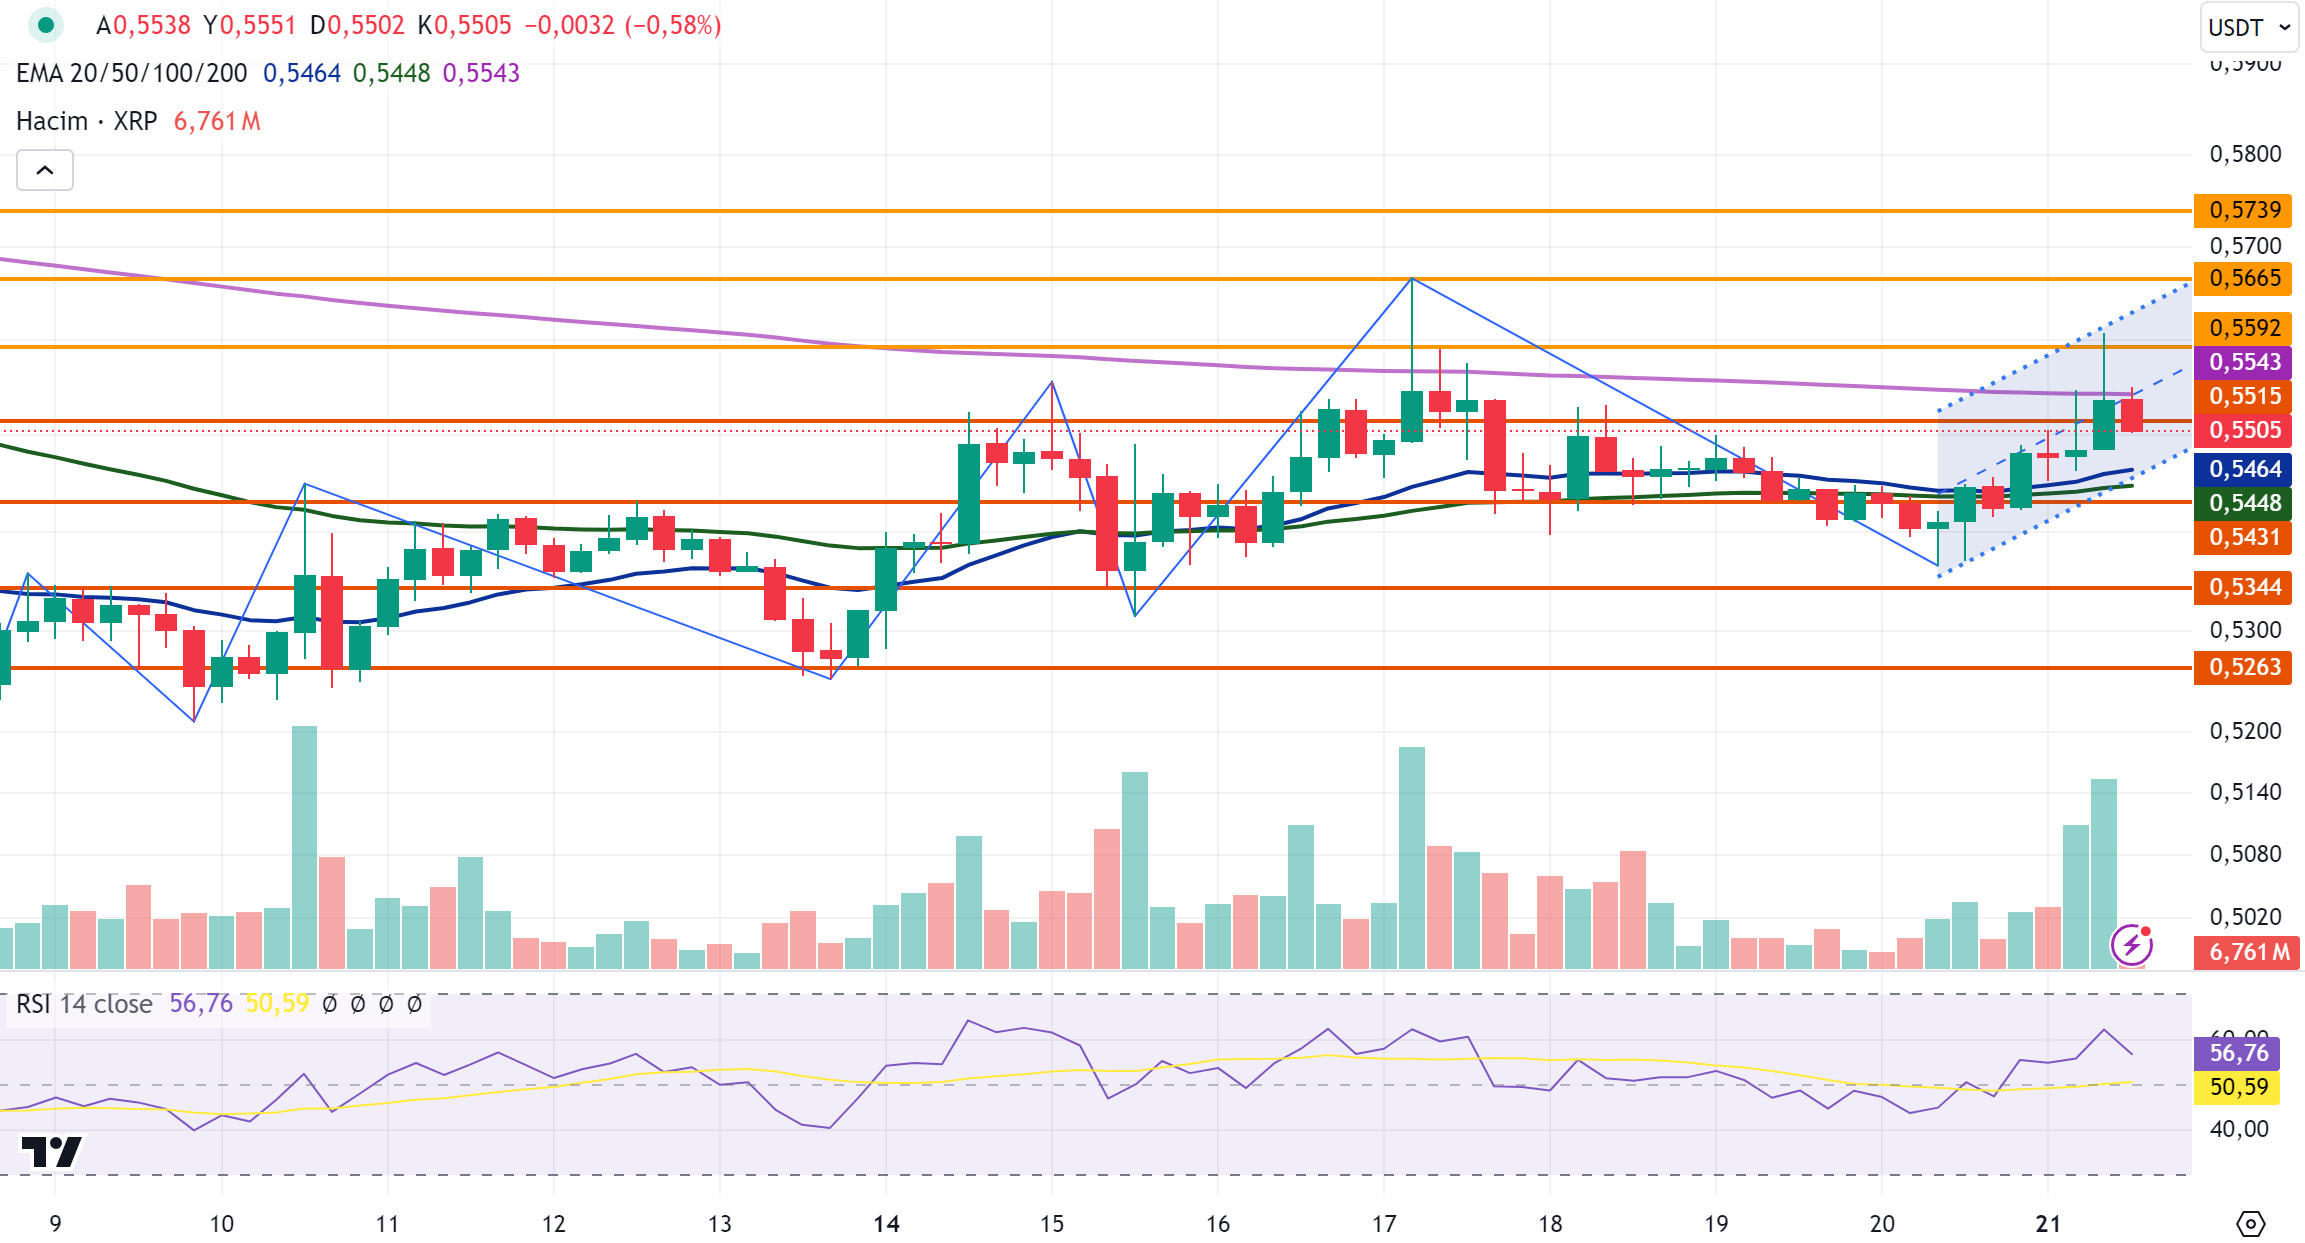
XRP, which started today at 0.5483, rose as high as 0.56 in the 4-hour analysis, then fell with the sales and fell below the 200-period exponential moving average (EMA200) level. In the 4-hour analysis, XRP, which continues to decline on the last candle, is testing the 0.5515 support level and is currently trading at 0.5505. If the last candle closes below the 0.5515 support level and the decline deepens, XRP may test the 0.5431-0.5344 support levels. In the event that the crypto market is in an uptrend and rises with the effect of positive developments, it may test the resistance levels of 0.5592-0.5665-0.5739 with its rise.
XRP, which is in an uptrend, may rise again with the purchases that may come at the EMA20 and EMA50 level in its decline and may offer a long trading opportunity. In its rise, it may decline with possible sales at the 0.56 level and may offer a short trading opportunity.
EMA20 (Blue Line) – EMA50 (Green Line) – EMA200 (Purple Line)
Supports 0.5515 – 0.5431 – 0.53 44
Resistances 0.5592 – 0.5665 – 0.5739
DOGE/USDT
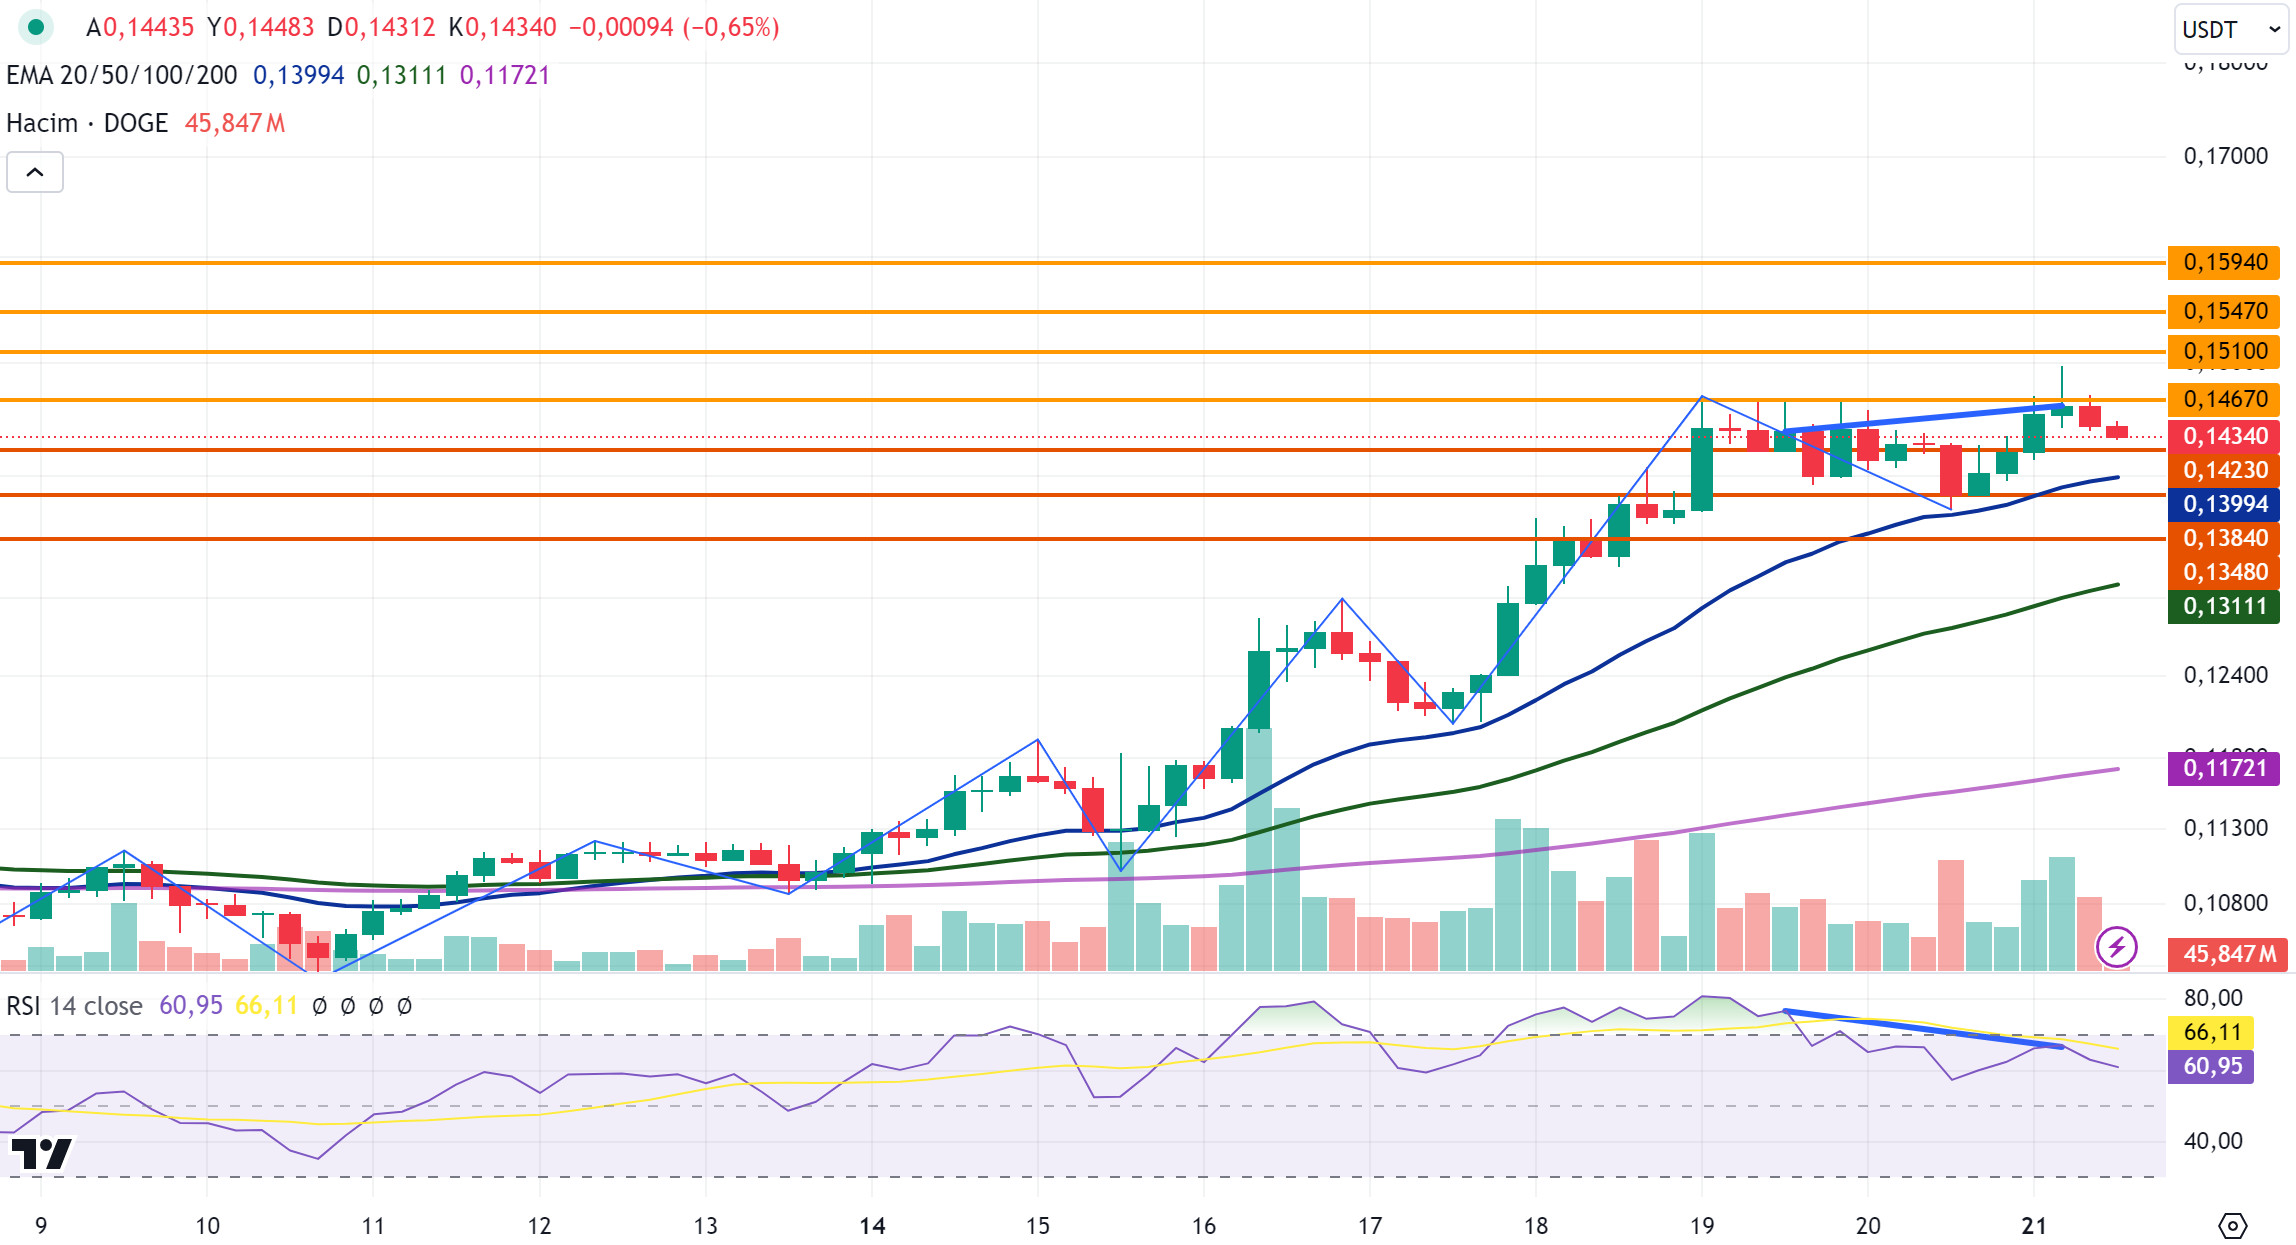
After rising as high as 0.15 today, DOGE fell with the sales and fell below the resistance level of 0.1467. In the 4-hour analysis, while there was an increase in the DOGE value, the Relative Strength Index (RSI) value decreased and negative divergence occurred. DOGE, which has declined in the last 2 candles in the 4-hour analysis after negative divergence, is currently trading at 0.1434. If the decline in DOGE continues, it may test the support levels of 0.1423-0.1384-0.1348. DOGE, which moves in parallel with the crypto market in the uptrend, can test the resistance levels of 0.1467-0.1510-0.1547 with its rise in the scenario where the decline in DOGE is replaced by the rise again.
If the decline in DOGE in the last 2 candles deepens, it may test the EMA20 level and may offer a long trading opportunity as it starts to rise again with the purchases that may come at this level.
EMA20 (Blue Line) – EMA50 (Green Line) – EMA200 (Purple Line)
Supports 0.1423 – 0.1384 – 0.1348
Resistances 0.1467 – 0.1510 – 0.1547
DOT/USDT
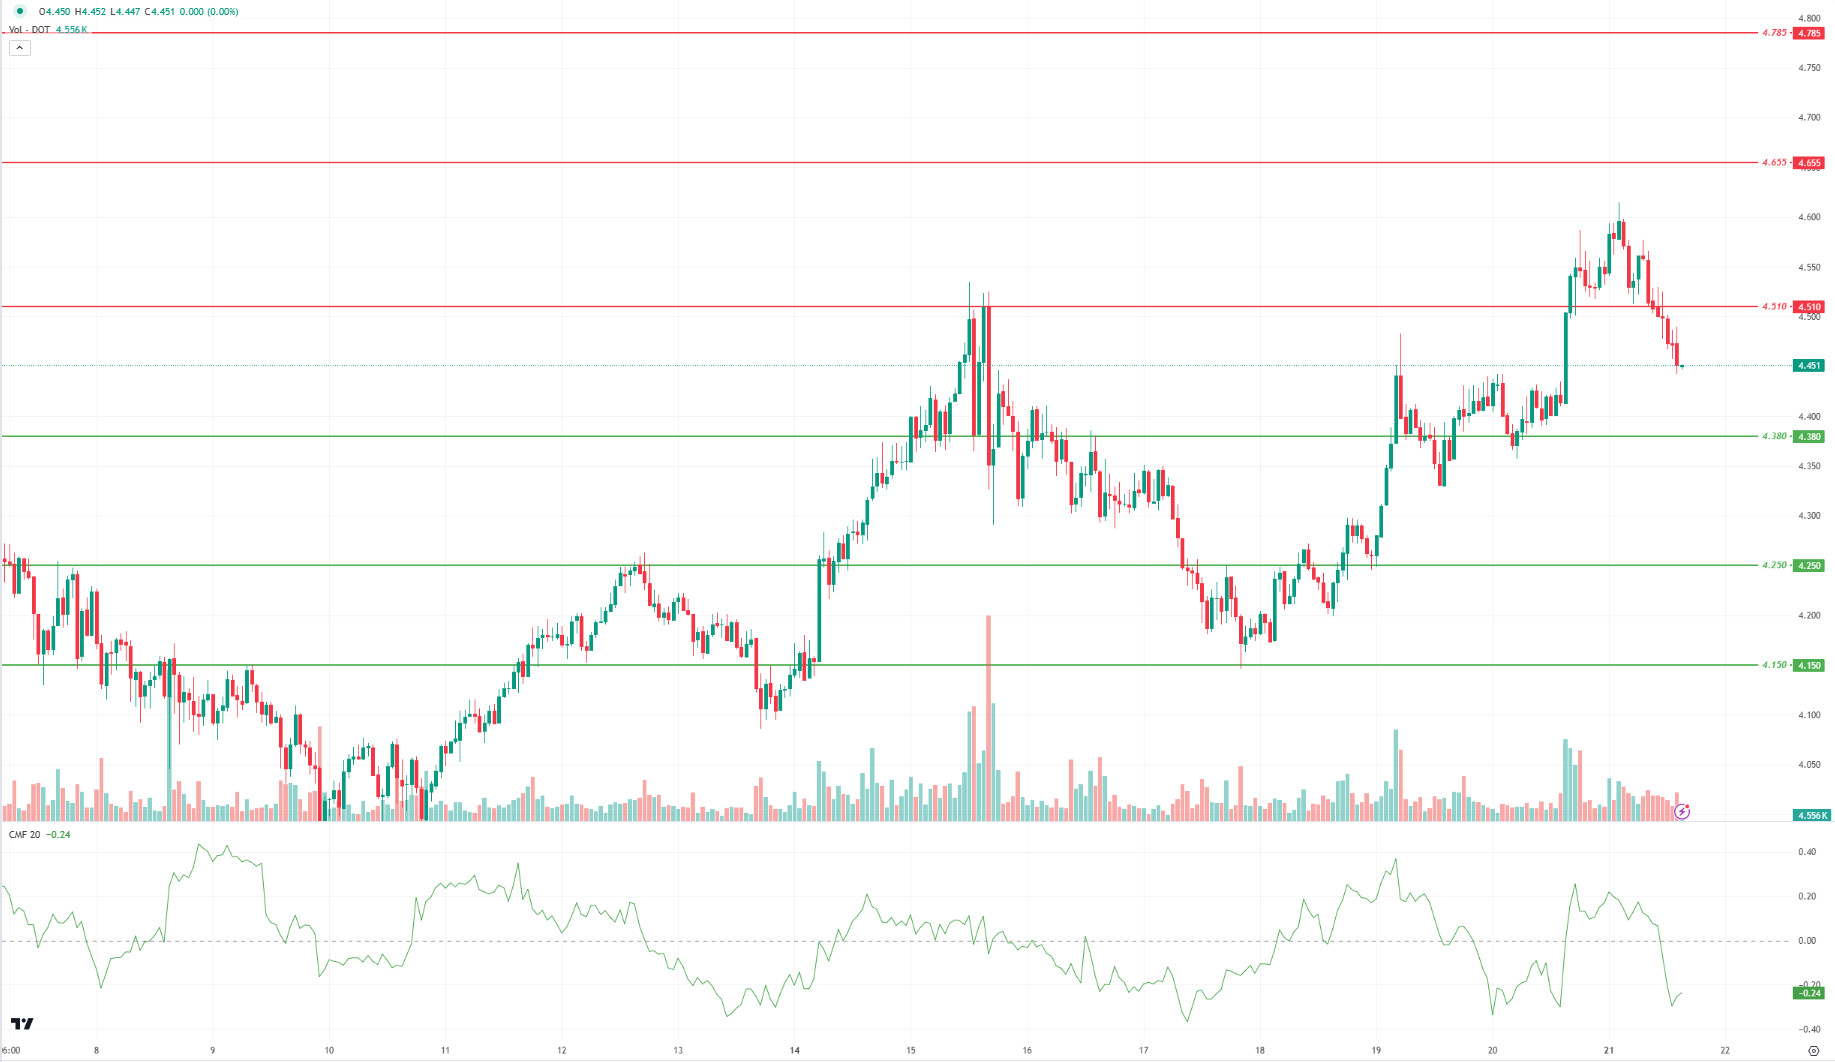
When we examine the Polkadot (DOT) chart, the price broke the 4.510 level down after the negative divergence between RSI and price. When we examine the Chaikin Money Flow (CMF) oscillator, we see that the selling pressure continues. In this context, we can expect the price to retreat towards the 4,380 level. On the other hand, if the selling pressure decreases, the price may want to break the selling pressure at the 4,510 level. If the price maintains above the 4.510 level, a movement towards the 4.655 resistance level can be seen.
Supports 4.380 – 4.250 – 4.150
Resistances 4.510 – 4.655 – 4.785
SHIB/USDT
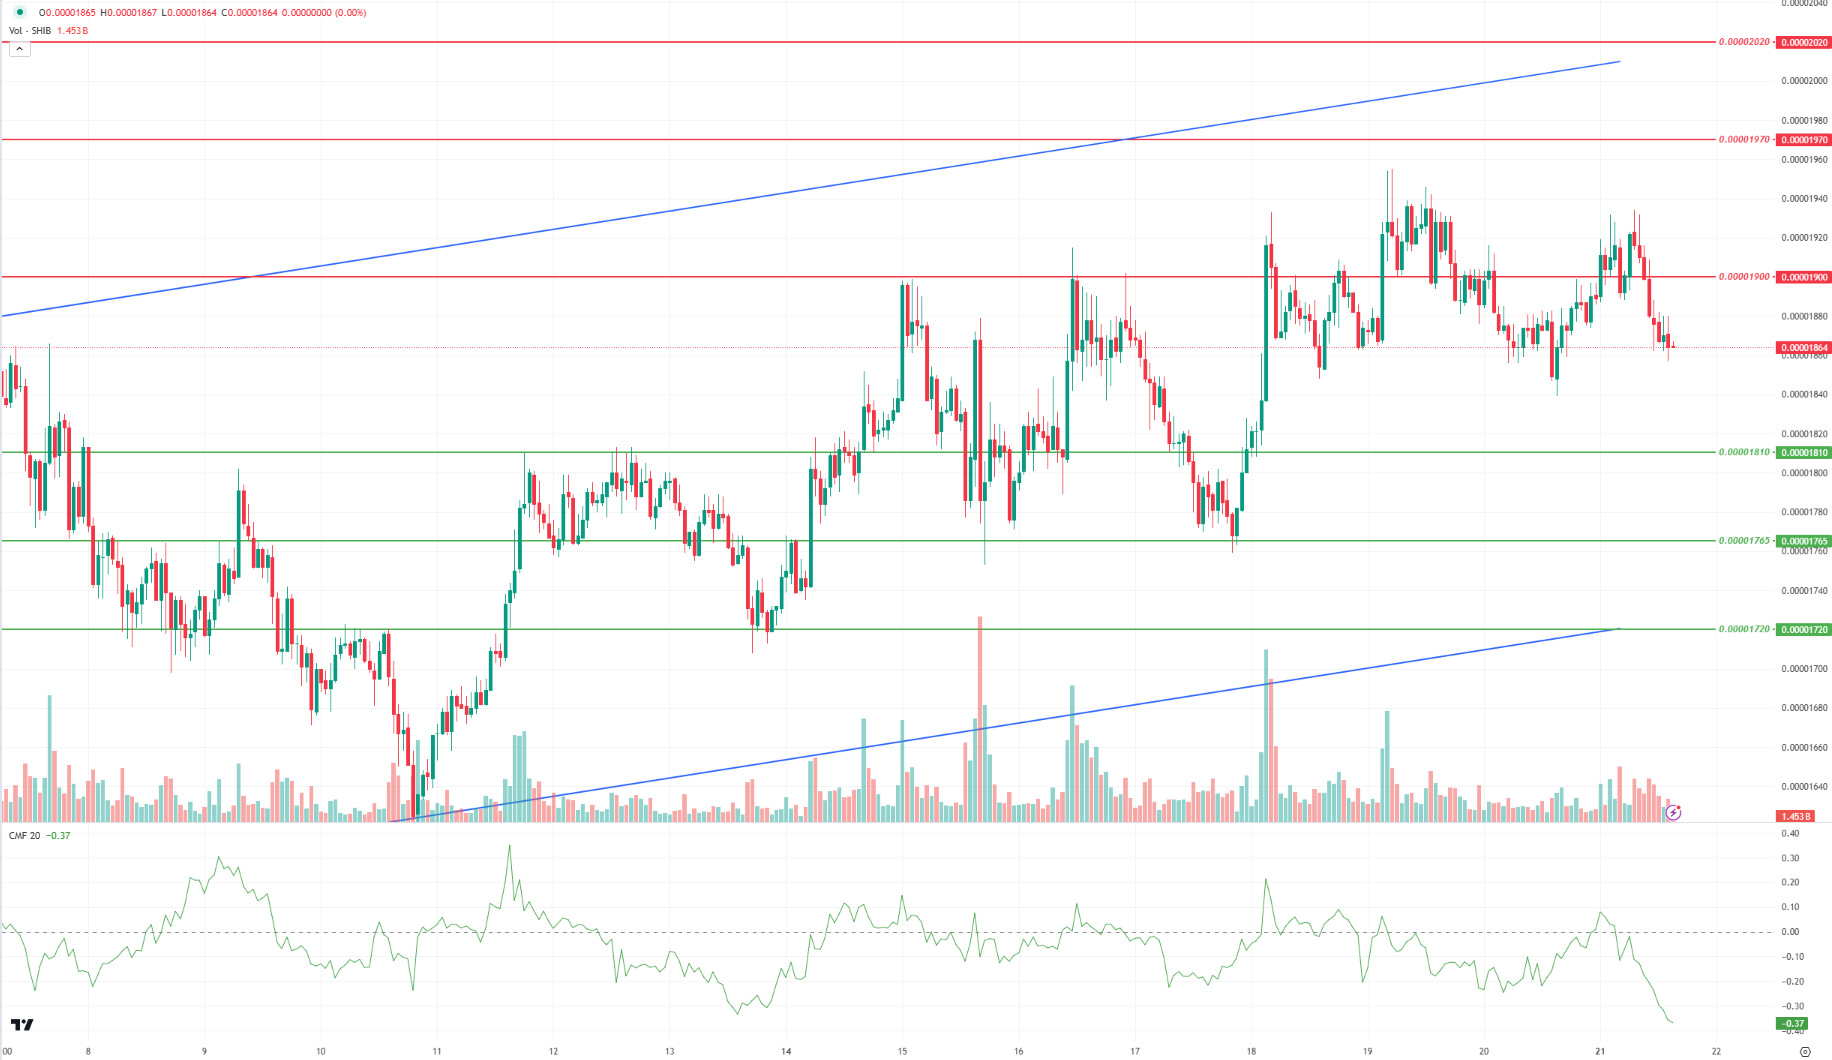
Shiba Inu (SHIB) broke the 0.00001900 level downwards. With the selling pressure increasing, the price is heading towards the next support level of 0.00001810. When we analyze the Chaikin Money Flow (CMF) oscillator, we see that the selling pressure remains strong. In this context, the price may react from 0.00001810 support. On the other hand, if the selling pressure decreases, the price may want to break the selling pressure at 0.00001900 and move towards 0.00001970 levels.
Supports 0.00001810 – 0.00001765 – 0.00001720
Resistances 0.00001900 – 0.00001970 – 0.00002020
LEGAL NOTICE
The investment information, comments and recommendations contained herein do not constitute investment advice. Investment advisory services are provided individually by authorized institutions taking into account the risk and return preferences of individuals. The comments and recommendations contained herein are of a general nature. These recommendations may not be suitable for your financial situation and risk and return preferences. Therefore, making an investment decision based solely on the information contained herein may not produce results in line with your expectations.


