MARKET SUMMARY
Latest Situation in Crypto Assets
| Assets | Last Price | 24h Change | Dominance | Market Cap. |
|---|---|---|---|---|
| BTC | 67,949.00 | 1.28% | 58.37% | 1.34 T |
| ETH | 2,491.00 | 0.55% | 13.03% | 299.60 B |
| SOLANA | 174.46 | 0.79% | 3.56% | 81.95 B |
| XRP | 0.5148 | 0.09% | 1.27% | 29.22 B |
| DOGE | 0.1429 | 3.40% | 0.91% | 20.97 B |
| TRX | 0.1633 | -1.39% | 0.61% | 14.13 B |
| CARDANO | 0.3329 | 0.05% | 0.51% | 11.64 B |
| AVAX | 25.43 | -0.27% | 0.45% | 10.34 B |
| SHIB | 0.00001696 | -0.28% | 0.43% | 9.98 B |
| LINK | 10.87 | -0.60% | 0.30% | 6.81 B |
| DOT | 4.131 | 2.98% | 0.27% | 6.24 B |
*Prepared on 10.28.2024 at 06:00 (UTC)
WHAT’S LEFT BEHIND
Tether, US Federal Investigation Allegations
The Wall Street Journal reported on Friday that the federal investigation is being led by prosecutors from the Manhattan US attorney’s office. The report was based on unnamed sources allegedly familiar with the matter. Paolo Ardoino, CEO of cryptocurrency company Tether, said on Friday that the company had not received any indication that it was under investigation by US federal authorities.
Escalating Tensions in the Middle East
Rear Admiral Daniel Hagari, spokesperson for the Israel Defense Forces, confirmed Israel’s strikes against Iran and stated that these operations have been successful. Hagari stated that if Iran responds to these attacks and escalates tensions further, Israel will be forced to respond. The statements mark a new turn in the Israeli-Iranian tension and raise concerns about possible new conflicts. Previously, Iran’s sudden attacks on Israel had led to serious declines in the crypto market.
Record Flows in Bitcoin ETFs
In October 2024, demand for spot Bitcoin exchange-traded funds (ETFs) reached a record high, with inflows exceeding $3 billion. This marks a significant development for cryptocurrency investments.
Latest Developments in Ripple vs. SEC Case
The appeal process in Ripple v. SEC will be conducted through documents, with no new evidence or hearings expected. Oral arguments may take place in September-October 2025. Due to the heavy workload, the SEC postponed the deadline for filing the main defense document to January 15, 2025.
HIGHLIGHTS OF THE DAY
Important Economic Calender Data
| Time | News | Expectation | Previous |
|---|---|---|---|
| Alchemy Pay – Join Alchemy Pay AMA Community | |||
| SingularityNet (AGIX) – 8.07MM Token Unlock |
INFORMATION
*The calendar is based on UTC (Coordinated Universal Time) time zone.
The economic calendar content on the relevant page is obtained from reliable news and data providers. The news in the economic calendar content, the date and time of the announcement of the news, possible changes in the previous, expectations and announced figures are made by the data provider institutions. Darkex cannot be held responsible for possible changes that may arise from similar situations.
MARKET COMPASS
Entering a critical week, global markets have been following developments in the Middle East and the US, the world’s largest economy. The fact that Israel did not target energy resources in its latest attack on Iran and Iranian leader Khamenei did not refer to a retaliation in his first statement eased concerns that tensions could spread to a wider geography. With this development in Asia and news flows from major countries in the continent, stock markets are generally on the positive side and European indices are expected to start the day on the positive side.
As a result of the elections held in Japan on Sunday, the ruling coalition party lost its majority in the lower house of parliament for the first time since 2009, leading to a depreciation in the Yen, while the declining currency was followed by rises in the country’s stocks. In addition, a new step to support the economy came from China, the continent’s largest economy. The People’s Bank of China (PBOC) announced a policy tool to increase liquidity in the market through reverse repo transactions.
Critical macro indicators from the US will be monitored this week and the focus will be on both the presidential election and the Federal Reserve’s interest rate announcement next week. Against this backdrop, markets believe that Trump is closer to victory and US bond yields continue to rise. Moreover, the perception that the FED will refrain from rapid rate cuts also contributes to this result.
Amid the developments in the Middle East, Asia and the US, the markets do not seem to be in a bad mood for now. Especially the tone of Israel’s attack and the statements afterwards eased the tension. On the digital assets front, we see that the depreciation on Friday has been replaced by an uptrend. While the positive perception increased the demand for risky assets, cryptocurrencies also benefited from this result.
We can say that the next two weeks are open to extremely critical developments. In this context, while we maintain our long-term bullish expectation for digital assets, we can state that a retracement, albeit short-lived, may be observed after the recent decline and the subsequent recovery trend. The positive sentiment observed on the European front, on the other hand, may cause these potential pullbacks to remain limited.
TECHNICAL ANALYSIS
BTC/USDT
On the last trading day of the week, Bitcoin retreated with the news of the US federal government’s investigation against Tether, testing the 65,600 levels. After the company CEO made statements that the news was unfounded, Bitcoin recovered again and turned its direction upwards. On the other hand, with the escalation of tension in the Middle East over the weekend, the market seems to have welcomed the response to the Iranian attack from the Israeli front. The rapid recovery in Bitcoin’s price after the developments in the middle of the intense agenda reveals that it is in a “bullish” period.
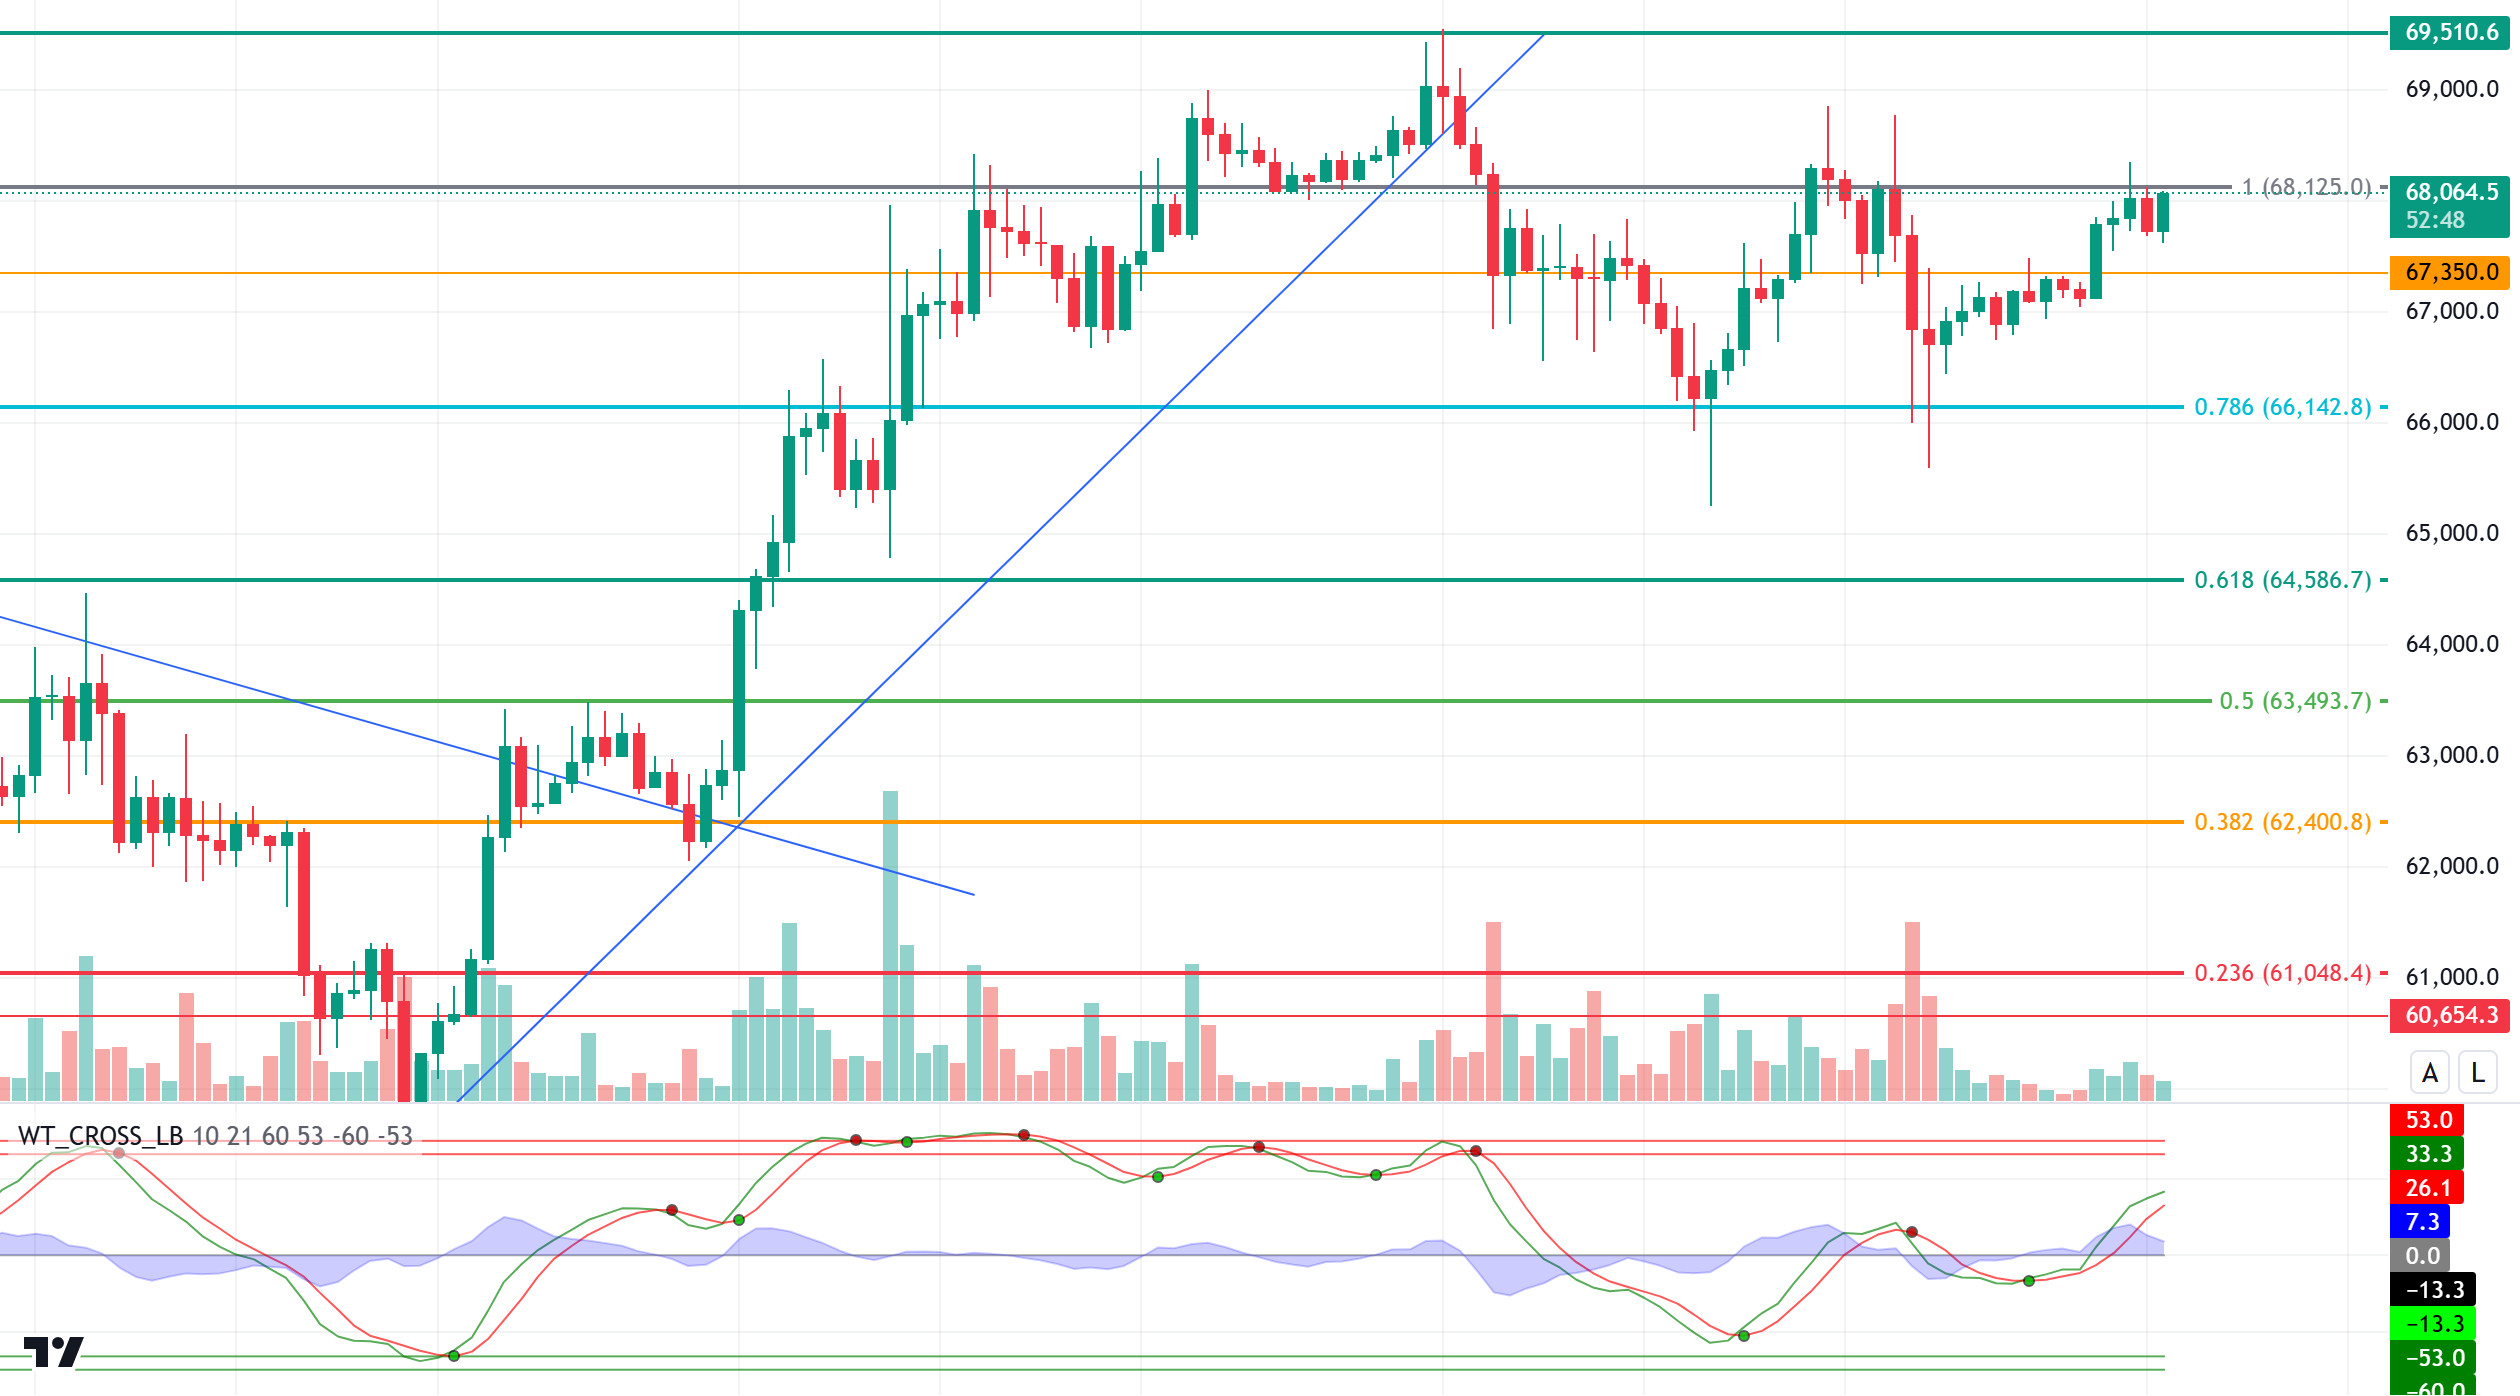
If we look at the BTC technical outlook, we see that the price has moved from the rising trend channel to the horizontal band range. The price, which occasionally sags below the Fibonacci 0.786 (66,142) support level, manages to recover and rise above this level. BTC, which previously exhibited a similar price movement, tested the Fibonacci 1 (68,125) level and was rejected from this level. Hourly closes above this level could break the horizontal band range and start a new uptrend. In case of a non-agenda development, we will first monitor the minor support level of 67,350 and then the next support level of 0.786 (66,142).
Supports 67,350 – 66,142 – 64,586
Resistances 68,125 – 69,510 – 71,458
ETH/USDT
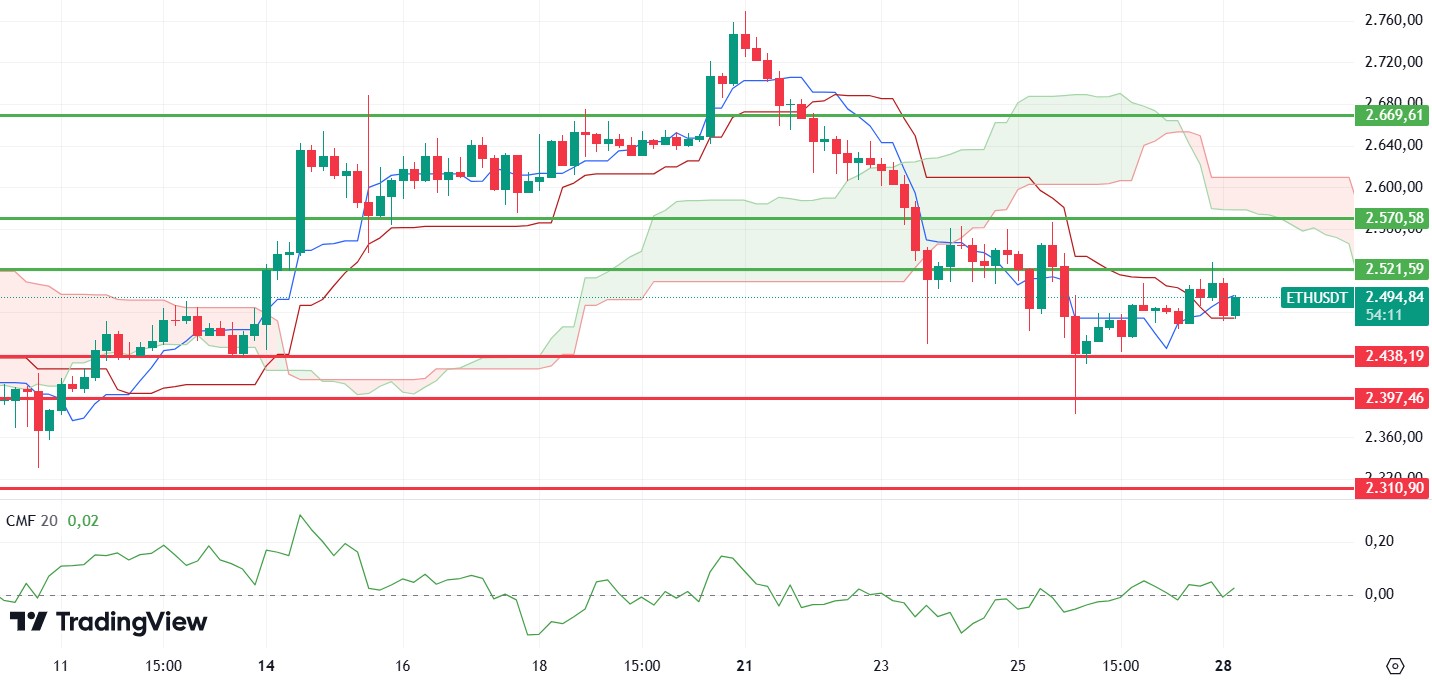
ETH, which spent the weekend relatively flat, pushed the 2,521 resistance with the rise yesterday, but fell below the 2,500 level again with a reaction. Looking at the Ichimoku indicator, there is a clear sell signal. Relative Strength Index (RSI) looks positive, while Chaikin Money Flow (CMF) has returned to positive valuation. Cumulative Volume Delta (CVD) is in balance. Movements are coming equally from spot and futures channels. In the light of this data, in summary, it can be said that if the 2,521 level cannot be regained, the decline may continue and deepen by breaking the 2,438 level. However, the recovery of the 2.521 level may start a short uptrend up to 2.570.
Supports 2,438 – 2,397 – 2,310
Resistances 2,521 – 2,571 – 2,669
LINK/USDT
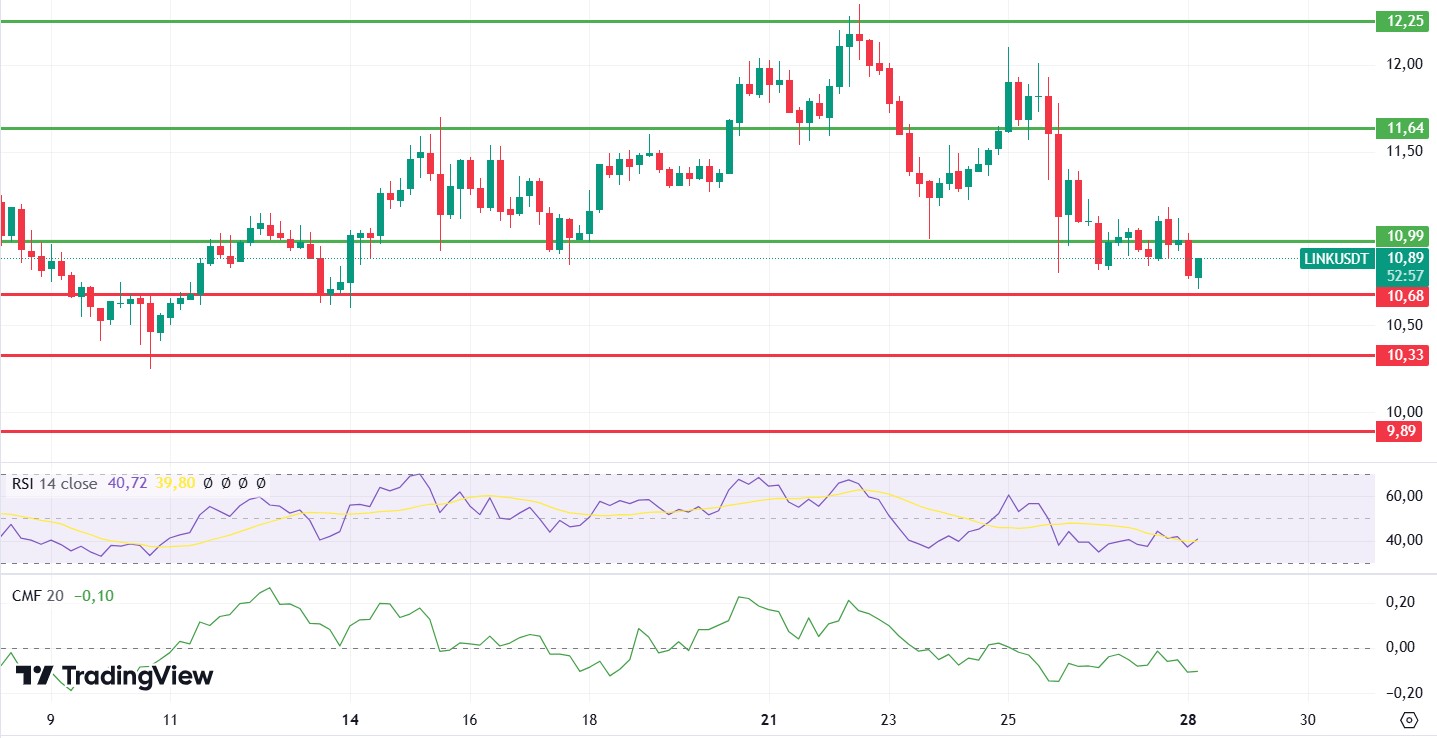
LINK has been declining sharply since Friday, losing its most important support level of 10.99 and drawing a negative picture. For LINK, which has received some reaction with the formation of a positive divergence on the Relative Strength Index (RSI), the regain of the 10.99 level may bring rises. However, negative outlooks in Chaikin Money Flow (CMF) and momentum indicate that the decline may deepen with the break of the 10.68 level.
Supports 10.68 – 10.33 – 9.89
Resistances 10.99 – 11.64 – 12.25
SOL/USDT
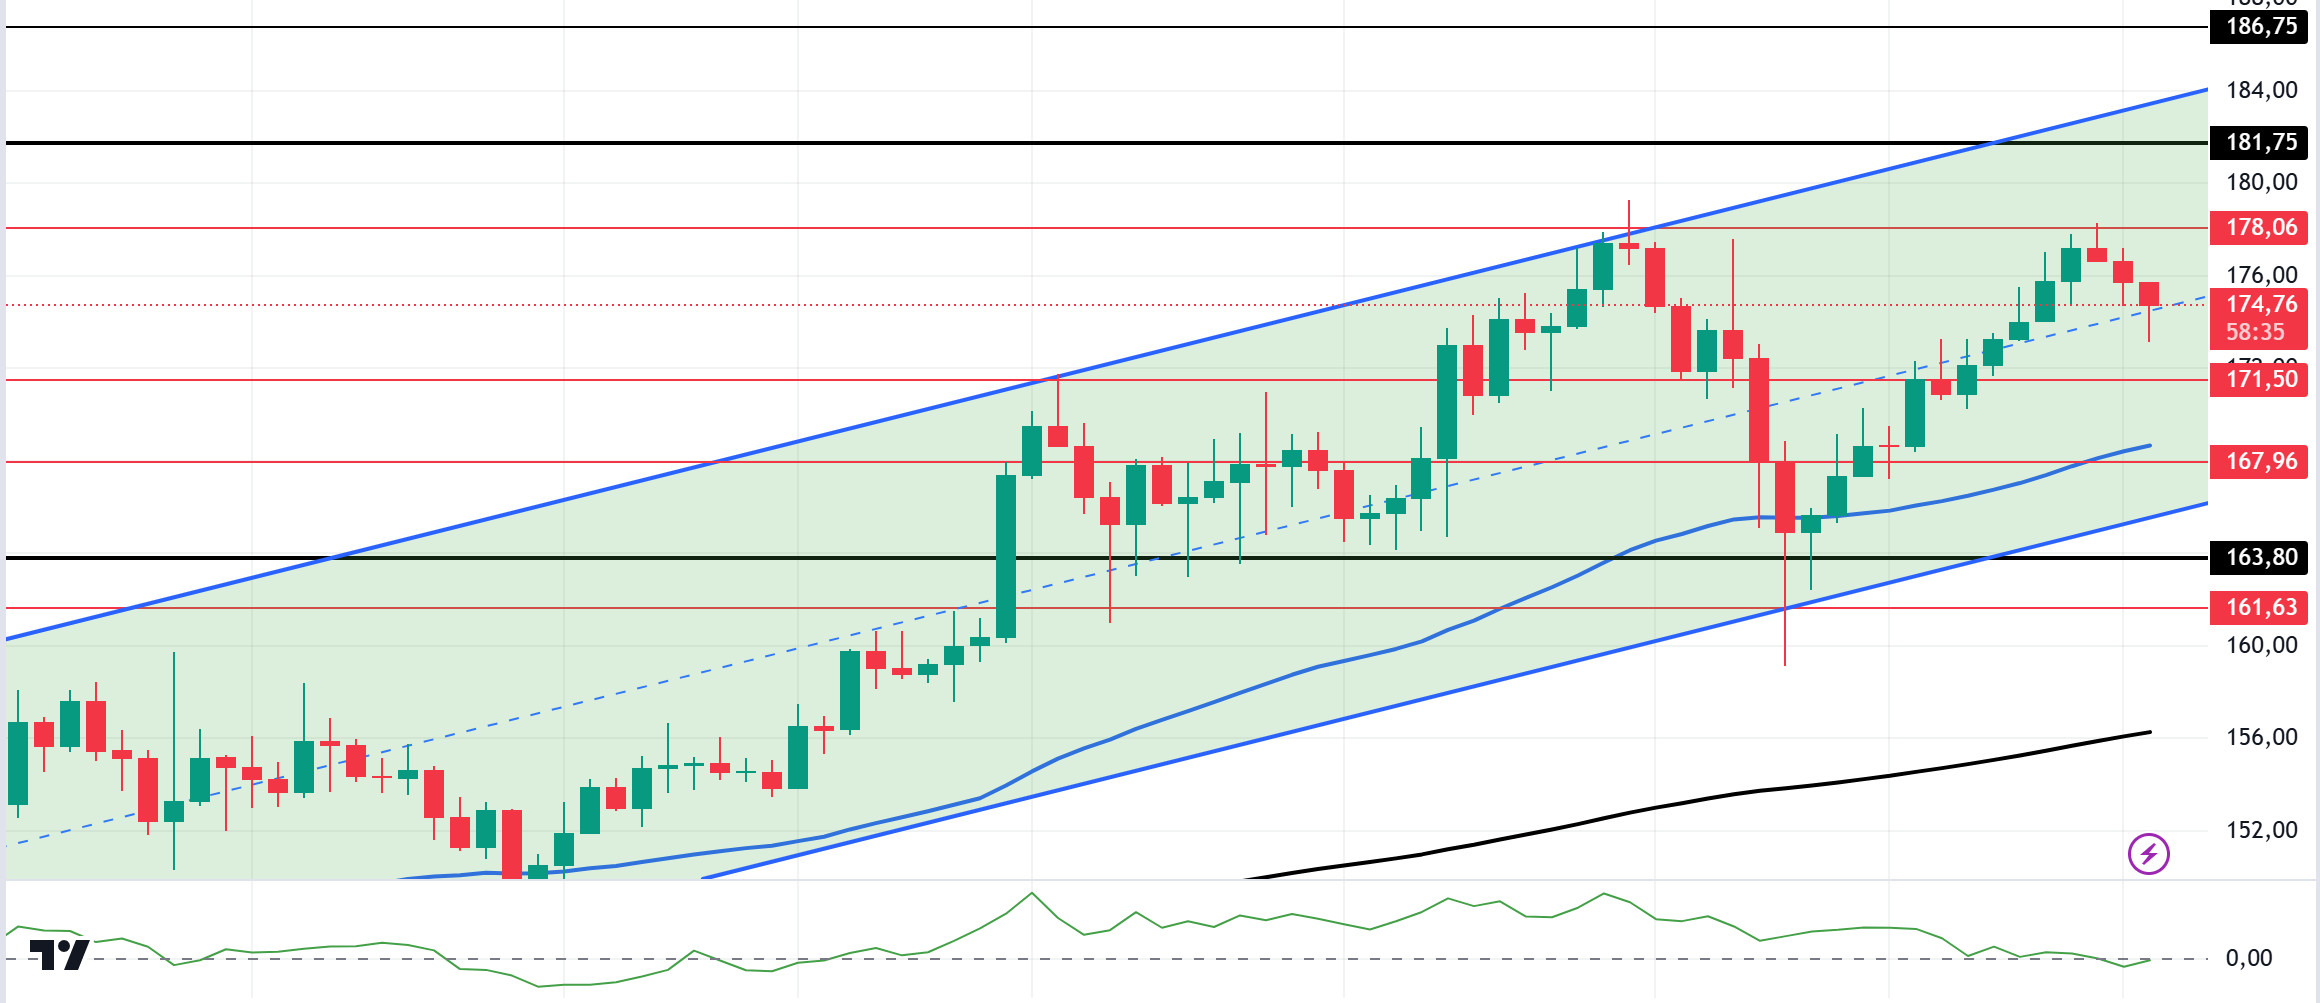
The Iran-Israel tension in the Middle East is also reflected in cryptocurrencies. The tension that started last week reduced the total market value from $ 2.3 trillion to $ 2.25 trillion. When we look at the Solana ecosystem, Solana’s $10 million BGSOL share increase and bullish indicators point to the potential for continuous upward momentum. Whale accumulation and short sales further support rally expectations. However, when we look at the Long/Short ratio, it appears as 0.8972. This is a ratio that will create selling pressure even in the short term. On the 4-hour timeframe, SOL is struggling to maintain the peak level of recent months at $179. The 50 EMA (Blue Line) continues to be above the 200 EMA (Black Line). This could mean that the uptrend will continue. However, Chaikin Money Flow (CMF)20 has turned negative. This signals that money inflows are decreasing. For this reason, SOL lost 2.4%. Nevertheless, the uptrend that started on October 10 continues. The 181.75 level is a very strong resistance point in the uptrend driven by both macroeconomic conditions and innovations in the Solana ecosystem. If it rises above this level, the rise may continue strongly. In case of possible political reasons or profit sales, support levels 163.80 – 161.63 may be triggered again. If the price comes to these support levels, a potential bullish opportunity may arise.
Supports 171.50 – 167.96 – 163.80
Resistances 178.06 – 181.75 – 186.75
ADA/USDT
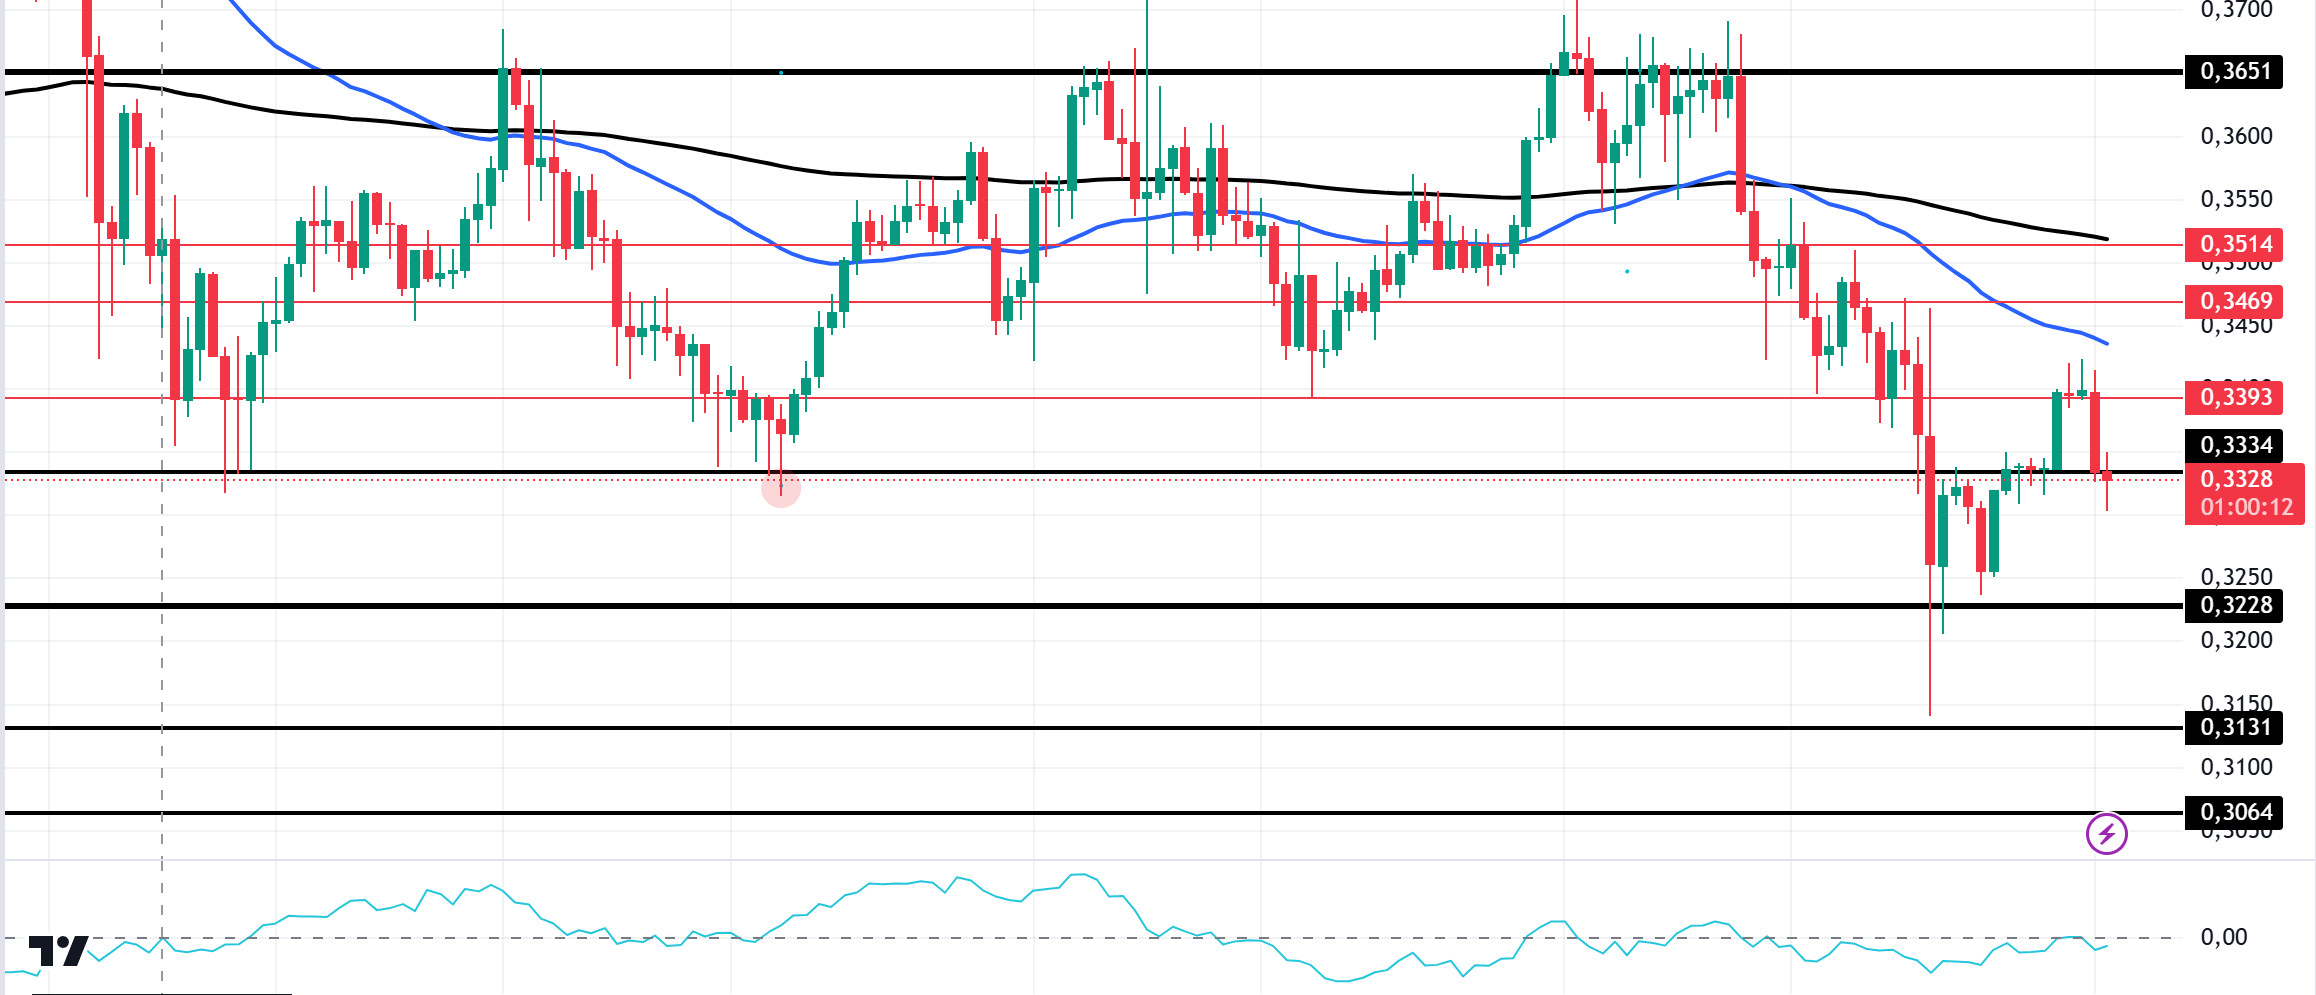
The Iran-Israel tension in the Middle East is also reflected in cryptocurrencies. The tension, which started last week, reduced the total market capitalization from $2.3 trillion to $2.25 trillion. In the Cardano ecosystem, founder Charles Hoskinson shared a bold vision for the protocol that could encourage better decentralization and self-governing systems. In a video posted on X, Hoskinson shared the reasons why his plans will work. Running a nation-state by 2030 may seem ambitious, but he believes Cardano can do it. In on-chain data, 53.2% of top traders held a short position while 46.8% held a long position. Although this ratio is very close to each other, it did not give a clear directional signal. Technically, on the 4-hour chart, the price started to price below the 50 EMA (Blue Line) and 200 EMA (Black Line). At the same time, the 50 EMA is below the 200 EMA. This shows us that the trend is bearish. Cardano price is currently stuck in a three-month range after testing resistance twice and support three times. The Chaikin Money Flow (CMF)20 indicator has a negative value. For this reason, we are seeing money outflows. As a matter of fact, ADA, which tested the 0.3651 level for the fourth time, failed to break it for this reason. If the decline continues, it may test the support level of 0.3228 once again. When it reaches this price level, it may be appropriate to buy.
Supports 0.3228 – 0.3131 – 0.3064
Resistances 0.3334 – 0.3393 – 0.3469
AVAX/USDT
AVAX, which opened yesterday at 25.41, rose approximately 1.5% during the day and closed the day at 25.77. Today, there is no planned data to be announced especially by the US and expected to affect the market. For this reason, it may be a low-volume day where we may see limited movements. News flows from the Middle East will be important for the market.
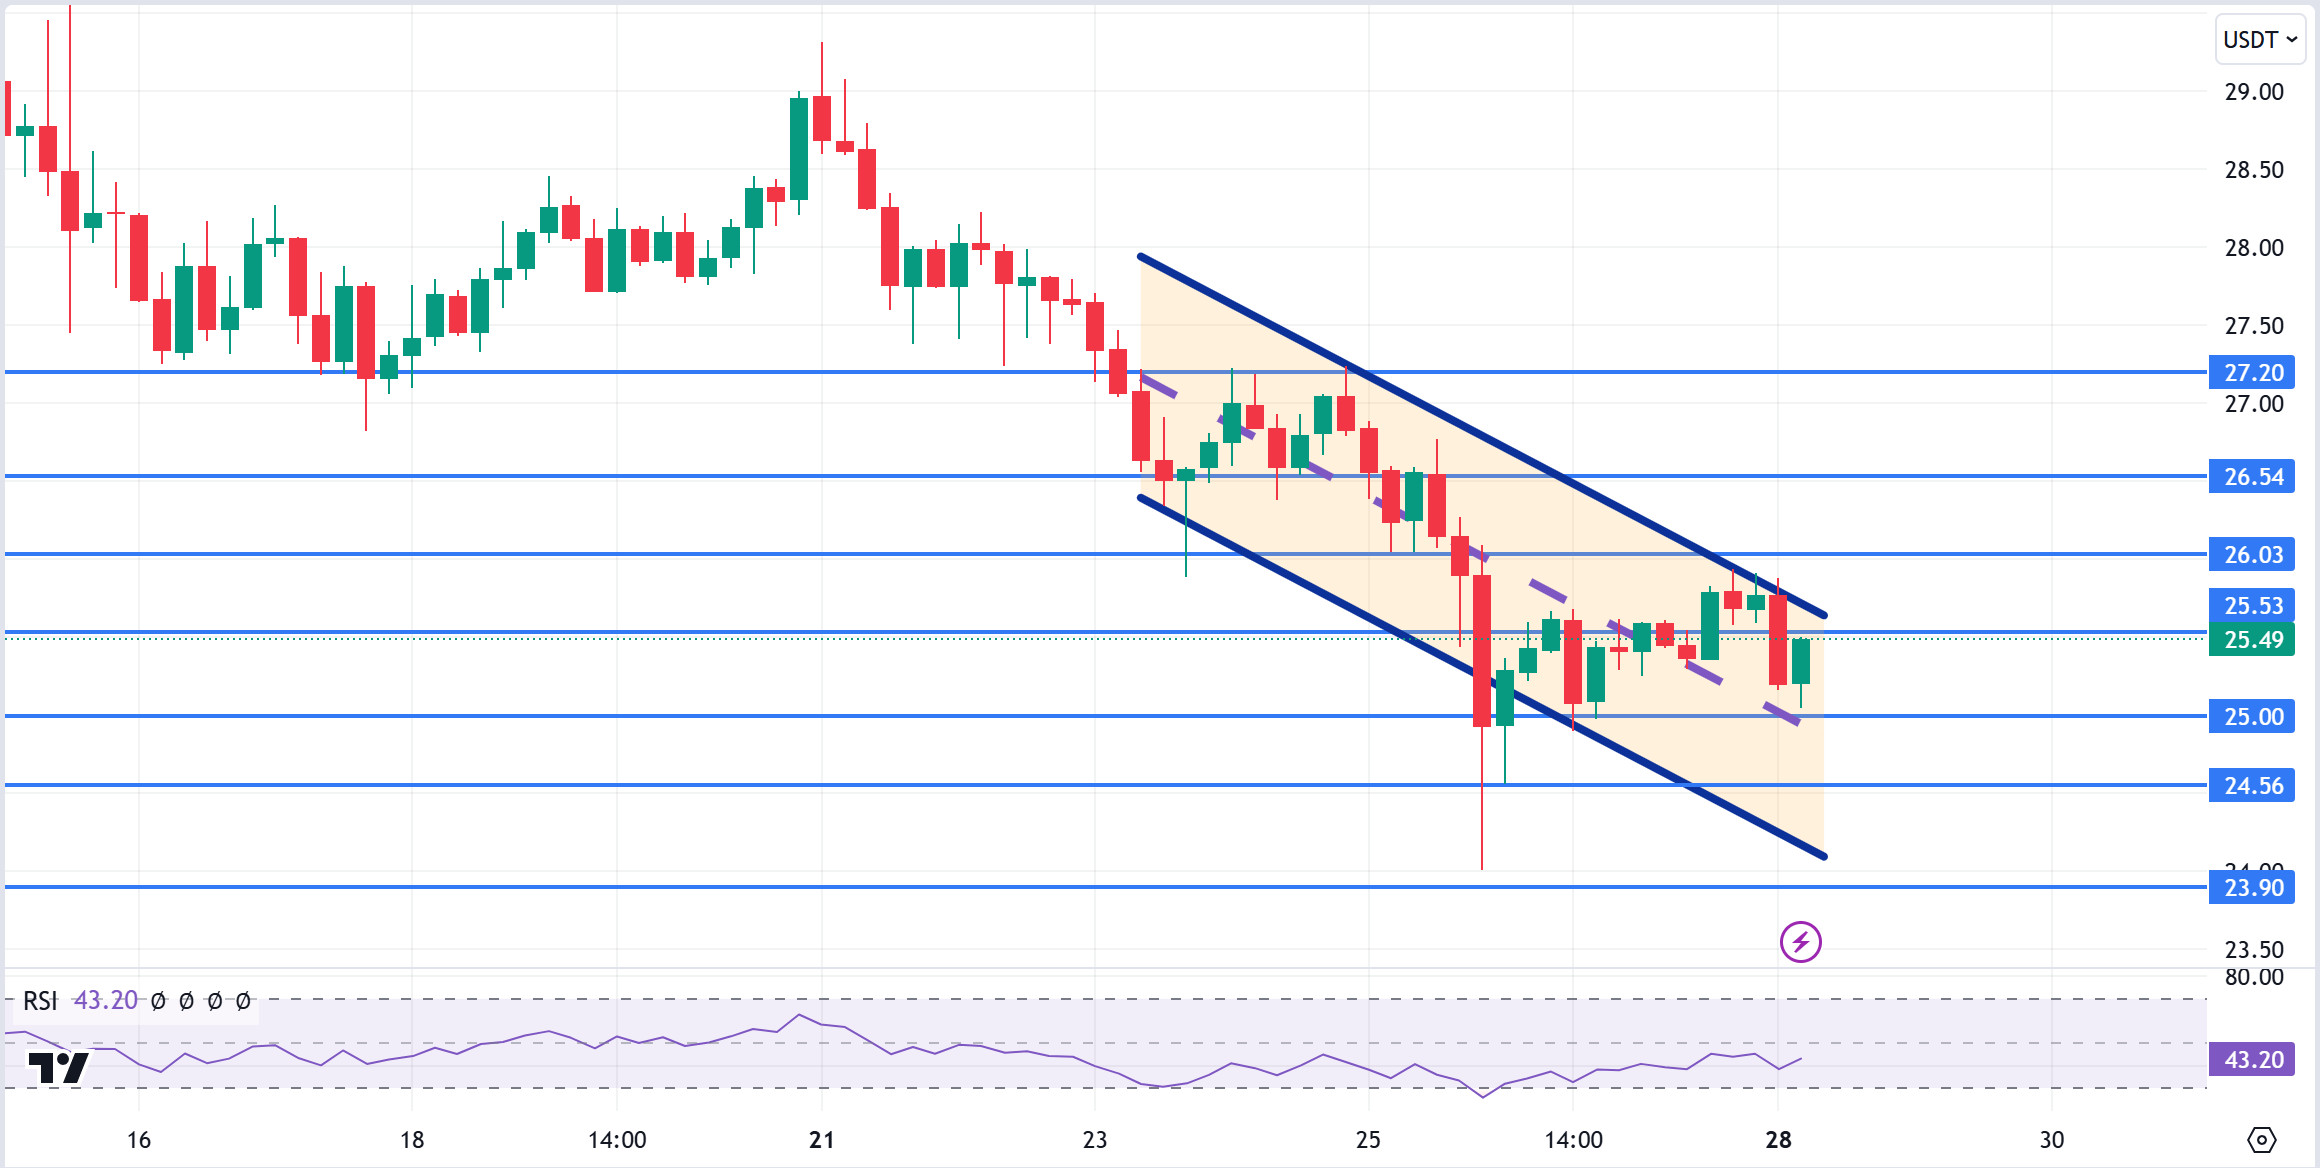
AVAX, currently trading at 25.49, is moving within the bearish channel on the 4-hour chart. It is in the upper band of the bearish channel and with a Relative Strength Index value of 43, some decline can be expected from these levels. In such a case, it may test 25.00 support. Below 25.00 support, it may want to test 24.56 support by accelerating its decline with the candle closure. On the other hand, purchases may increase if there is news that the tension in the Middle East is decreasing. In such a case, it may test the 26.03 resistance. As long as it stays above 22.80 support during the day, the desire to rise may continue. With the break of 22.80 support, sales may increase.
Supports 25.00 – 24.56 – 23.90
Resistances 25.53 – 26.03 – 26.54
TRX/USDT
TRX, which started yesterday at 0.1651, fell about 0.5% during the day and closed the day at 0.1640. There is no scheduled data for the market today. The market will be closely following the news flows regarding the tension in the Middle East.
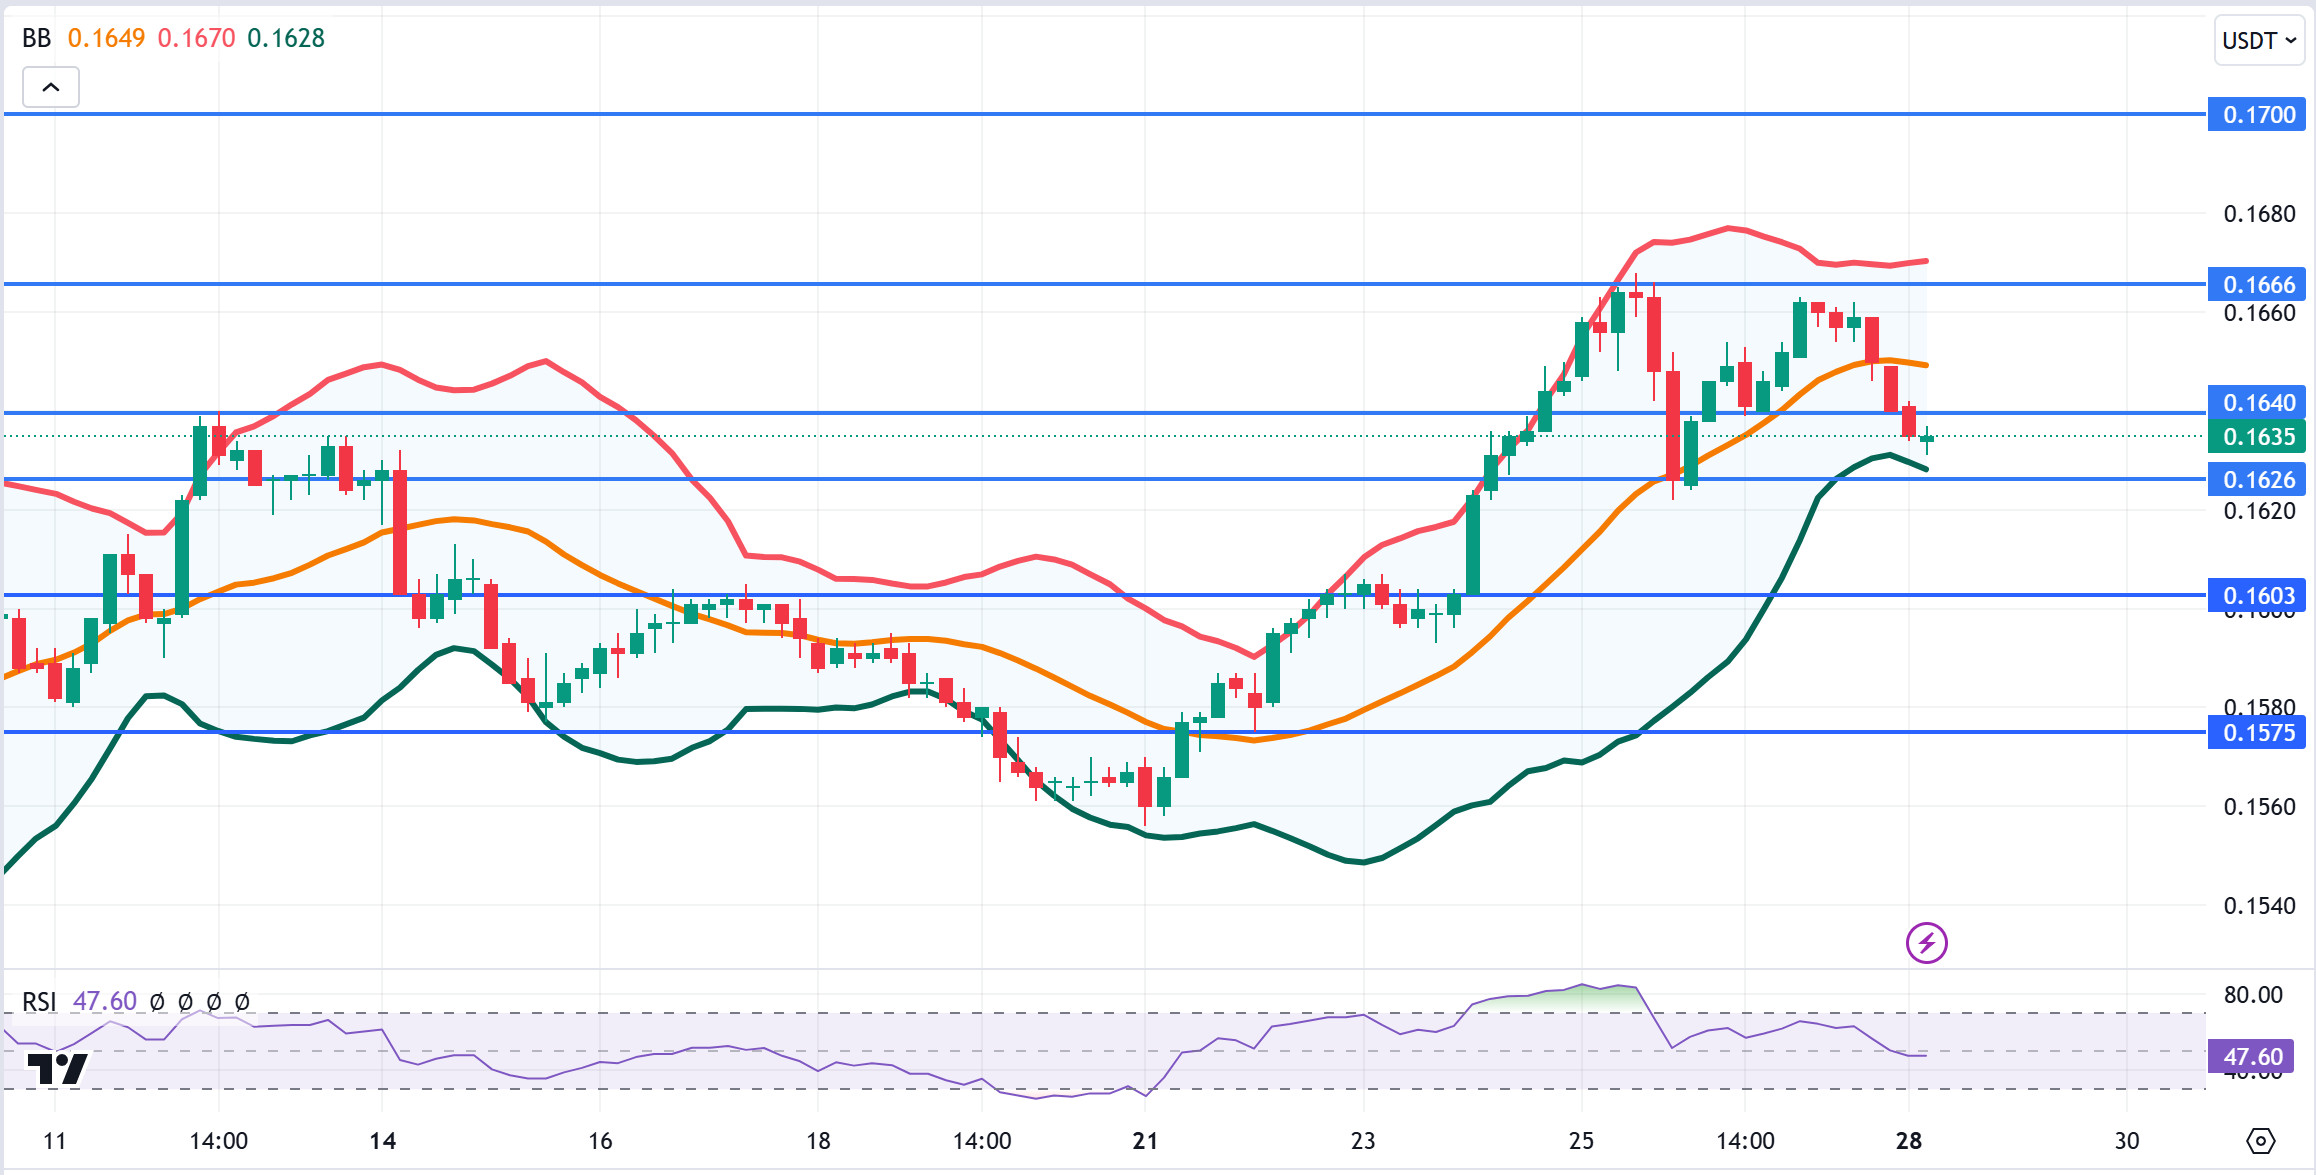
TRX, currently trading at 0.1635, is in the Bollinger lower band on the 4-hour chart. Relative Strength Index value is 47 and it can be expected to rise slightly from its current level. In such a case, it may move to the Bollinger middle and upper band and test the 0.1640 and 0.1666 resistances. However, it cannot close the candle on the 0.1640 resistance and may test the 0.1603 support with the sales reaction that will occur if news flow comes about the increasing tension in the Middle East. As long as TRX stays above 0.1482 support, the desire to rise may continue. If this support is broken downwards, sales can be expected to increase.
Supports 0.1626 – 0.1603 – 0.1575
Resistances 0.1640 – 0.1666 – 0.1700
DOT/USDT
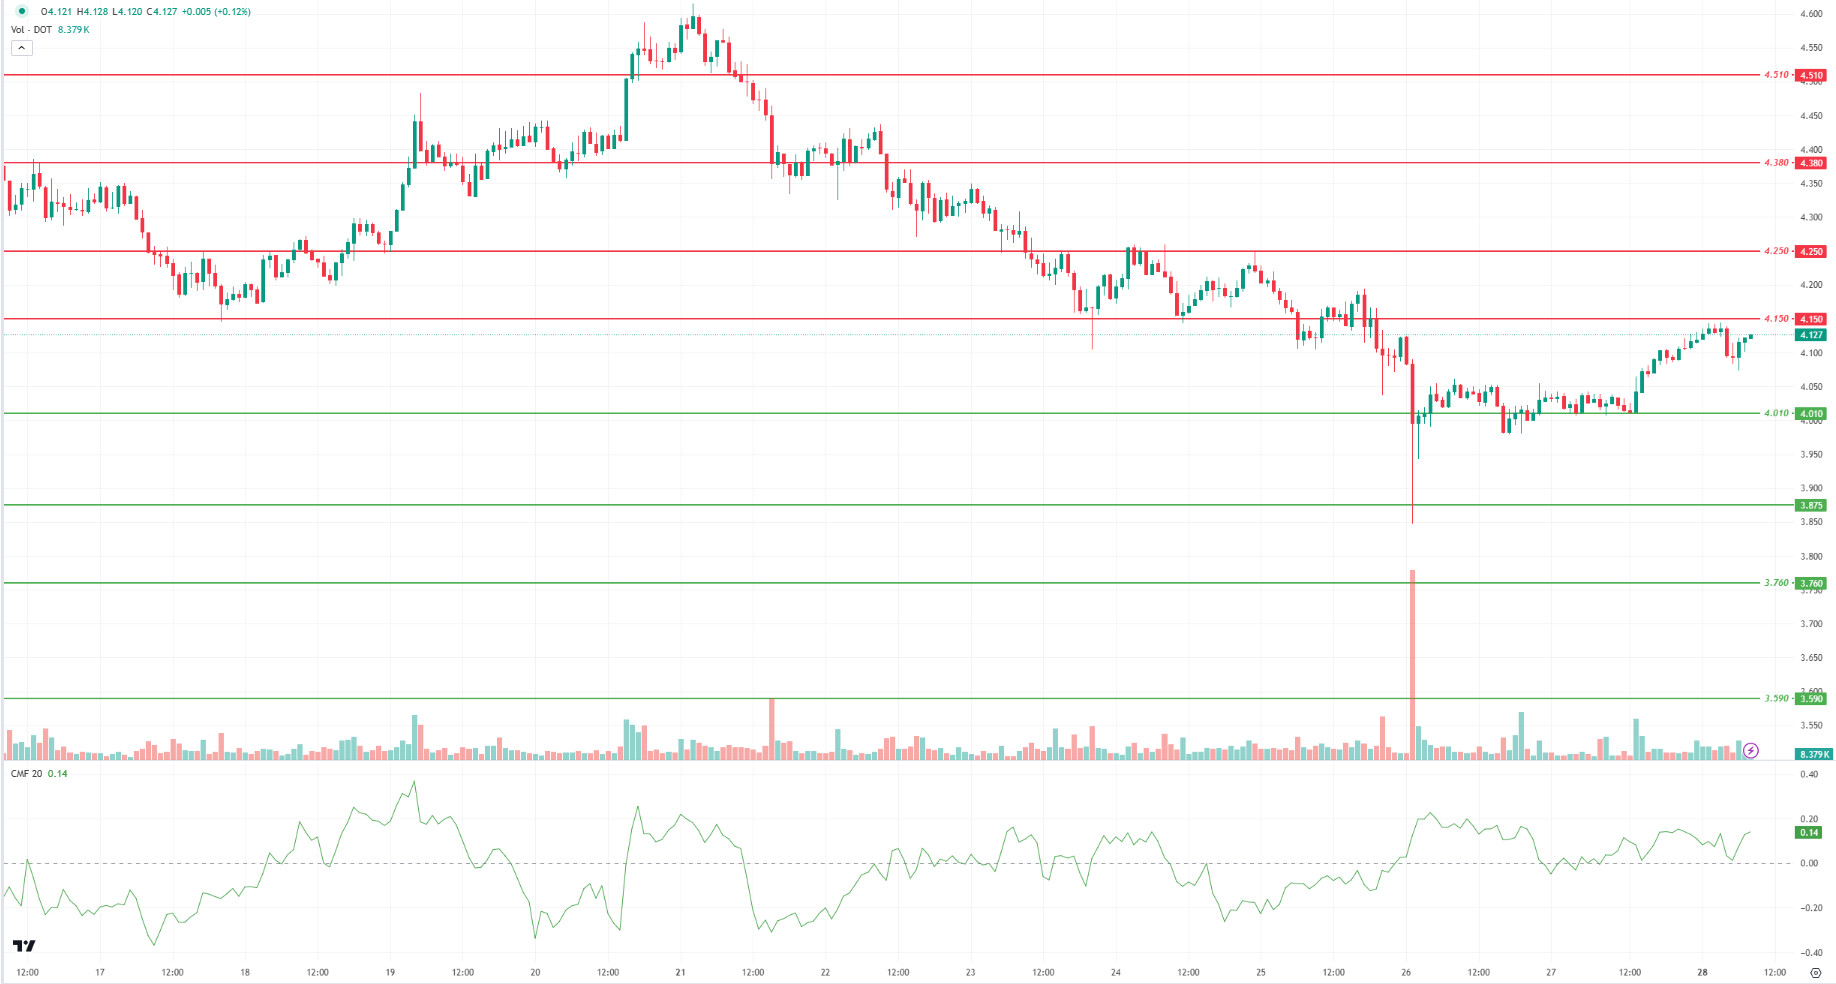
After Israel’s attack on Iran, the cryptocurrency market fell sharply. After the attack was short-lived and ineffective, the market quickly recovered. When we examine the Polkadot (DOT) chart, we see that it instantly reacted from the 3.875 support level and moved upwards. When we examine the Chaikin Money Flow (CMF) oscillator, we can say that the buyer pressure is stronger. In this context, the price may want to break the selling pressure at 4.150. In the negative scenario, we can expect the price to retreat towards 4,010 levels as the selling pressure increases.
Supports 4.010 – 3.875 – 3.760
Resistances 4.150 – 4.250 – 4.380
SHIB/USDT
Shiba Inu has released ShibaSwap 2.0, which aims to improve the user experience and increase activity on the Shibarium network. Based on user feedback, the new version includes features such as easier staking reward claiming, support for multiple swaps, and focused liquidity. These improvements can strengthen ShibaSwap’s position as the leading DEX on Shibarium and drive more trading volume and user engagement in the Shiba Inu ecosystem.
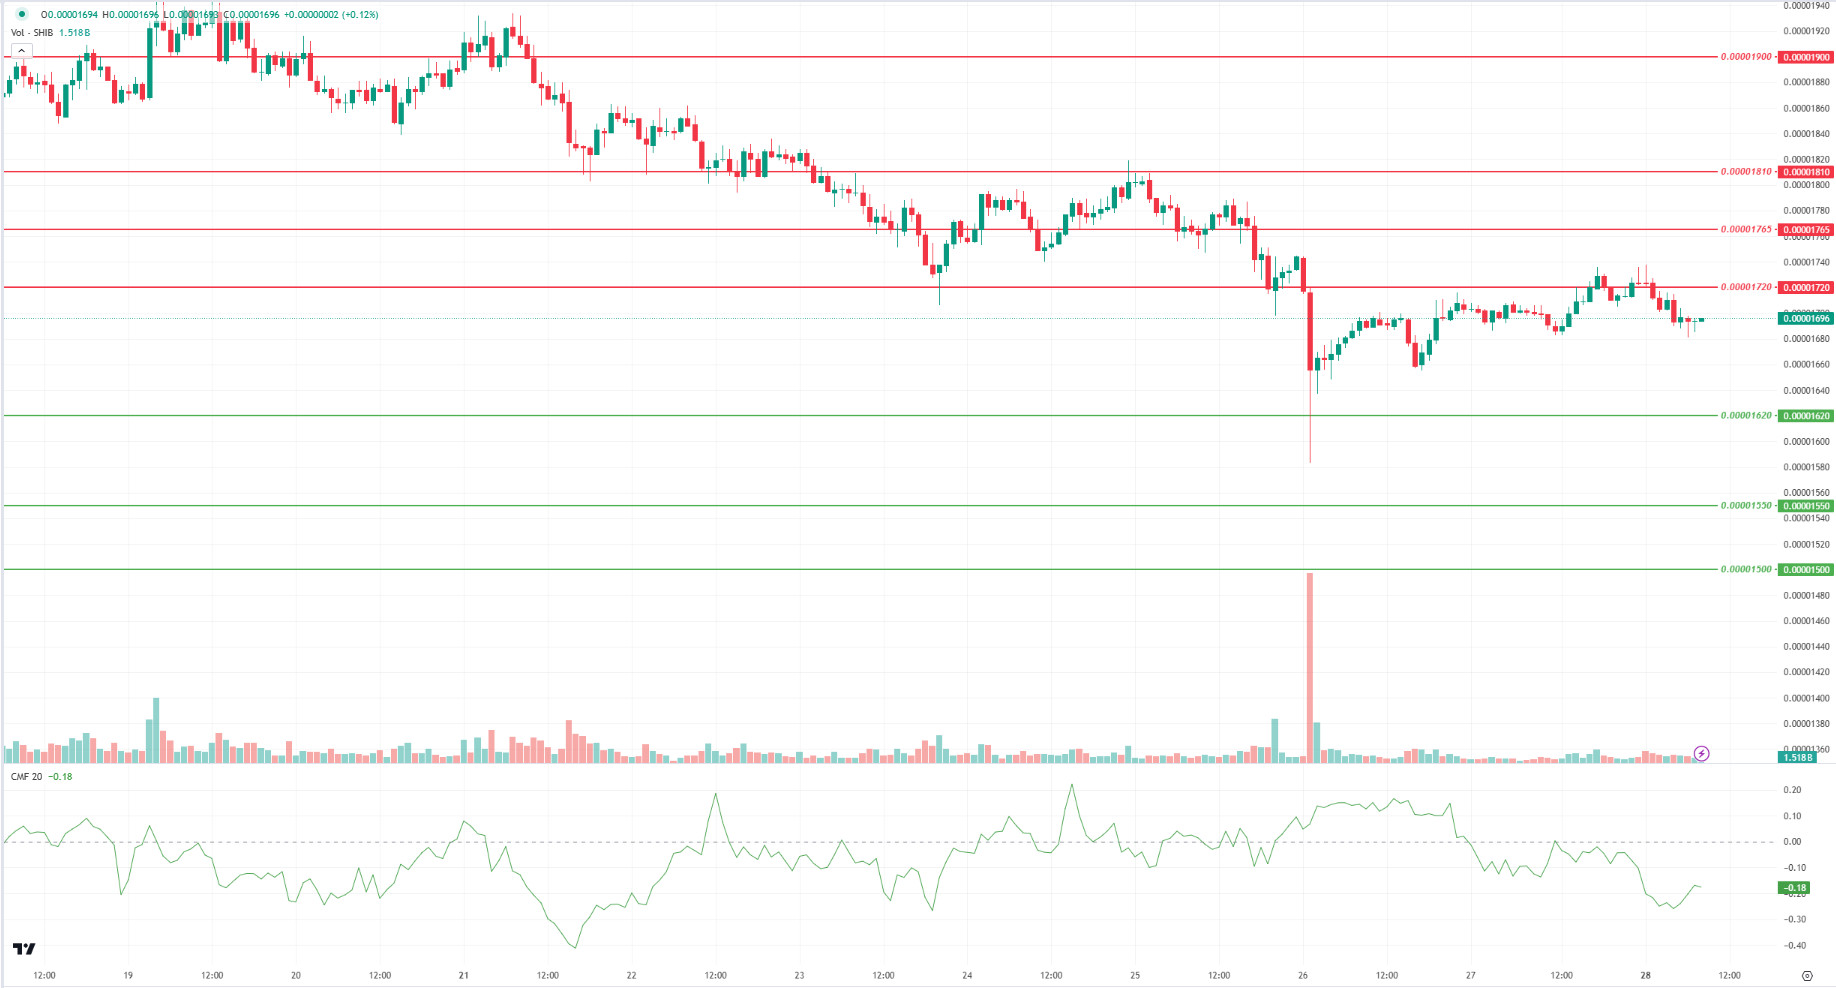
When we examine the SHIB chart, we see that it retreated to the 0.00001620 support level after the Israeli-Iranian tension. According to the Chaikin Money Flow (CMF) oscillator, we can say that the selling pressure continues strong. In this context, if the price cannot break the selling pressure at 0.00001720, we can expect a retracement towards 0.00001620 levels. On the other hand, if the price maintains above the 0.00001720 level, its next target may be the 0.00001765 level.
Supports 0.00001620 – 0.00001550 – 0.00001500
Resistances 0.00001720 – 0.00001765 – 0.00001810
LEGAL NOTICE
The investment information, comments and recommendations contained herein do not constitute investment advice. Investment advisory services are provided individually by authorized institutions taking into account the risk and return preferences of individuals. The comments and recommendations contained herein are of a general nature. These recommendations may not be suitable for your financial situation and risk and return preferences. Therefore, making an investment decision based solely on the information contained herein may not produce results in line with your expectations.


