BTC/USDT
Bitcoin has left behind another busy trading week with a lot of developments affecting the market. At the beginning of the week, Tesla’s transfer of its Bitcoins to a different wallet caused concern on the market, while its message that it would protect its assets relieved the market. As the US election wind continues at full speed, presidential candidate D. Trump’s support for Elon Musk has caused him to widen the gap with his closest rival Kamala Harris in the election polls. On the other hand, the fact that Bitcoin spot ETFs witnessed successive positive inflows was another factor that kept the market afloat. US unemployment benefit applications, one of the macroeconomic data, coming in below expectations was another important development for the market. On the last trading day of the week, the US federal government’s investigation allegations against Tether put selling pressure on the Bitcoin price, but the market recovered again as the news was unfounded. As we come to the end of October, the impact of unemployment and non-farm employment data, which are among the macroeconomic data to be announced by the US on Friday, on the market will be observed.
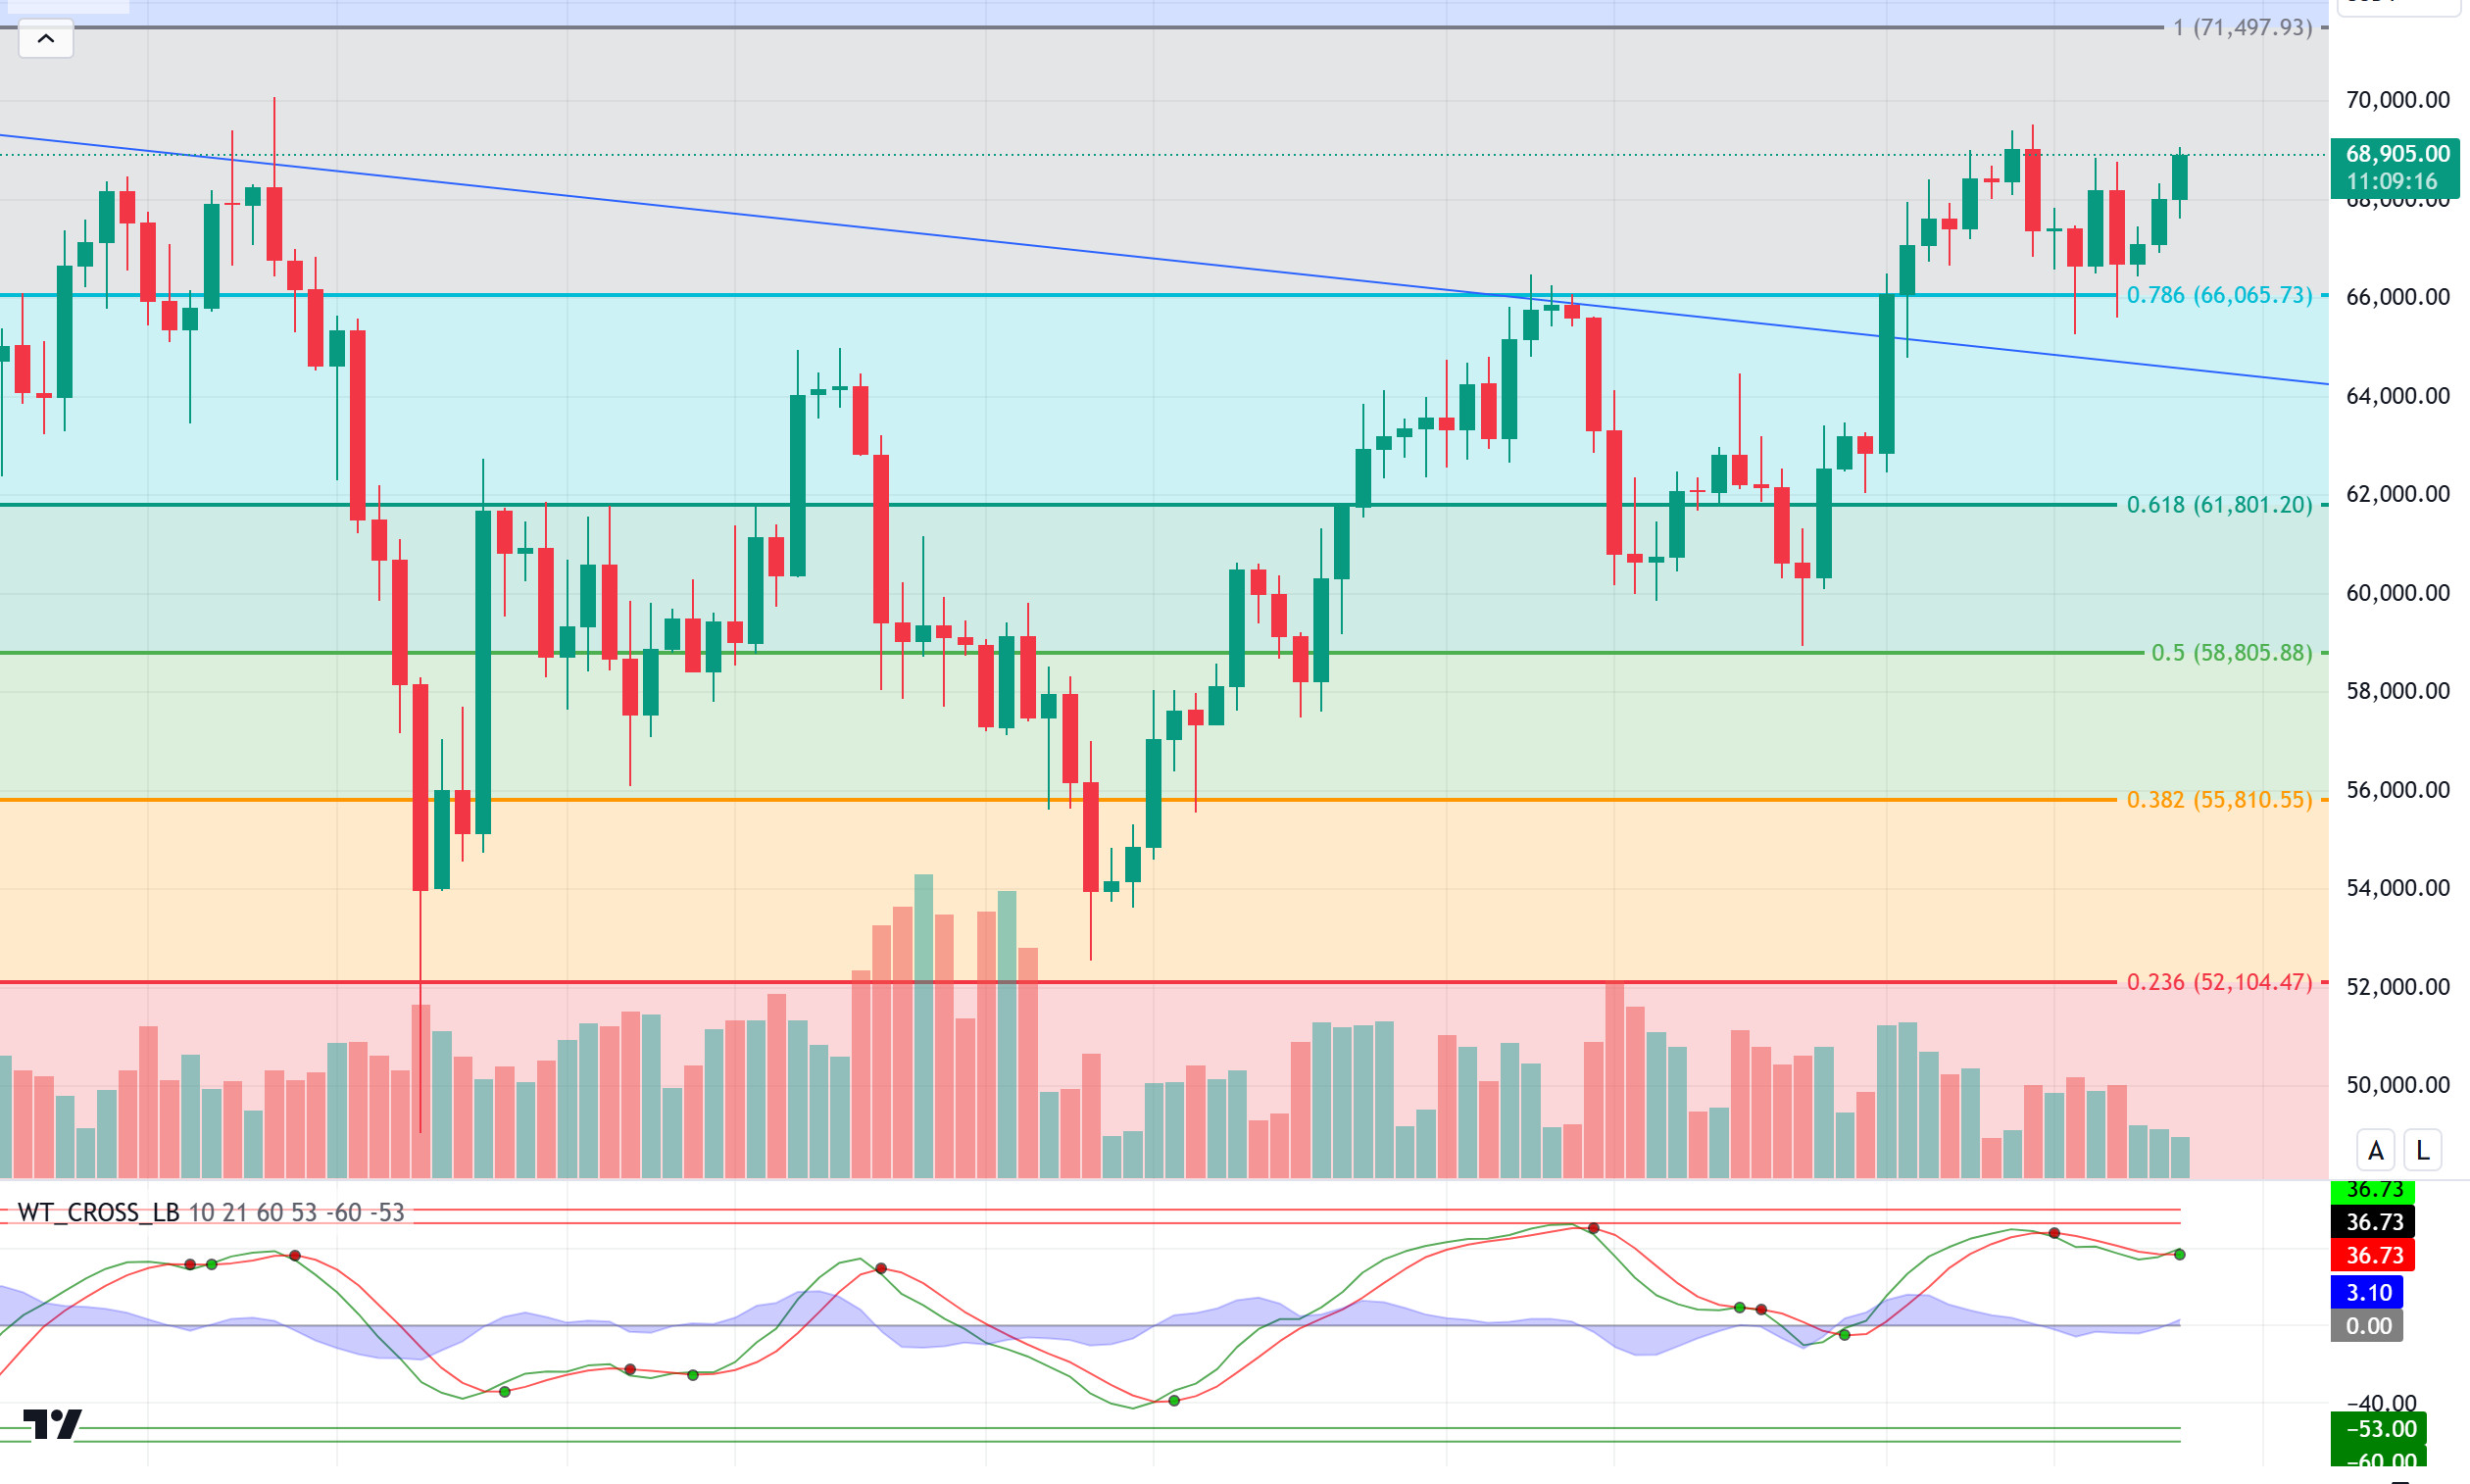
If we look at the BTC technical outlook in the light of all these developments, we see that the price settled above the Fibonacci 0.786 (66,065) level with the break of the falling trend line. The price, which tested below this level twice in the face of negative developments during the week, managed to turn its direction upwards again. The market dynamics pointing to the bull period continues to keep the price’s desire to go up alive. With the upward momentum increasing, the resistance level we will follow may be the last strong resistance before the Fibonacci 1 (71,497) ATH level. As the election atmosphere heats up, we will again follow the Fibonacci 0.786 (66,065) level in a possible retracement with increased volatility in BTC price.
Supports 66,065 – 61,800 – 58,800
Resistances 69,500- 71,497 – 73,700
ETH/USDT
After the Scroll Airdrop last week, TVLs in all Layer 2 projects in general have started to decline. Liquid Staking Token (LST), Liquid Restaking Token (LRT) prototypes Eigenlayer and Swell have also started to exit. In addition to all these, the value of Ethereum against Bitcoin has reached the bottom levels after many years. A downward break of the 0.03375 level in the ETH/BTC pair could have unexpectedly negative effects on the market.
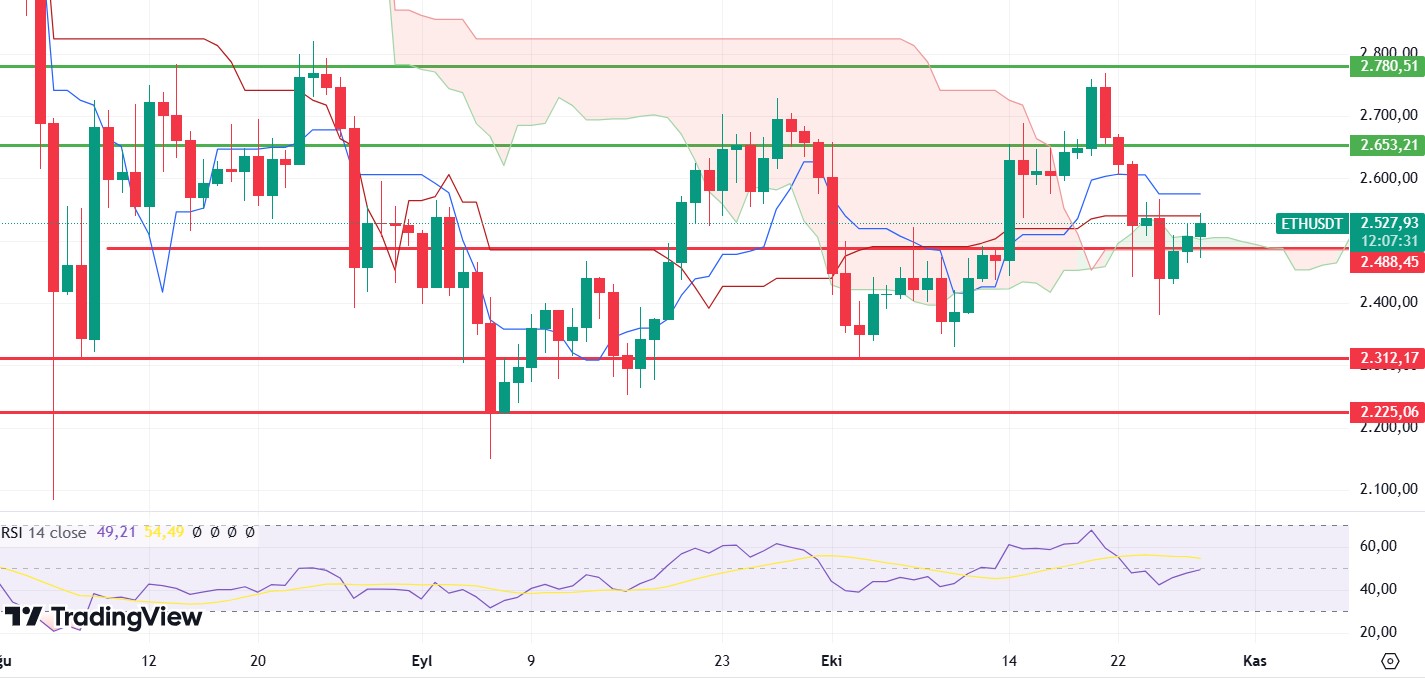
If we analyze ETH technically, Chaikin Money Flow (CMF) and Relative Strength Index (RSI) have regained their positive outlook. Especially CMF being above 0 again contributes greatly to the positive outlook for daily evaluation. ETH, which has risen above 2,500 again after the decline in the past days, has come back above the kumo cloud with this exit and seems to be trying to exceed the kijun level. After the kijun and tenkan levels are exceeded, the rise may continue by exceeding the 2,653 region. However, one of the most important points to pay attention to is the possibility that Bitcoin may face hard sales during the day as it rises from the futures channel. If this happens, weaknesses in Ethereum, which is below important support levels against Bitcoin, may grow and cause larger declines. Especially below the 2,225 level, investors may need to be careful.
Supports 2,488 – 2,312 – 2,225
Resistances 2,653 – 2,780 – 3,016
LINK/USDT
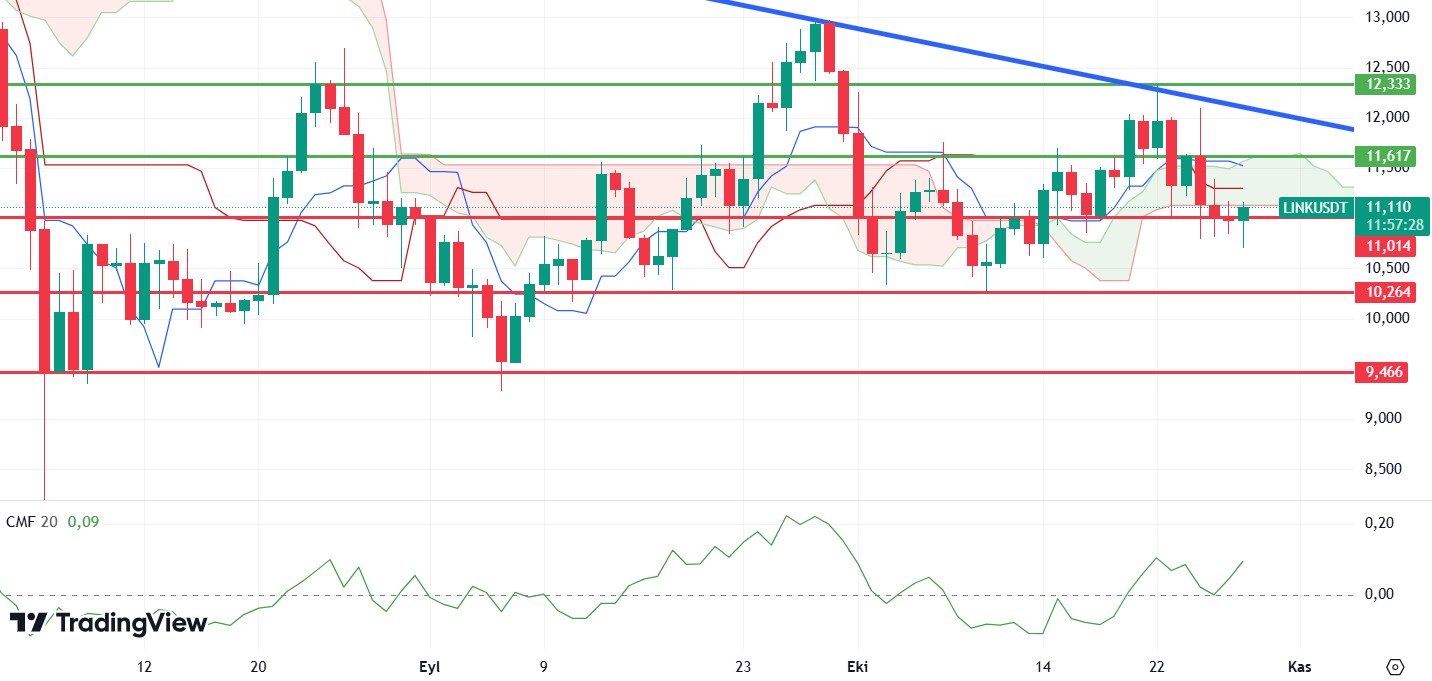
We see that the trend line, which was mentioned in last week’s analysis for LINK and indicated in blue on the chart, is clearly working again, and the reaction from this point is the decline below the 11.01 support. Chaikin Money Flow (CMF), Relative Strength Index (RSI), Commodity Channel Index (CCI) and momentum are back to positive after the recent decline. For LINK, which can rise up to the trend line again with the break of the Kumo cloud resistance level of 11.617, it can be said that the upward movement can continue strong with the break of this level. However, the break of the 10,264 main support level may continue the downtrend.
Supports 11 – 10.26 – 9.46
Resistances 11.61 – 12.33 – 13.85
SOL/USDT
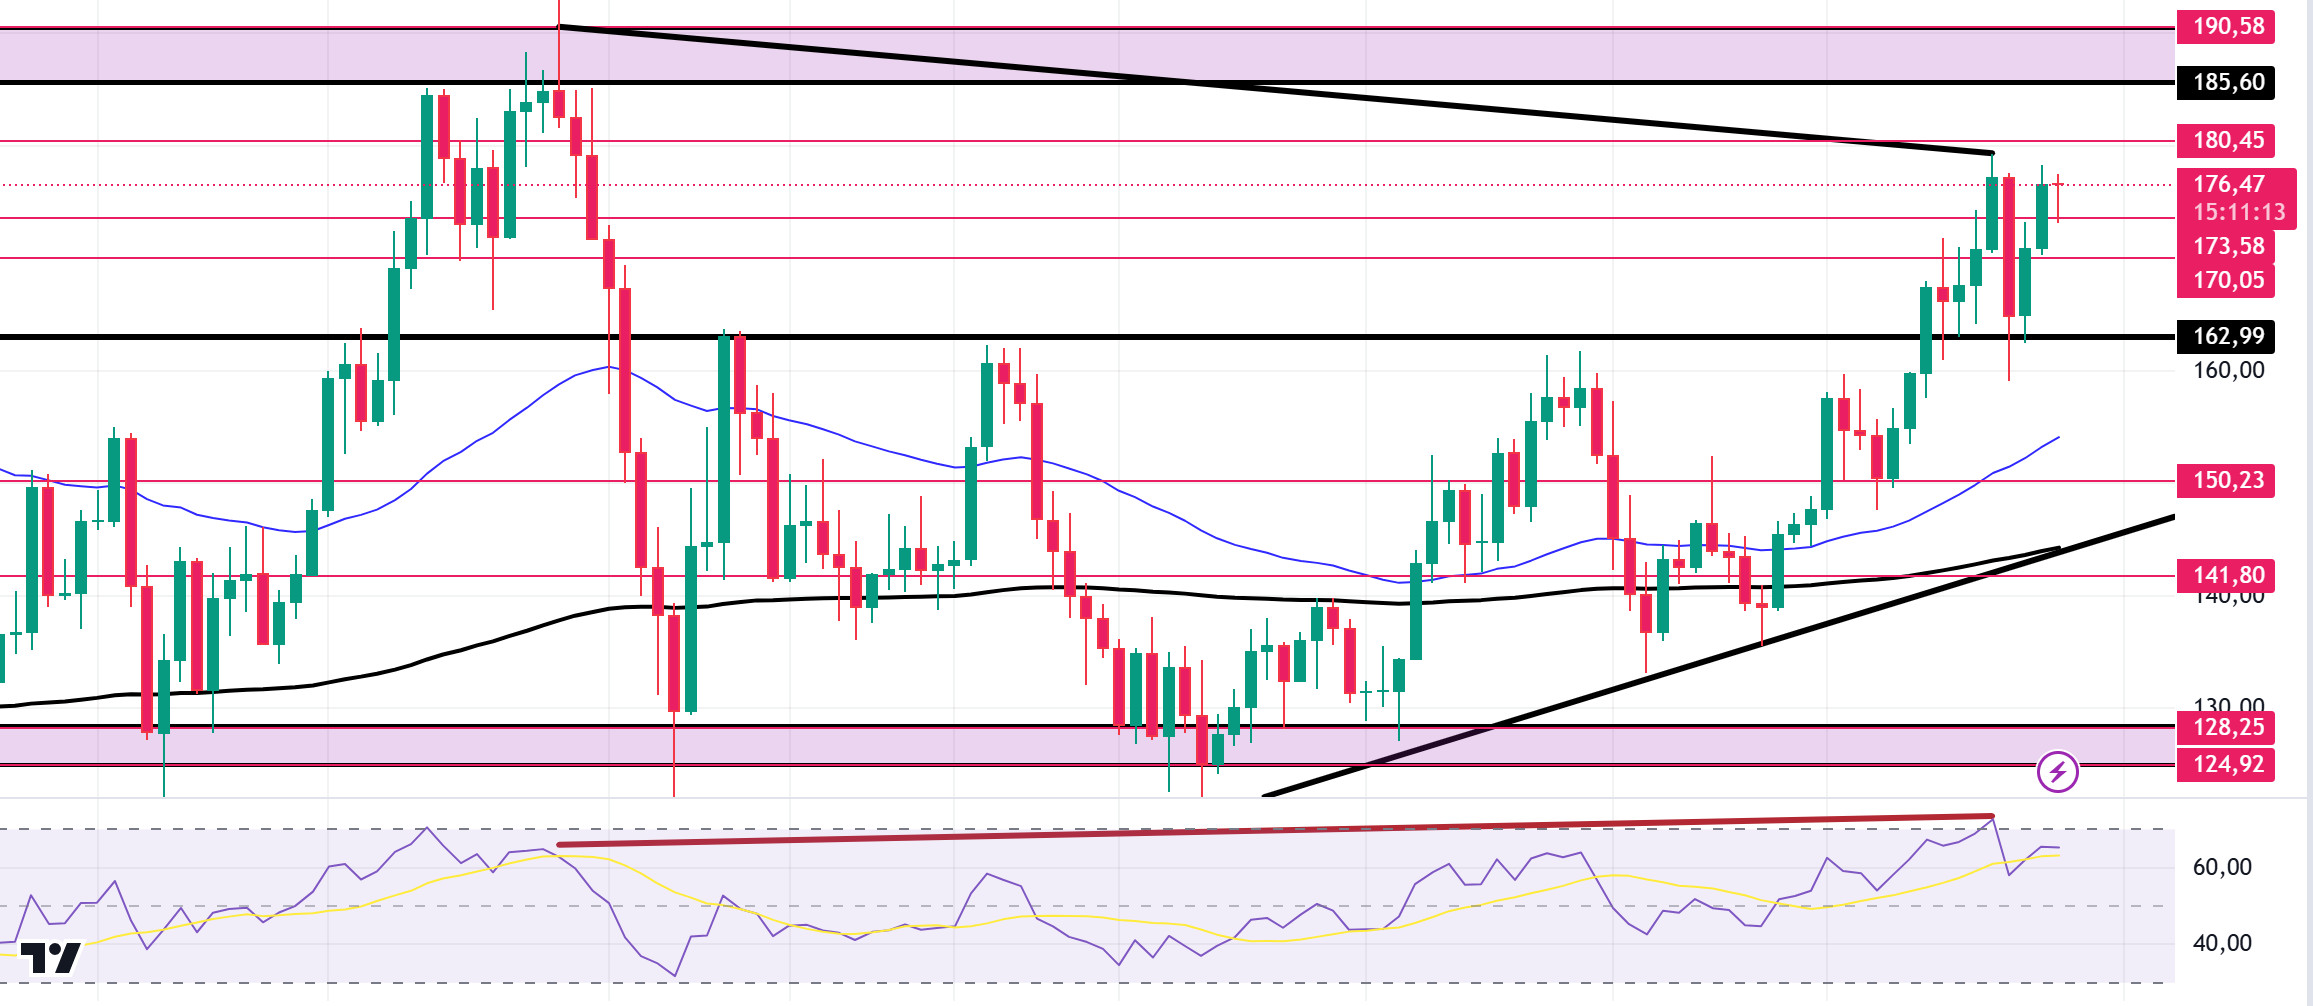
The American elections are just around the corner. According to the data from Polymarket, Trump is ahead with a rate of 66.3%. According to the data from CME, the probability of a 25 basis points rate cut is seen as 94.7%. In addition, US unemployment claims data was announced last week. Although the expectation was 243 thousand, it remained at 227 thousand. The lower-than-expected data had a positive impact on the markets. On the other hand, the US Securities and Exchange Commission (SEC) approved spot Bitcoin options applications from the New York Stock Exchange (NYSE) and the Chicago Board Options Exchange (CBOE) on October 18. The activation of options trading on the 11 approved Bitcoin ETF providers could create a significant influx of liquidity in the industry. Elmnts, which offers tokenized investment funds linked to mineral royalties in the Solana ecosystem, aims to make investing in mineral rights easier and more accessible for investors. Elmnts’ launch supports the growing trend towards tokenizing real-world assets. Also, another company, MetalCore, will use Solana Labs’ GameShift platform, which includes a storefront and payment systems for in-game purchases. Game development company Studio369 is moving its mech shooter game MetalCore to the Solana blockchain. According to an October 24 announcement, the move aims to enhance the player experience with faster on-chain transactions. The Solana blockchain currently processes an average of 3,000 transactions per second. This is one of the key metrics used to measure the network’s performance. As for developments on the Solana chain, data from Intotheblock shows that the number of addresses on the Solana blockchain increased from 3 million to 5.91 million, almost doubling the growth in two weeks. Meanwhile, Open Interest has increased significantly and now stands at around $3.43 billion, an increase of 45% since October 18th. Pump.fun, the ecosystem’s popular launchpad, sold 40,000 SOLs, totaling over 500,000 SOLs, causing concerns in the Solana market. On the other hand, according to an AMBCrypto analysis of data from Santiment, whale activity has increased significantly, with wallets holding more than 5 million Solana now holding 57% of the supply. Also, Robinhood has launched transfers for Solana. In another important data, Solana locked total value (TVL) reached $7.24 billion, its highest level since January 2022. As a result of all this data, Solana ranks third behind Ethereum and Tron in terms of blockchain revenue in Q3 of this year, and its price hit a 12-week high of 179.30, down 1.91% from here. Technically, on our daily chart, the 50 EMA (Blue Line) found support from the 200 EMA (Black Line) and provided upward movement. This indicates that the trend will continue upwards. The 162.99 level, which is a strong resistance, was broken with a voluminous candle, signaling that possible uptrends will continue. As a matter of fact, the divergence is noteworthy with the Relative Strength Index (RSI) 14 in the overbought zone. This may cause a pullback in the price. If the positive results in macroeconomic data and positive developments in the ecosystem continue, the first major resistance level seems to be 185.60. In case of declines due to political developments or negative news in the Solana ecosystem, the 162.99 level can be followed and a buying point can be determined.
Supports 173.58 – 170.05 – 162.99
Resistances 180.45 – 185.60 – 190.58
ADA/USDT
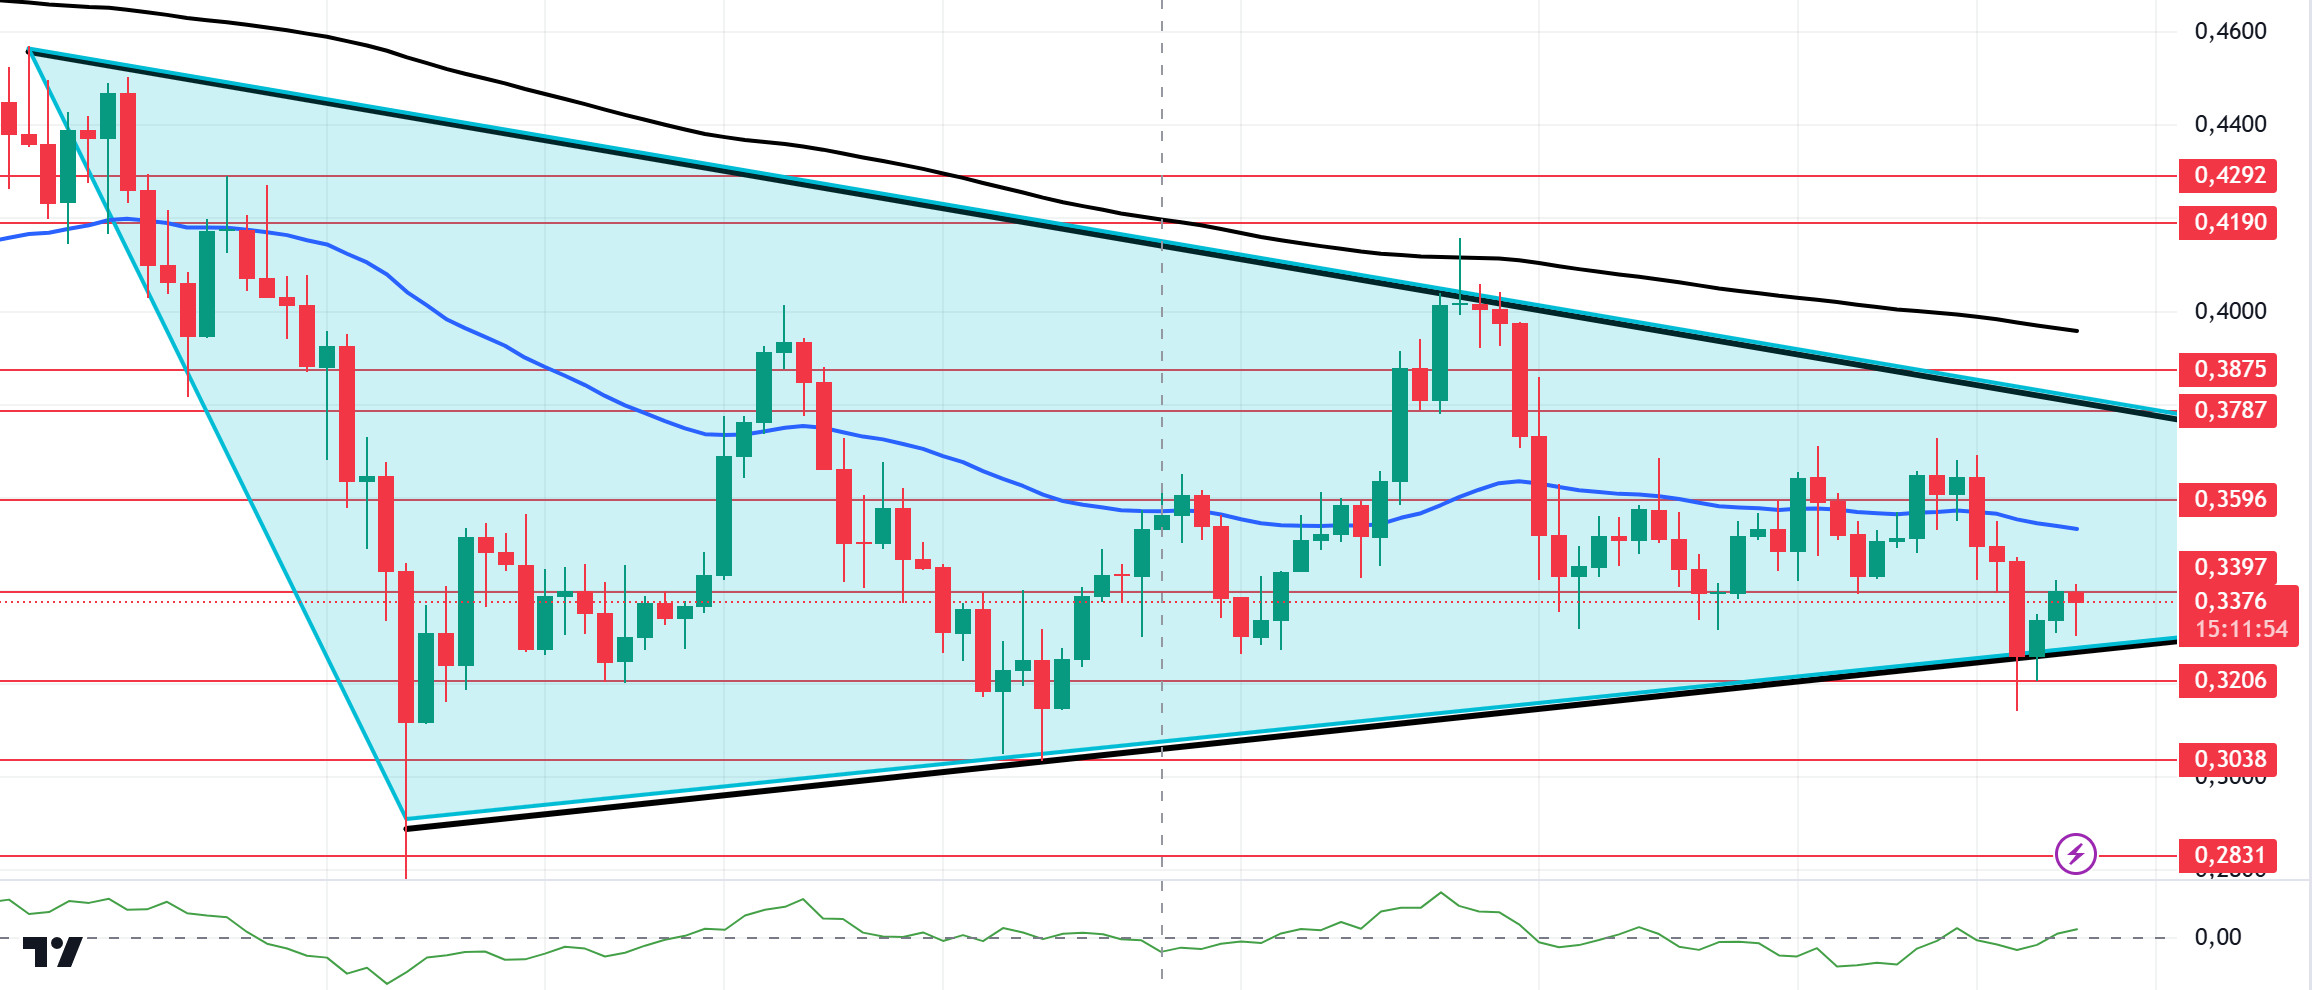
The American elections are just around the corner. According to the data from Polymarket, Trump is ahead with a rate of 66.3%. According to the data from CME, the probability of a 25 basis points rate cut is seen as 94.7%. In addition, US unemployment claims data was announced last week. Although the expectation was 243 thousand, it remained at 227 thousand. The lower-than-expected data had a positive impact on the markets. On the other hand, the US Securities and Exchange Commission (SEC) approved spot Bitcoin options applications from the New York Stock Exchange (NYSE) and the Chicago Board Options Exchange (CBOE) on October 18. The activation of options trading on the 11 approved Bitcoin ETF providers could create a significant influx of liquidity in the industry. Yoroi Wallet, the leading lightweight wallet in Cardano ecosystem developments, partnered with Bring, a white-label crypto cashback platform, to connect the Cardano community with global retail. This collaboration will enable users to earn ADA as cashback when shopping at more than 775 international retailers. This is a development that will increase the transaction volume of ADA. Cardano (ADA) founder Charles Hoskinson has unveiled an ambitious vision for the blockchain platform’s future beyond the Voltaire era, or what has been dubbed Cardano 2.0. Hoskinson’s presentation in Argentina earlier this week highlighted Cardano’s journey from its inception to its current state and outlined a comprehensive roadmap for the years to 2030. ADA has lost about 7.89% since last week. In other data, key indicators of ADA’s bullish momentum, such as Open Interest and Funding Rate, saw significant increases, indicating a potential upside price move. At the time of writing, Open Interest reached $235.72 million. This increase indicates a continuation of the bullish momentum that has historically been associated with upside price trends. Funding Rate was 0.0012%, indicating a buyer dominance. On the other hand, this week saw a 264% increase in net flows. This means that investors are accumulating while ADA is consolidating. From a technical point of view, ADA, which has been accumulating since August 24, may break out of this cycle if the overall market moves positively. Looking at the daily chart, the 50 EMA (Blue Line) remains below the 200 EMA (Black Line). This shows that there is still a downtrend. On the other hand, it started to rise with support from the base level of the symmetrical triangle pattern. When we look at the Chaikin Money Flow (CMF)20 indicator, it indicates that money flows are increasing in support of this rise. If the rise continues, the 50 EMA strength appears as a resistance point. In case of possible macroeconomic conditions and negative developments in the Cardano ecosystem and the continuation of the downtrend, a decline to 0.3038 can be expected.
Supports 0.3206 – 0.3038 – 0.2831
Resistances 0.3397 – 0.3596 – 0.3787
AVAX/USDT
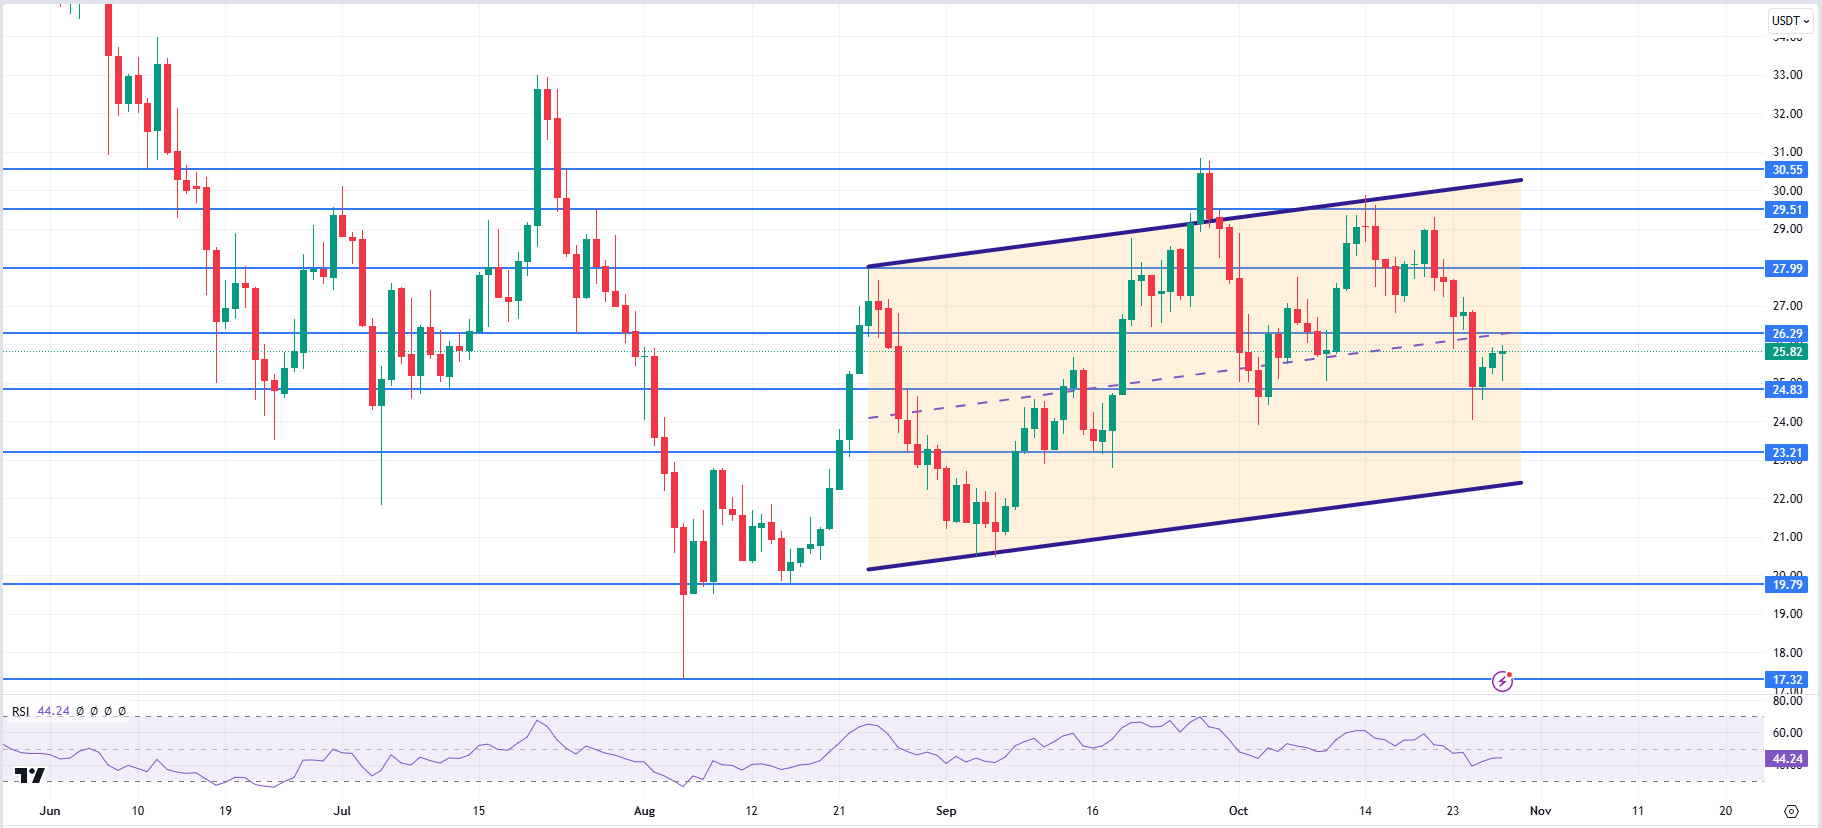
AVAX, which started the previous week at 28.98, fell 11% during the week and closed the week at 25.78. This week on the US side, conference board consumer confidence, job openings and staff turnover, gross domestic product, unemployment benefit applications, non-farm payrolls, unemployment rate, manufacturing purchasing managers index and production purchasing managers index data will be announced. The market will continue to search for direction according to these data and news from the Middle East. This data will also affect the market and AVAX. High volatility may occur in the market during and after the data release.
AVAX, which is currently trading at 25.82 and continues its movement within the bullish channel on the daily chart, may move from the middle band of the channel to the upper band with the positive perception of the upcoming data by the market. In such a case, it may test the 27.99 and 29.51 resistances. Especially with the candle closure above 29.51 resistance, its rise may accelerate. If the data to be announced creates recession anxiety or news of increased tension from the Middle East, selling pressure may occur and move towards the lower band of the channel and test the supports of 24.83 and 23.21. As long as there is no candle closure below 19.79 support on the daily chart, the upward appetite may continue. The decline may deepen with the candle closure below this support.
Supports 27.99 – 26.29 – 24.83
Resistances 29.51 – 30.55 – 31.92
TRX/USDT
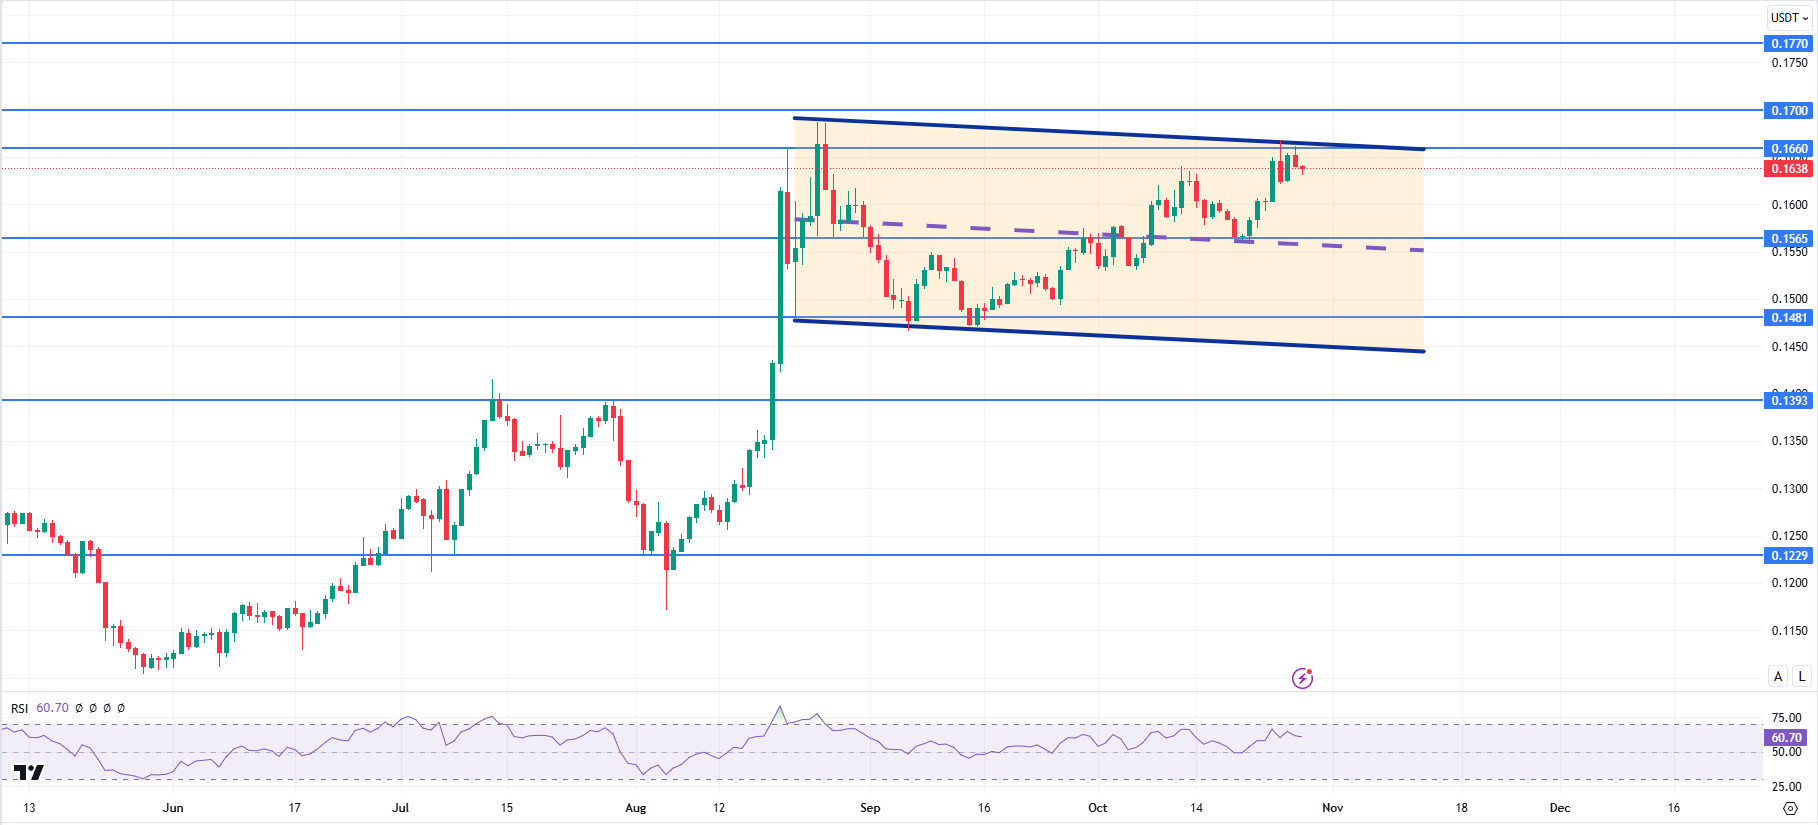
TRX, which started last week at 0.1568, rose about 4.5% during the week and closed the week at 0.1641. This week on the US side, conference board consumer confidence, job openings and staff turnover rate, gross domestic product, unemployment benefit applications, non-farm payrolls, unemployment rate, manufacturing purchasing managers index and production purchasing managers index data will be announced. These data are important to affect the market and data to be announced in line with expectations may have a positive impact.
TRX, which is currently trading at 0.1638 and moving in a bearish trend on the daily chart, is in the upper band of the trend. With a Relative Strength Index of 60, it can be expected to decline slightly from its current level and move to the middle band of the channel. In such a case, it may test the 0.1565 support. If it cannot break the 0.1565 support and rises with the next buying reaction, it may want to test the 0.1660 resistance. On the daily chart, the bullish demand may continue as long as it stays above 0.1229 support. If this support is broken, selling pressure may increase.
Supports 0.1565 – 0.1481 – 0.1393
Resistances 0.1660 – 0.1700 – 0.1770
DOT/USDT
Polkadot (DOT) has introduced “Ordered Accumulation” with the JAM Grey Paper v0.4 update. Dr. Gavin Wood stated that this update will improve efficiency and overcome previous limitations in data management ahead of Polkadot 2.0. The flexible expansion phase of Polkadot 2.0 is scheduled for early 2025. Apillon, as the Polkadot developer platform, aims to facilitate the transition to Web3 with embedded wallets. These innovations may increase the use of Polkadot, enabling the ecosystem to appeal to a wider audience and increase activity on the network.
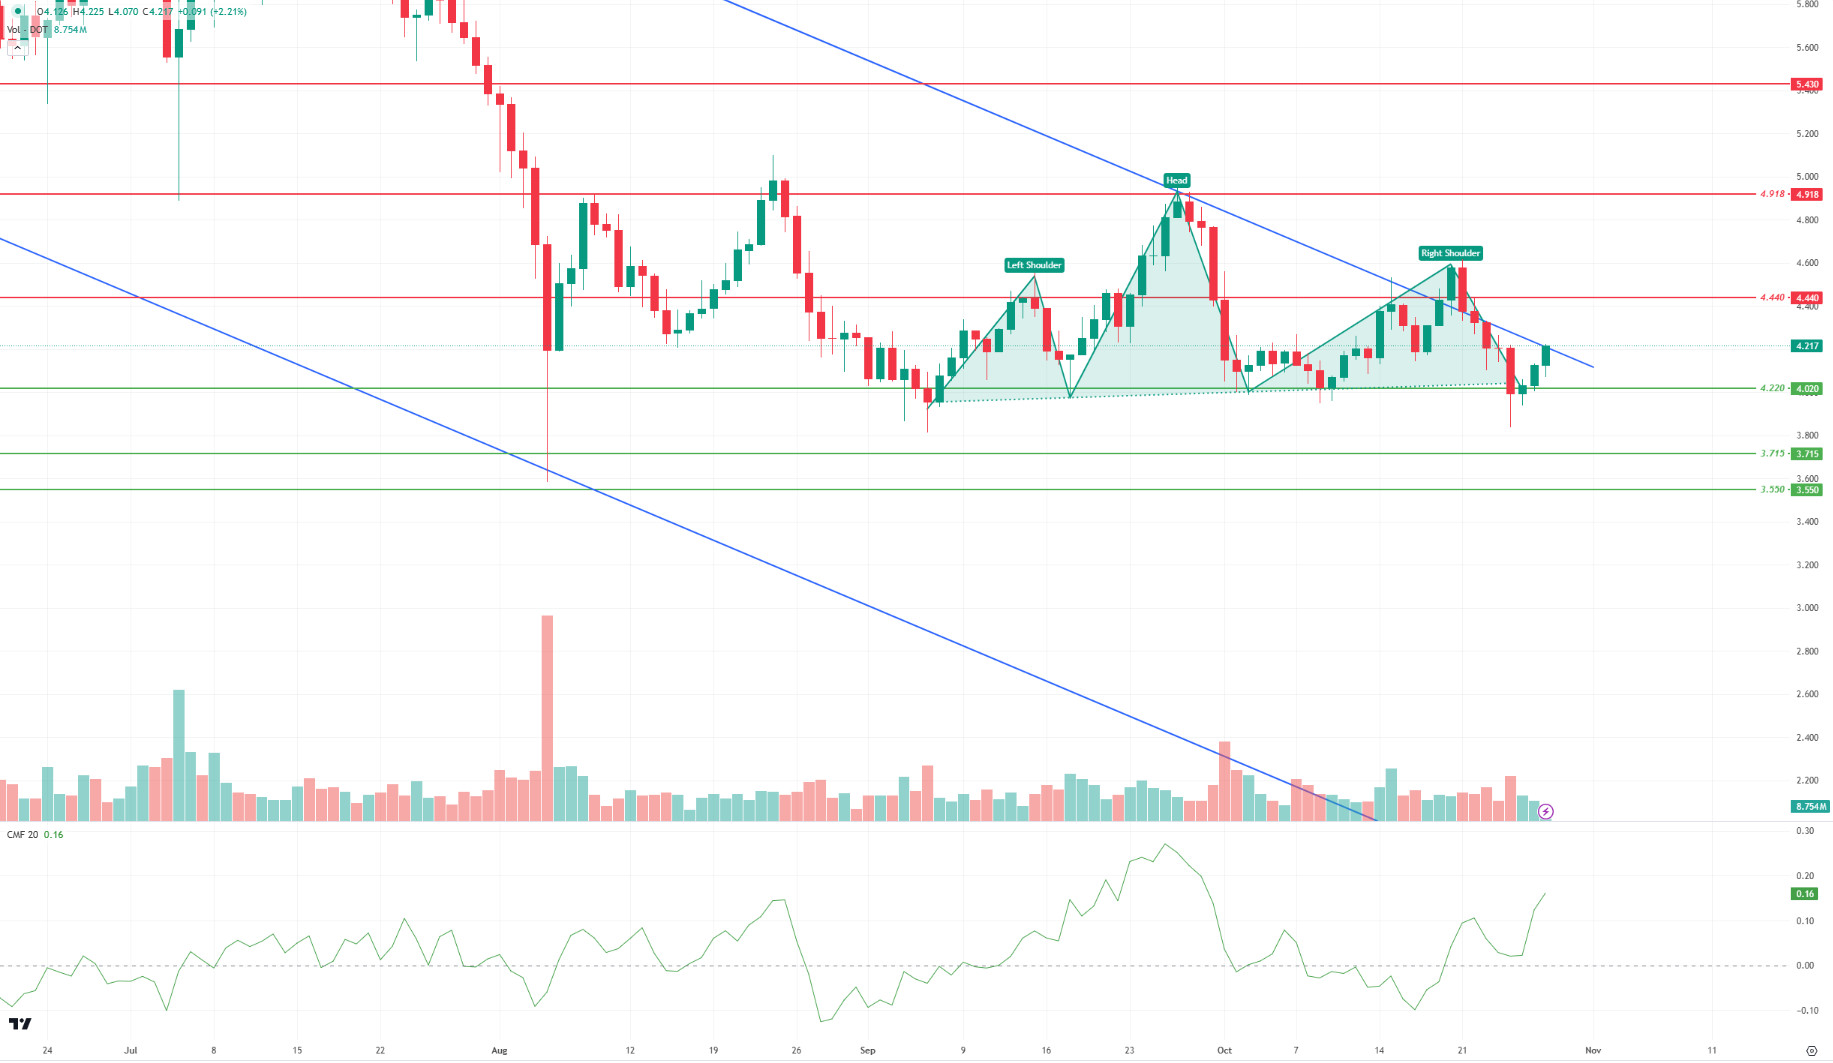
When we examine the DOT chart, we see that the price is in the upper band of the uptrend. When we examine the Chaikin Money Flow oscillator, we see that the buyer pressure is strong. In this context, if the price maintains above the 4.440 level with the trend breakout, we may see a rise towards the next resistance level of 4.918. In the negative scenario, when we examine the chart, we see that there is a Head & Shoulders pattern. If this pattern is realized, the price may move towards the lower band of the rising trend.
Supports 4,220 – 3,715 – 3,550
Resistances 4.918 – 5.889 – 6.684
SHIB/USDT
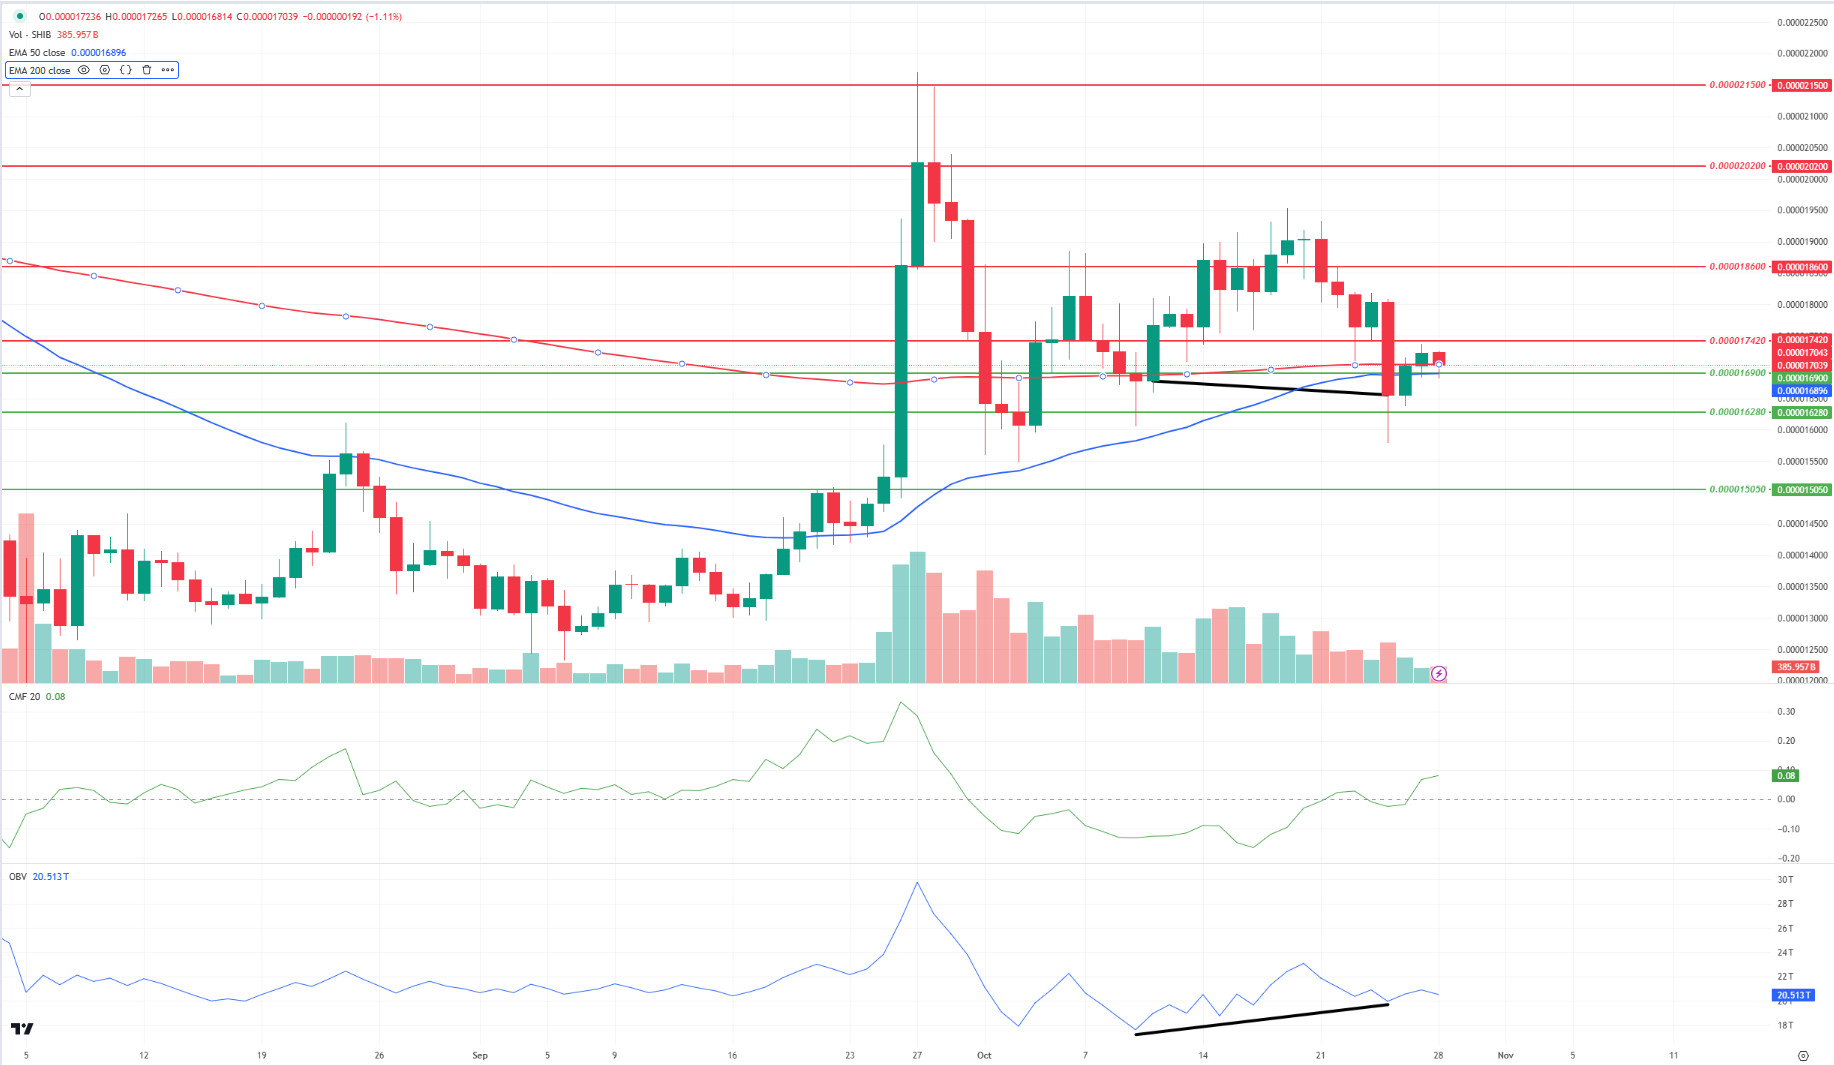
In response to the rise of FUD in the Shiba Inu (SHIB) ecosystem, marketing leader Lucie has taken a step to protect the community by blocking 20 social media accounts spreading panic. Claiming that these accounts were created for the purpose of spreading FUD, Lucie stated that real investors do not fall for such negative information. Also, SHIB’s burn rate increased by 365,668% with 27.49 million SHIBs burned. This increased burn rate could potentially increase the value of SHIB by reducing its supply. However, price action will remain dependent on overall market conditions and investor sentiment.
When we examine the SHIB chart, we see that the price was rejected at 0.00001860. On the chart, EMA50 (Blue Line) is preparing to break EMA200 (Red Line) upwards (Golden Cross). After the positive divergence between the price and On Balance Volume (OBV), the price reacted from the 0.00001628 support level. Buyer pressure looks strong according to the Chaikin Money Flow (CMF) oscillator. In this context, if the price breaks the selling pressure at the 0.00001742 resistance level and maintains above this level, it may rise towards its next target of 0.00001860. On the other hand, if the selling pressure increases, we may see a retracement towards the 0.00001690 level. If the price cannot hold at these levels, it may want to test the 0.00001628 level again.
Supports 0.00001690 – 0.00001628 – 0.00001505
Resistances 0.00001742 – 0.00001860 – 0.00002020
 LEGAL NOTICE
The investment information, comments and recommendations contained in this document do not constitute investment advisory services. Investment advisory services are provided by authorized institutions on a personal basis, taking into account the risk and return preferences of individuals. The comments and recommendations contained in this document are of a general type. These recommendations may not be suitable for your financial situation and risk and return preferences. Therefore, making an investment decision based solely on the information contained in this document may not result in results that are in line with your expectations.


