MARKET SUMMARY
Latest Situation in Crypto Assets
| Assets | Last Price | 24h Change | Dominance | Market Cap. |
|---|---|---|---|---|
| BTC | 71,217.00 | 4.98% | 58.64% | 1,41 T |
| ETH | 2,620.00 | 5.39% | 13.12% | 315,44 B |
| SOLANA | 180.06 | 3.46% | 3.52% | 84,67 B |
| XRP | 0.5236 | 1.82% | 1.24% | 29,74 B |
| DOGE | 0.1644 | 15.02% | 1.00% | 24,11 B |
| TRX | 0.1641 | 0.57% | 0.59% | 14,19 B |
| CARDANO | 0.3455 | 4.09% | 0.50% | 12,09 B |
| AVAX | 26.60 | 5.08% | 0.45% | 10,83 B |
| SHIB | 0.00001824 | 7.90% | 0.45% | 10,76 B |
| LINK | 11.47 | 5.89% | 0.30% | 7,19 B |
| DOT | 4.148 | 0.83% | 0.26% | 6,27 B |
*Prepared on 10.29.2024 at 06:00 (UTC)
WHAT’S LEFT BEHIND
Bitcoin Breaks $71K for the First Time in Four Months
Bitcoin hit new highs, reaching $71,500, and experienced a significant jump thanks to increased institutional interest and ETF flows. Bitcoin, which was traded only 3.55% below the record level of $ 73,750 it saw in early March, is said to have jumped in price with $4 billion in inflows to ETFs and call options coming to the fore.
Record Flows in Bitcoin ETFs
The recent excitement around Bitcoin ETFs is an important indicator of shifts in market dynamics. BlackRock’s flagship Bitcoin ETF, IBIT, attracted an impressive $315 million in new capital in just one day, setting the stage for growth as more institutional investors turn to Bitcoin.
BlackRock’s Bitcoin Portfolio
BlackRock, the world’s largest asset manager, held 403,725 BTC in the iShares Bitcoin Trust exchange-traded fund (ETF), amounting to approximately $26.98 billion in assets. According to data released by the company, BlackRock’s Bitcoin portfolio is growing rapidly.
HIGHLIGHTS OF THE DAY
Important Economic Calender Data
| Time | News | Expectation | Previous |
|---|---|---|---|
| ZIGChain Fusion Dubai – General Event (CRYPTO) | |||
| Stacks (STX) – Stacks Nakamoto Release | |||
| Aergo (AERGO) – V4 Hard Fork on Mainnet | |||
| 14:00 | US CB Consumer Confidence (Oct) | 99.5 | 98.7 |
| 14:00 | US JOLTS Job Openings (Sep) | 7.98M | 8.04M |
INFORMATION
*The calendar is based on UTC (Coordinated Universal Time) time zone.
The economic calendar content on the relevant page is obtained from reliable news and data providers. The news in the economic calendar content, the date and time of the announcement of the news, possible changes in the previous, expectations and announced figures are made by the data provider institutions. Darkex cannot be held responsible for possible changes that may arise from similar situations.
MARKET COMPASS
Global markets started the week with a high risk appetite, which was reflected in asset prices. The geopolitical risks, which decreased with the rumors that the Israeli attack on Iran over the weekend could pave the way for the start of the diplomatic process, created a ground for investors to focus on other dynamics. Balance sheets of major companies in the US and Europe and the expected expansionary steps by central banks encouraged traders to take more risks.
In addition to the aforementioned variables, digital assets have extended their gains in recent days on expectations that China may take new steps to support its economy and that Trump is leading the presidential race. In addition, inflows in ETFs signaled continued institutional investor interest and supported the BTC-led rise. Another bullish catalyst came from the traditional markets, as the dollar index, which has recently turned upwards and attracted attention, limited the rise in the US bond yields.
These variables, which we often mention in our analysis and form the basis of our bullish expectation for the long term, constitute a large part of the equation. On the other hand, in the case of BTC, we have seen it rise above around $71,500 as of yesterday, with purchases coming from levels below $66,000, which it saw on October 25, and recorded a 9% premium in this short period of time. Underlining that we have concerns about the health of this movement, we can state that we expect an interim correction. Therefore, for short-term traders, a short position may be reasonable for short-term traders with short loss cut levels. However, at this point, it is worth remembering that the main direction is bullish and how valuable it is to cut losses when necessary.
TECHNICAL ANALYSIS
BTC/USDT
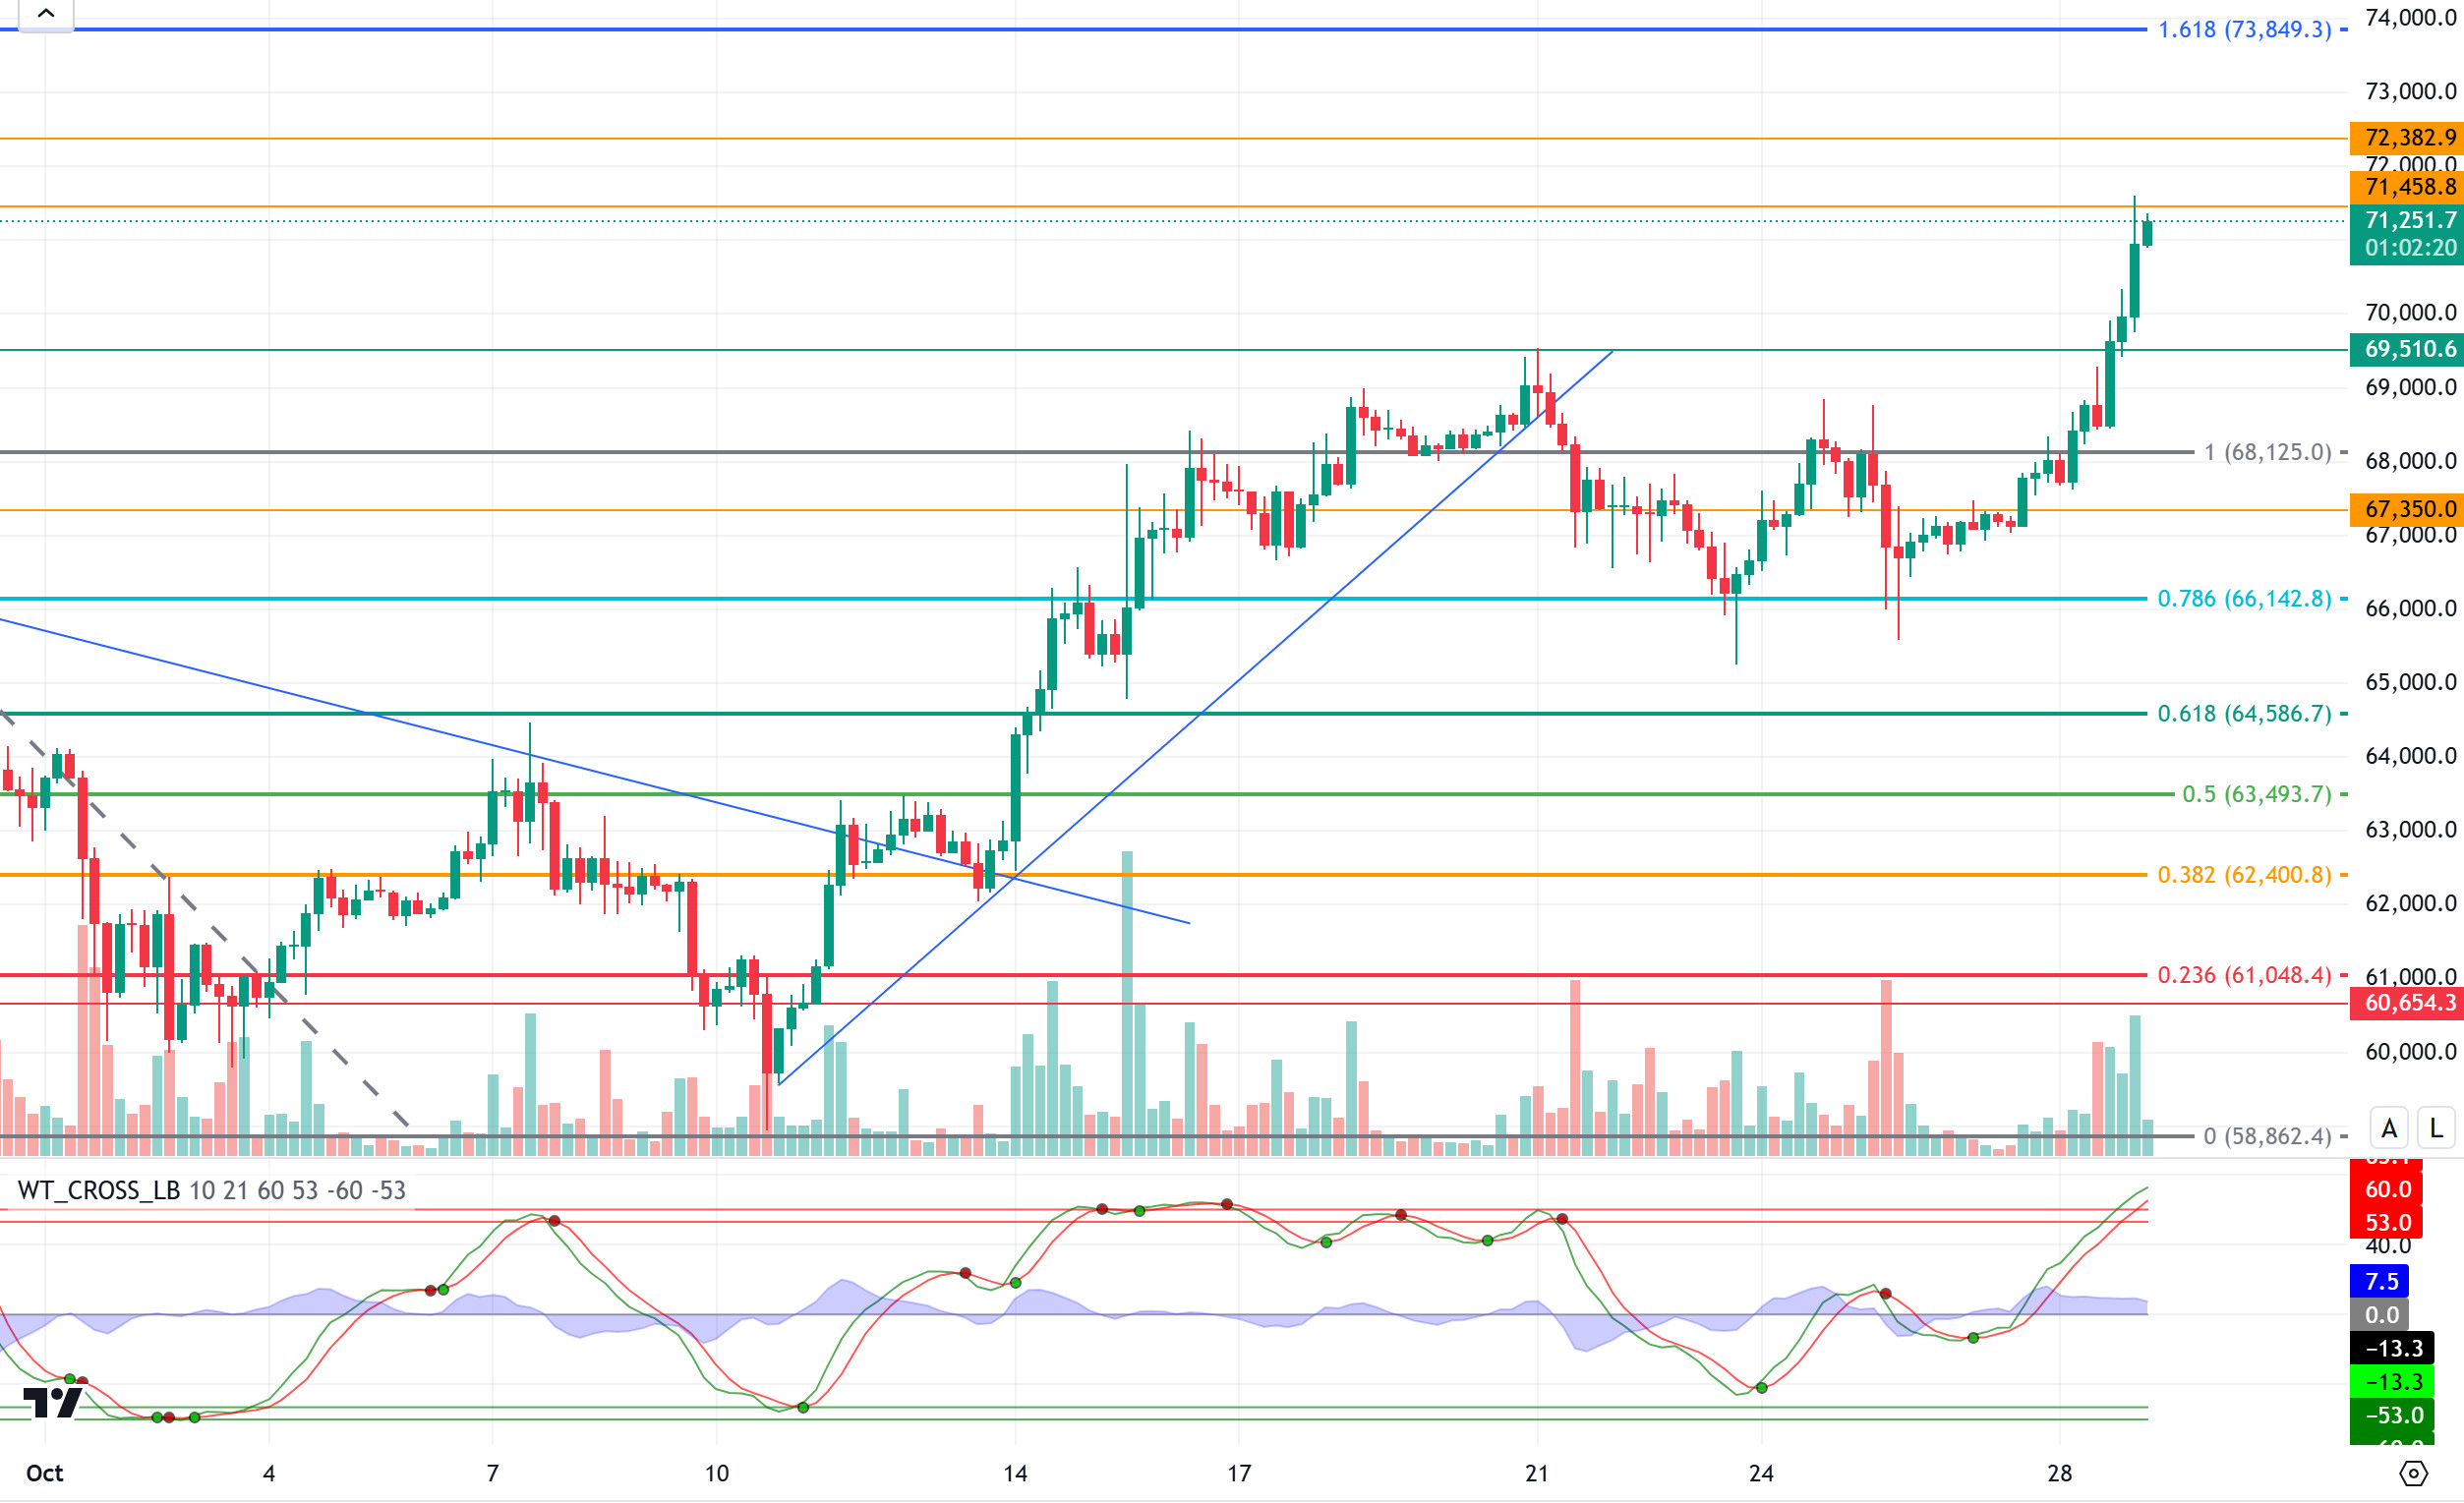
Bitcoin has surpassed 71,000 levels after a 4-month hiatus and is nearing the ATH level amid institutional investor interest in spot ETFs. According to data from Farside Investors, Bitcoin ETFs recorded a flow of $479 million on Monday alone. With a total flow of more than $ 4 billion in the last 12 trading days, it caused a strong recovery in the Bitcoin price. On the other hand, as the US elections are approaching, it is seen that call positions pointing to the 80,000 level in the options market are increasing with the expectation that presidential candidate D. Trump will win the election. With all these developments, we can say that volatility will increase with high volatility in the market in the coming days.
If we look at the technical outlook in the light of the developments, the hourly closes above the previous peak level of 69,510 in BTC carried the price to the resistance level of 71,458. Testing 71,458, the last major resistance level before the ATH level of 73,750, BTC can be expected to gain momentum with the crossing of this level. With the wave trend oscillator, our technical indicator, coming to the oversold zone, giving a sell signal on the 1-hour chart may bring a correction movement. In case of a pullback, we will watch the 69,510 level, which has been tested several times as resistance, as a support level.
Supports 69,510 – 68,125- 67,350
Resistances 71,458 – 72,382 – 73,750
ETH/USDT
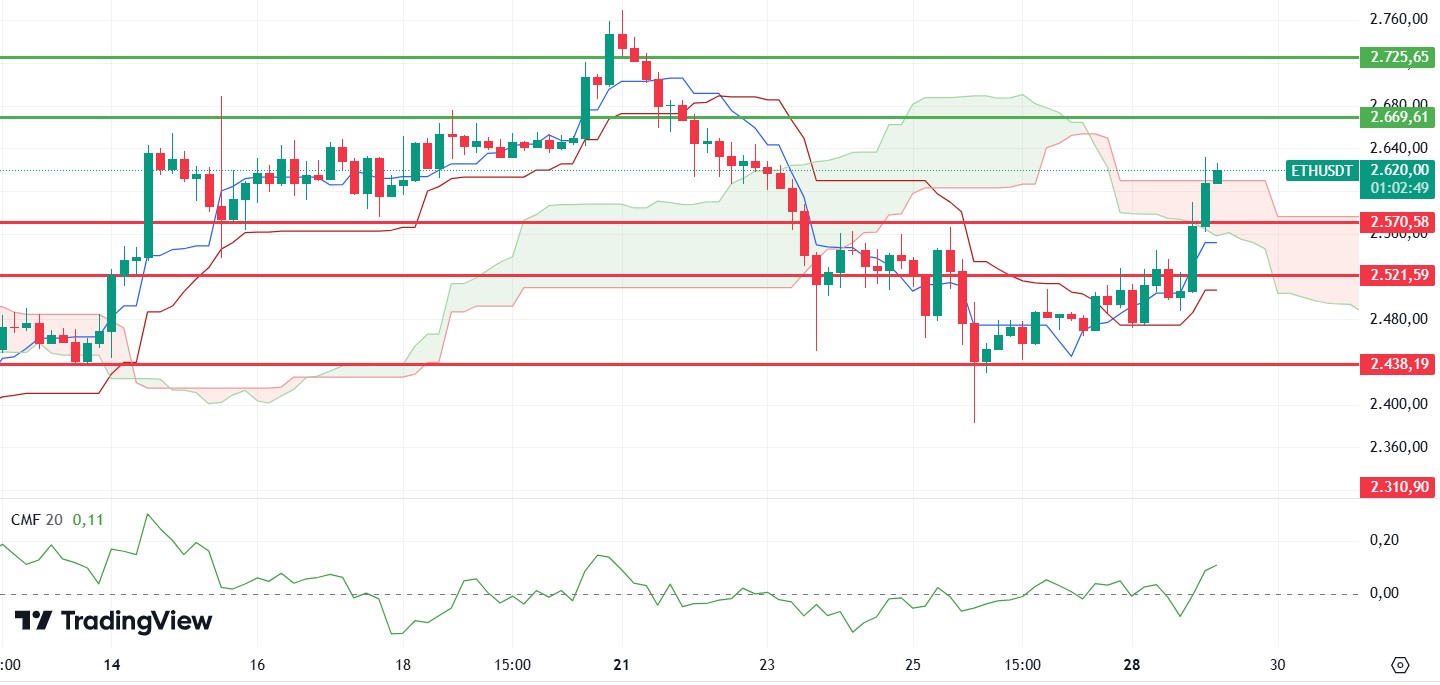
ETH, which gained bullish momentum yesterday as Bitcoin surged above $70,000, managed to break above the $2,600 level. Chaikin Money Flow (CMF) seems to support the bullish structure by reaching a positive value. Looking at the Ichimoku indicator, pricing above the tenkan, kijun and kumo cloud also shows that the positive structure is strong. In this context, rises up to 2.669 levels seem possible. However, the most important point to pay attention to is Cumulative Volume Delta (CVD). Looking at the CVDs, the fact that the upward movement comes mainly from futures and the funding rates are very positive shows that investors should pay attention to the 2.571 support level. Closures below this level may cause the price to fall sharply.
Supports 2,571 – 2,521 – 2,438
Resistances 2,669 – 2,725 – 2,792
LINK/USDT
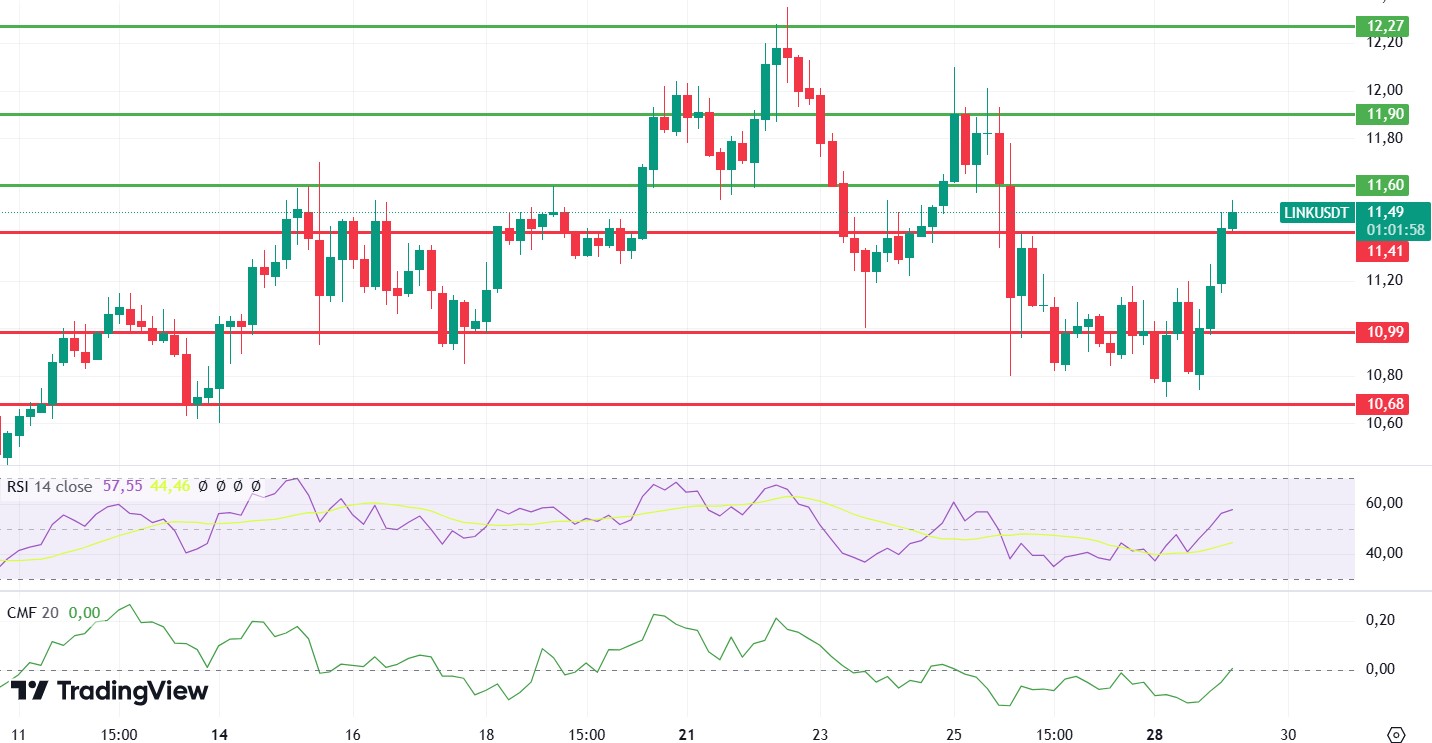
Although LINK broke through the important resistance level of 11.41, the excessive increase in the Relative Strength Index (RSI) and the 0 resistance in Chaikin Money Flow (CMF) indicate that a reaction may come at 11.60. Failure to exceed 11.60 may cause a decline back to 11.41 and a break here may cause the decline to deepen. However, if the 11.60 kumo cloud resistance is broken, the uptrend may continue and bring increases up to 11.90 levels.
Supports 11.41 – 10.99 – 10.68
Resistances 11.60 – 11.90 – 12.27
SOL/USDT
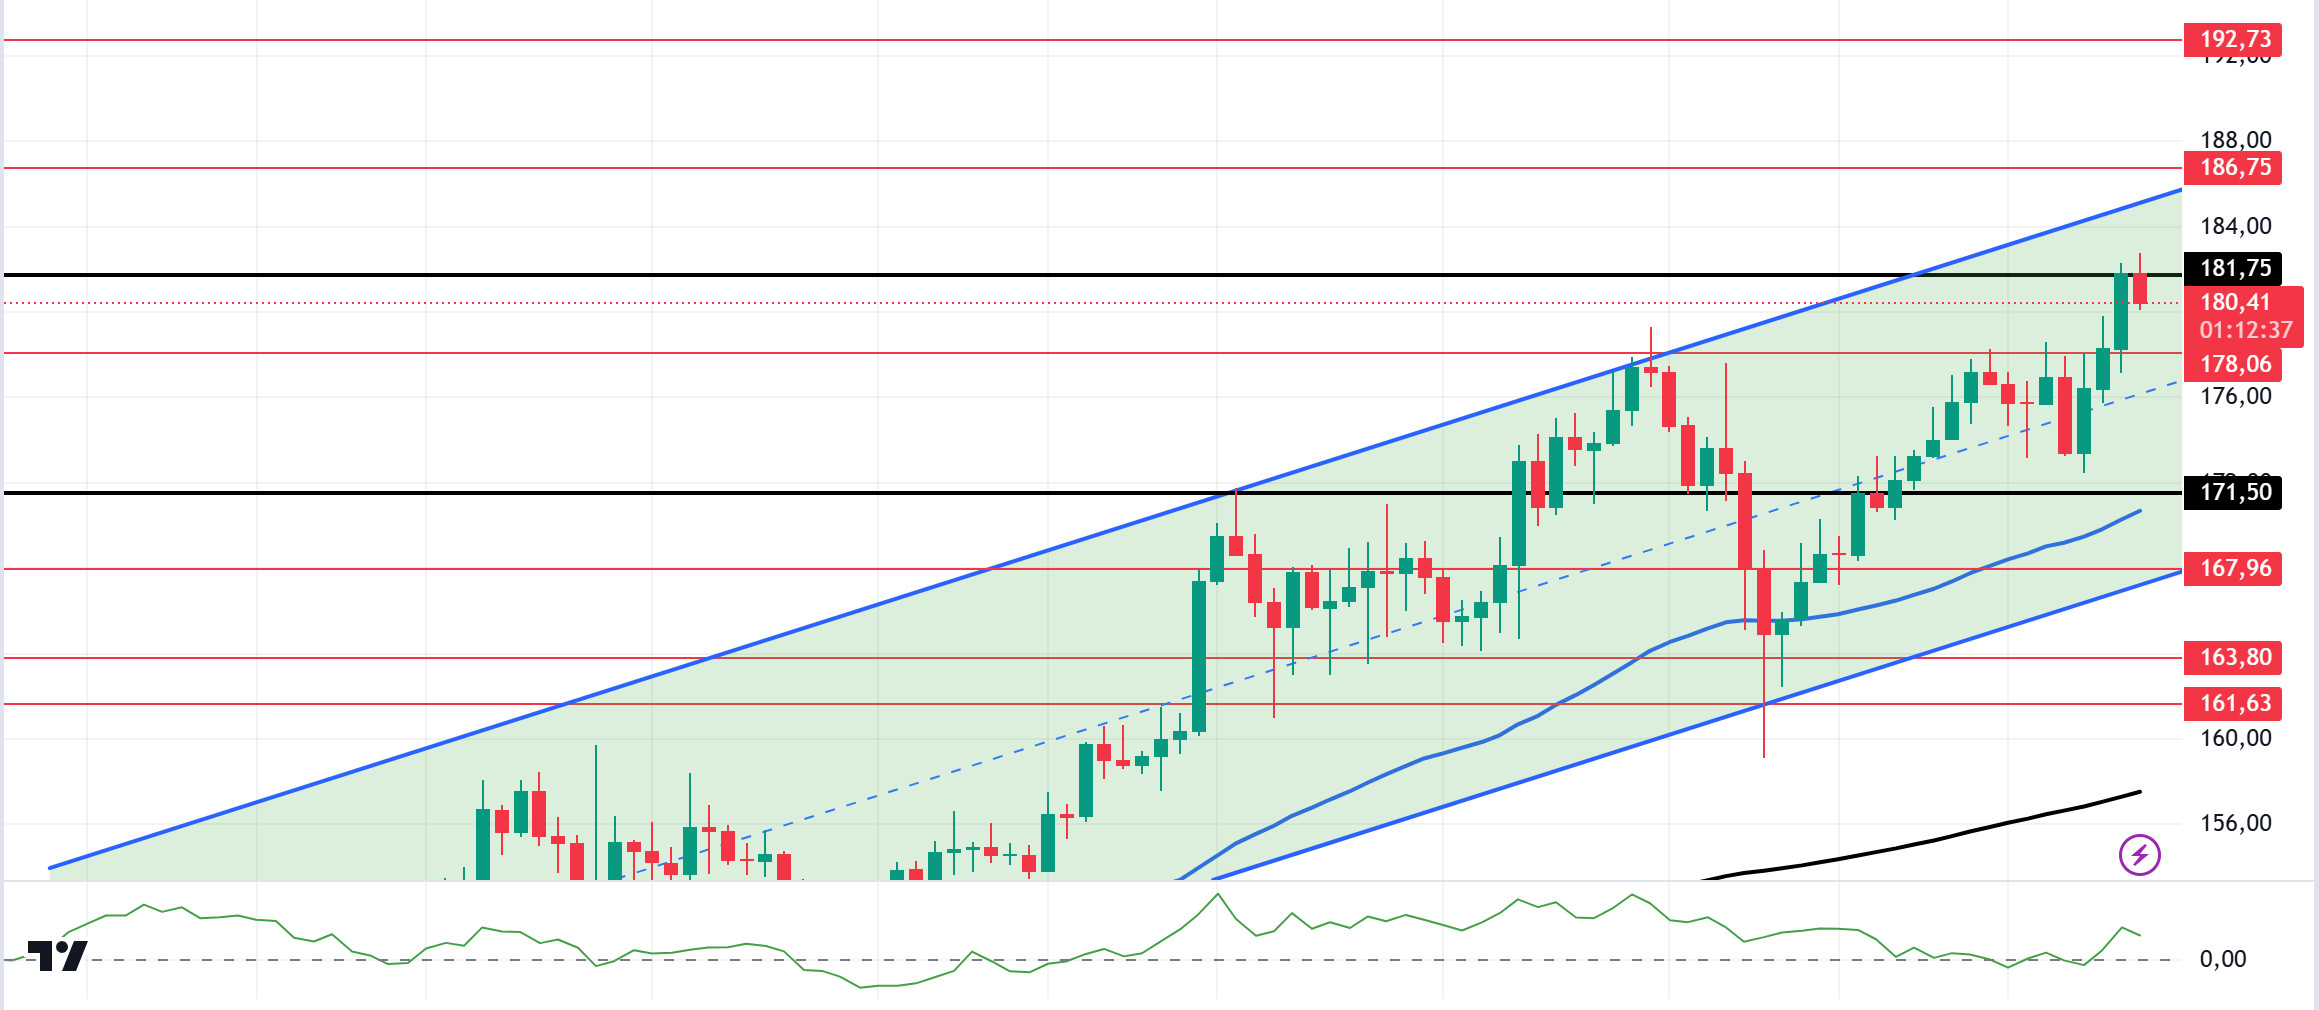
Bitcoin rose above $70,000 for the first time since June, supported by ETF inflows and speculation over the US election results. In the Solana ecosystem, whales bought SOL on centralized exchanges. On October 28, Lookonchain reported on its X platform that whales accumulated 202,400 SOL worth $35 million in the past week. On the 4-hour timeframe, SOL tested strong resistance at $181.75. The 50 EMA (Blue Line) continues to be above the 200 EMA (Black Line). This could mean that the uptrend will continue. However, Chaikin Money Flow (CMF)20 has increased and gained a positive value since our analysis in the morning. This signals that money inflows are increasing. On October 10, the price rebounded within the resistance, supported by the mid-level of the uptrend that started on October 10. However, the intense swap level is at 155.11. This is where buyers and sellers exchange the most. The 181.75 level is a very strong resistance level in the uptrend driven by both macroeconomic conditions and innovations in the Solana ecosystem. If it rises above this level, the rise may continue strongly. In case of possible political reasons or profit sales, the 171.50 support level may be triggered again. If the price comes to these support levels, a potential bullish opportunity may arise.
Supports 178.06 – 171.50 – 167.96
Resistances 181.75 – 186.75 – 192.73
ADA/USDT
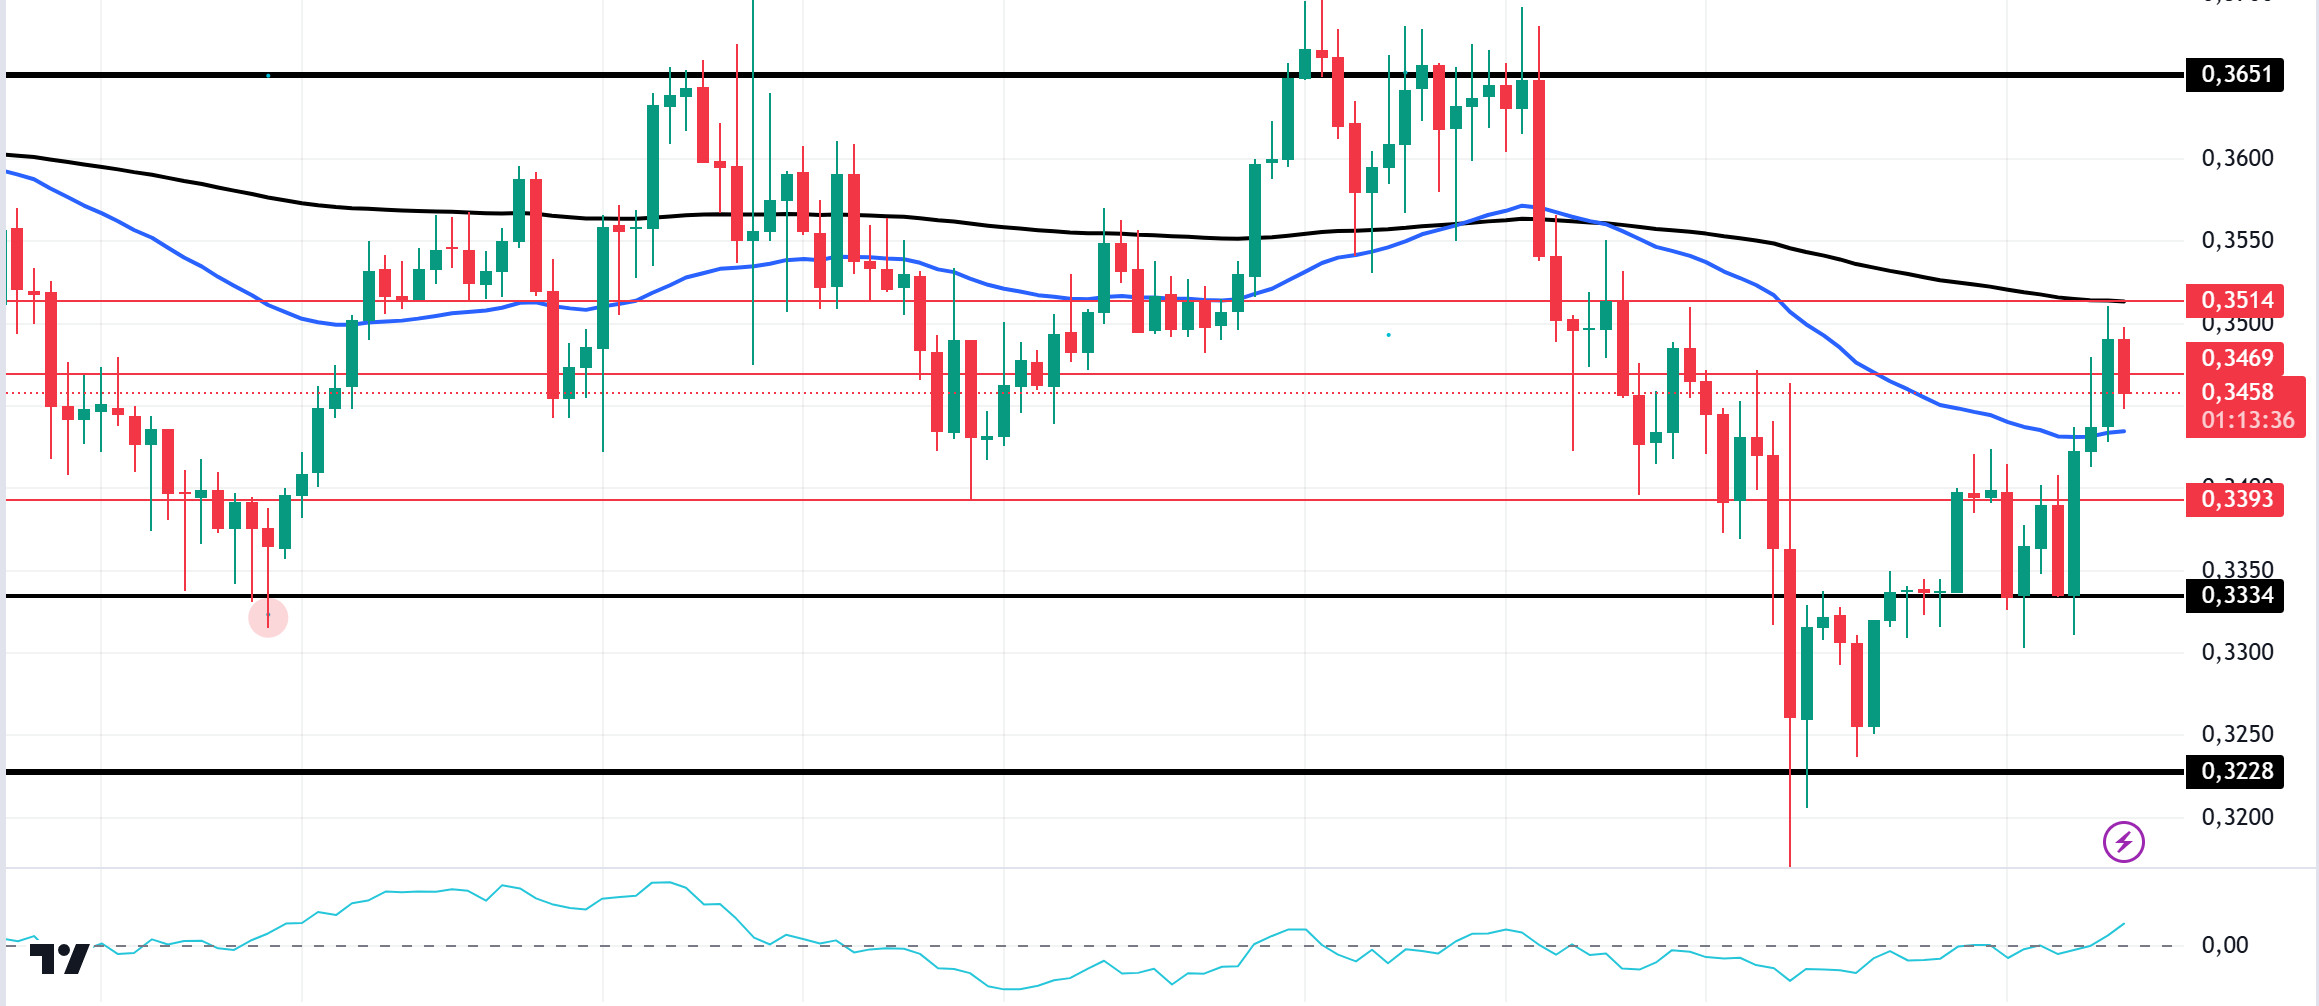
Bitcoin rose above $70,000 for the first time since June, supported by ETF inflows and speculation about the US election results. Cardano founder Charles Hoskinson announced ambitious plans for the blockchain platform. Hoskinson said he envisions a future where Cardano plays an important role not only as a cryptocurrency, but also in the governance of nation states. In the Cardano ecosystem, the number of addresses holding between 1 million and 10 million ADA has remained stable in recent days. From October 20 to October 28, the number increased from 2,444 to 2,452. This suggests that whales have not been taking action on their wallets lately. However, TVL has been rising steadily with this recent surge. Technically, on the 4-hour chart, the price is sandwiched between the 50 EMA (Blue Line) and the 200 EMA (Black Line). At the same time, the 50 EMA is below the 200 EMA. This shows us that the trend is bearish. Cardano price is currently stuck in a three-month range after testing resistance twice and support three times. The Chaikin Money Flow (CMF)20 indicator has increased and turned positive. Therefore, we can see that money inflows are increasing. As a matter of fact, the price has seen support from the 50 EMA and resistance from the 200 EMA. If it breaks through this resistance, it may test the 0.3651 level once again. If the decline continues, it may test the support level of 0.3228 once again. It may be appropriate to buy when it reaches this price level.
Supports 0.3393 – 0.3334 – 0.3228
Resistances 0.3469 – 0.3514 – 0.3651
AVAX/USDT
AVAX, which opened yesterday at 25.77, rose by about 2% during the day and closed the day at 26.25. Today, Conference Board consumer confidence and job openings and staff turnover data will be released by the US. Especially the job openings and staff turnover rate data is important for the market which is worried about recession. A much lower than expected data may be negatively priced by the market. In addition, news flows from the Middle East will be important for the market.
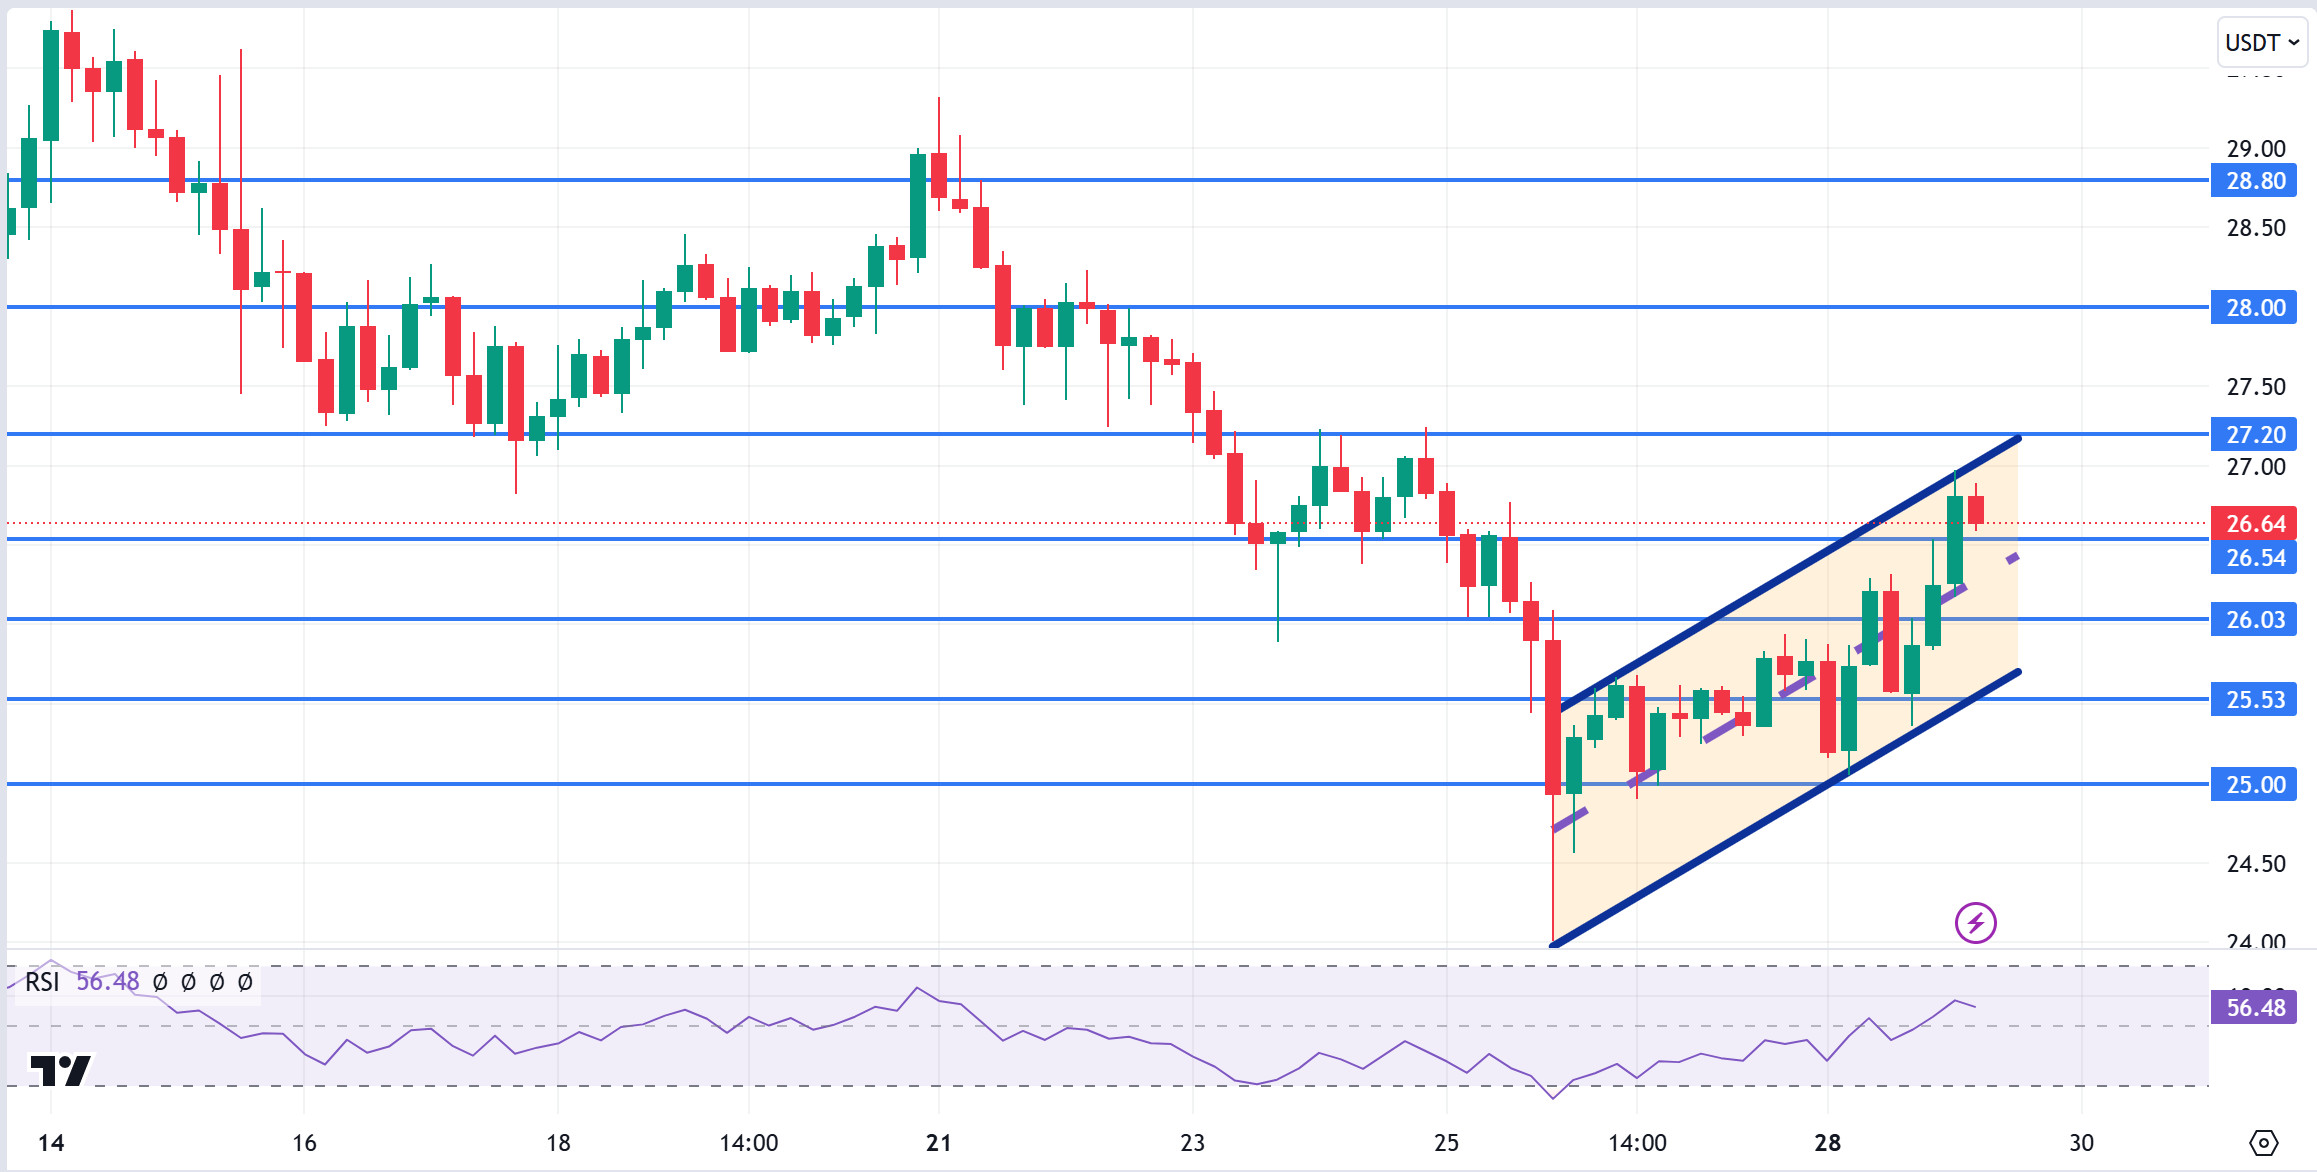
AVAX, currently trading at 26.64, is moving within the bullish channel on the 4-hour chart. It is in the upper band of the bullish channel and with a Relative Strength Index value of 56, some decline can be expected from these levels. In such a case, it may test 26.03 support. On the other hand, if today’s data is perceived positively or news that the tension in the Middle East is over, purchases may increase. In such a case, it may test the 27.20 resistance. As long as it stays above 25.00 support during the day, the desire to rise may continue. With the break of 25.00 support, sales may increase.
Supports 26.54 – 26.03 – 25.53
Resistances 27.20 – 28.00 – 28.80
TRX/USDT
TRX, which started yesterday at 0.1641, moved horizontally during the day and closed the day at 0.1642. Today, conference board consumer confidence and job openings and staff turnover rate data are important data that the market will follow. Volatility in the market may increase during the data release. The market will also be closely following the news flows regarding the tension in the Middle East.
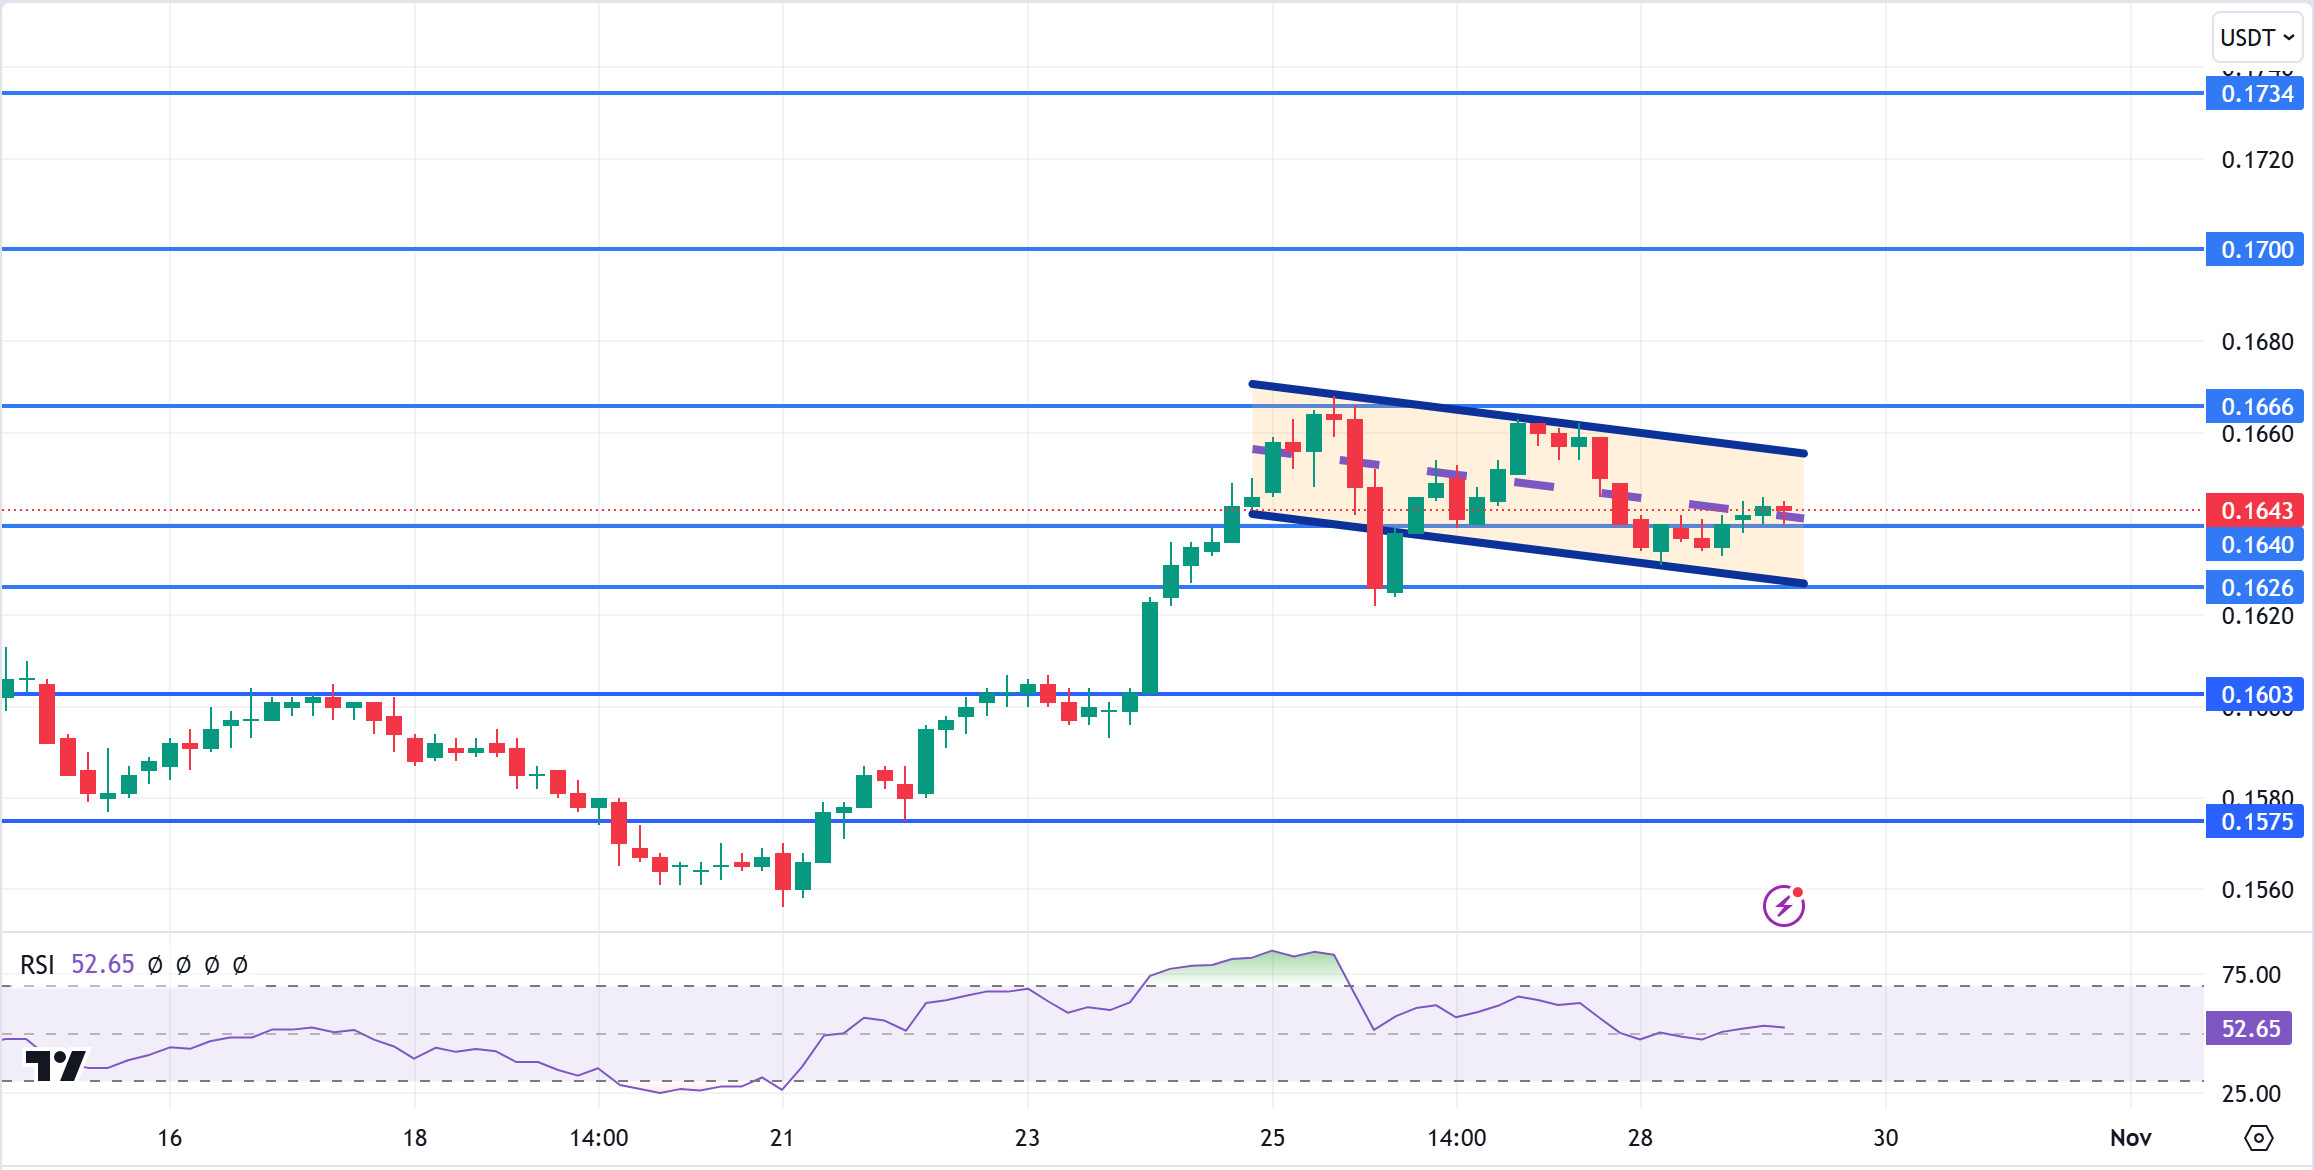
TRX, currently trading at 0.1643, is in the middle band of the bearish channel on the 4-hour chart. Relative Strength Index value is 52 and it can be expected to decline slightly from its current level. In such a case, it may move to the lower band of the channel and test the 0.1626 support. However, it cannot close the candle below 0.1640 support and may test 0.1666 resistance with the buying reaction that will occur if news flow comes that the tension in the Middle East is over. As long as TRX stays above 0.1482 support, the desire to rise may continue. If this support is broken downwards, sales can be expected to increase.
Supports 0.1640 – 0.1626 – 0.1603
Resistances 0.1666 – 0.1700 – 0.1734
DOT/USDT
Gecko Sec team, one of the winners of EasyA x Polkadot hackathon, has achieved an important success for the Polkadot ecosystem by being accepted to Y Combinator. The security software developed by Gecko Sec aims to make it easier for Web3 developers to write secure code, and this tool can especially contribute to projects working on Polkadot. This development can support the growth of the ecosystem by contributing to Polkadot’s security and developer interest.
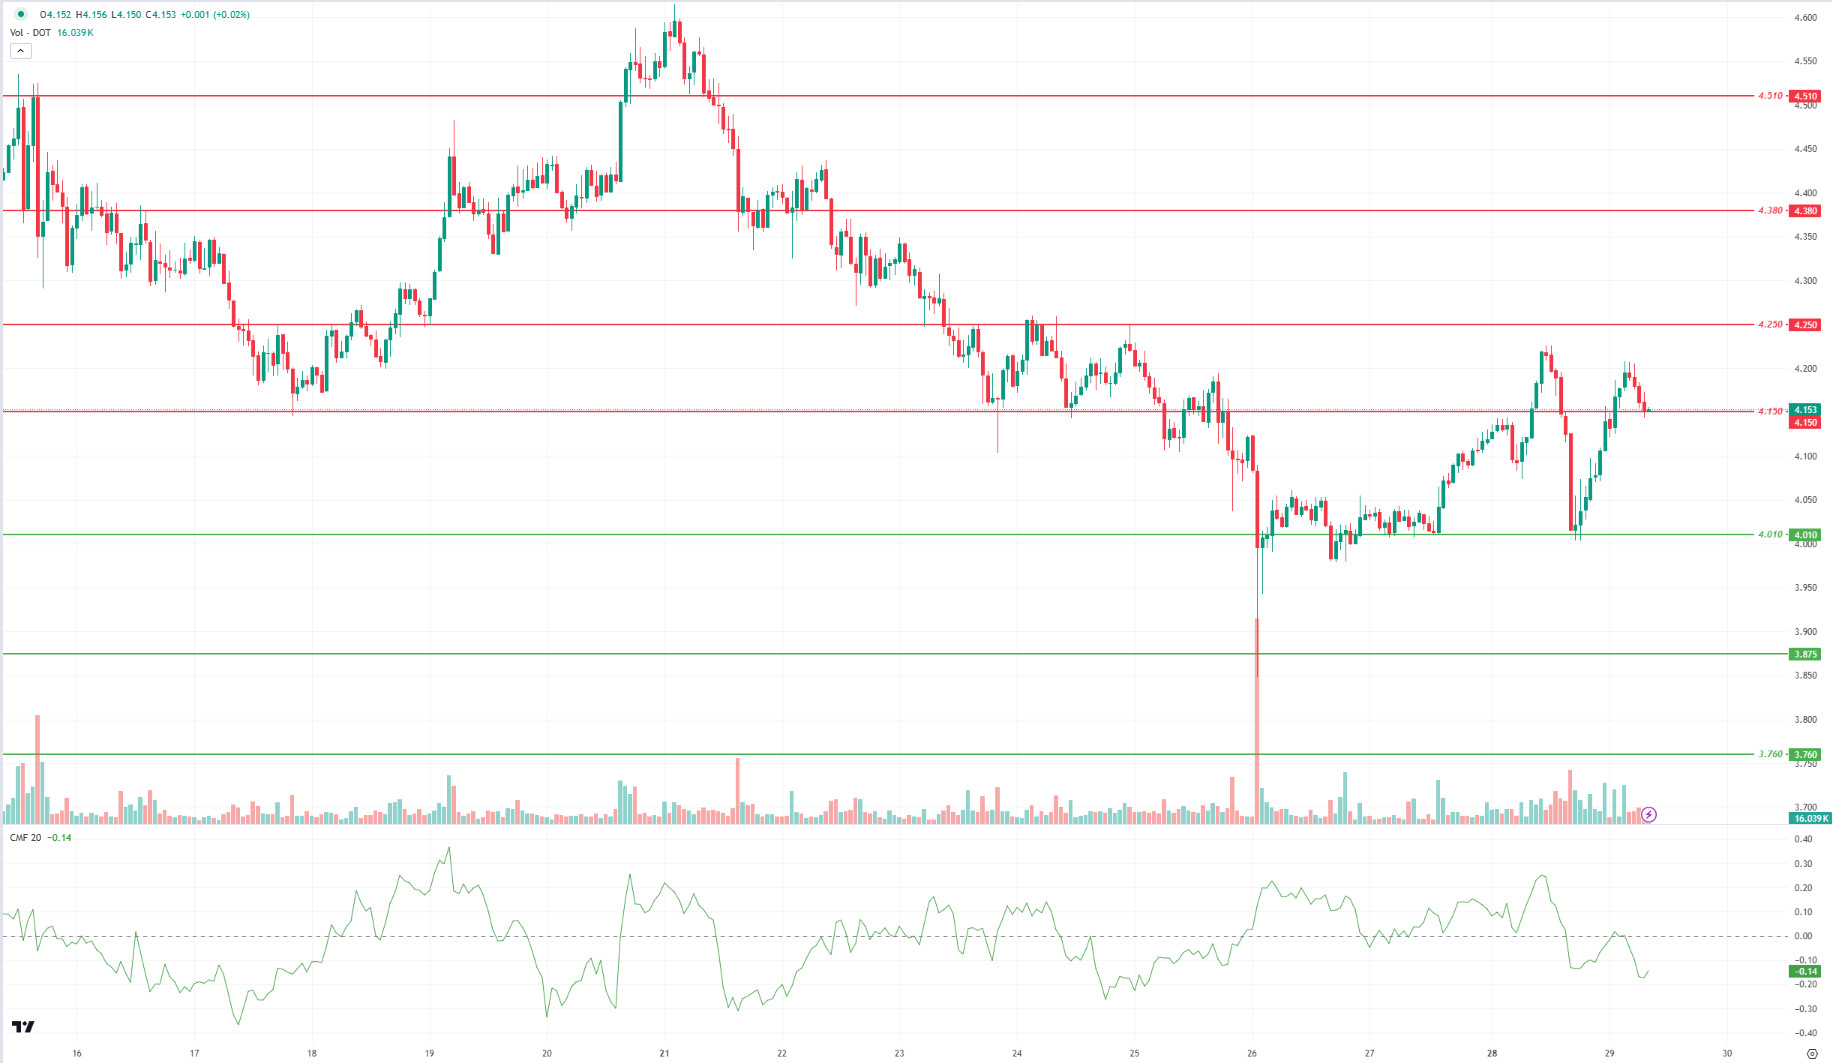
When we examine the DOT chart, the price reacted from the 4.010 support level and broke the 4.150 level upwards. According to the Chaikin Money Flow (CMF) oscillator, we can say that selling pressure continues. Accordingly, if the price cannot maintain above the 4.150 level, it may retest the 4.010 support level. On the other hand, if the price maintains above the 4.150 level, we may see a rise towards 4.250 levels.
Supports 4.010 – 3.875 – 3.760
Resistances 4.150 – 4.250 – 4.380
SHIB/USDT
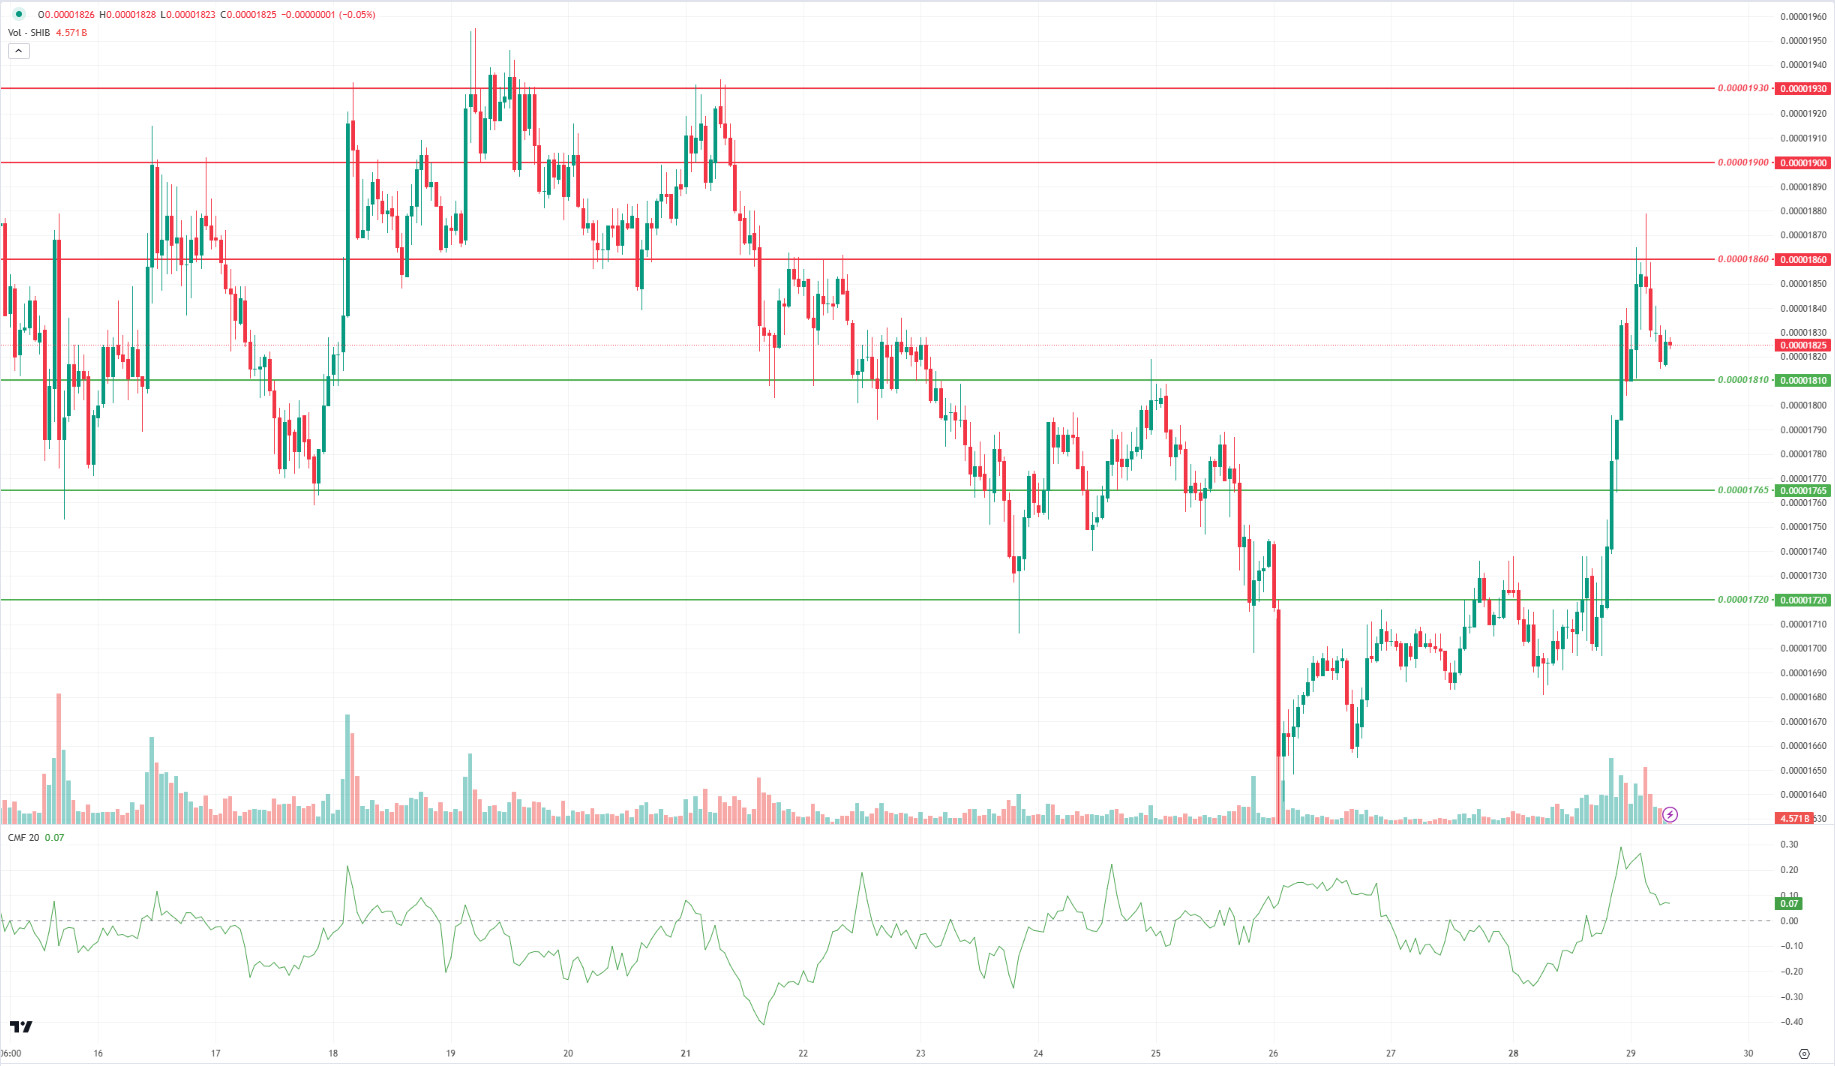
Shiba Inu’s (SHIB) burn rate increased by 124% in the last week. This strong burn rate supports market interest and positive expectations for the token’s deflationary nature. Looking at the SHIB chart, the price broke the 0.00001810 resistance level upwards. When we analyze the Chaikin Money Flow (CMF) oscillator, we can say that the buyer pressure continues to be strong. In this context, the price may test the 0.00001860 level. On the other hand, if the price fails to sustain above the 0.00001810 level, it may make a correction towards 0.00001765 levels.
Supports 0.00001810 – 0.00001765 – 0.00001720
Resistances 0.00001860 – 0.00001900 – 0.00001930
LEGAL NOTICE
The investment information, comments and recommendations contained herein do not constitute investment advice. Investment advisory services are provided individually by authorized institutions taking into account the risk and return preferences of individuals. The comments and recommendations contained herein are of a general nature. These recommendations may not be suitable for your financial situation and risk and return preferences. Therefore, making an investment decision based solely on the information contained herein may not produce results in line with your expectations.


