MARKET SUMMARY
Latest Situation in Crypto Assets
| Assets | Last Price | 24h Change | Dominance | Market Cap. |
|---|---|---|---|---|
| BTC | 71,685.00 | 3.97% | 58.75% | 1.42 T |
| ETH | 2,633.00 | 5.04% | 13.14% | 317.44 B |
| SOLANA | 179.74 | 2.82% | 3.51% | 84.53 B |
| XRP | 0.5260 | 1.64% | 1.23% | 29.84 B |
| DOGE | 0.1682 | 14.61% | 1.02% | 24.59 B |
| TRX | 0.1643 | 0.48% | 0.59% | 14.21 B |
| CARDANO | 0.3483 | 3.03% | 0.50% | 12.18 B |
| AVAX | 26.68 | 2.83% | 0.45% | 10.85 B |
| SHIB | 0.00001864 | 8.48% | 0.45% | 10.94 B |
| LINK | 11.50 | 4.65% | 0.30% | 7.21 B |
| DOT | 4.171 | 0.87% | 0.26% | 6.30 B |
*Prepared on 10.29.2024 at 13:30 (UTC)
WHAT’S LEFT BEHIND
China Fiscal Package Details
According to Reuters, China is considering approving an additional fiscal package of over 1.4 trillion dollars next week to stimulate the economy. This package is expected to be further expanded if Trump wins the election.
Peter Brandt: Halving rise in Bitcoin
Stating that the series of “falling tops, falling bottoms” that has been going on since March has ended, Peter Brandt said, “The halving rise in Bitcoin may have started.”
The Relationship Between MicroStrategy Shares and Bitcoin
Analysts point to the correlation between MicroStrategy shares and Bitcoin. According to Timothy Peterson, MicroStrategy’s value can vary at different Bitcoin price levels: MicroStrategy shares could reach $235 when Bitcoin reaches $70,000; $300 at $80,000; and $440 at $100,000.
HIGHLIGHTS OF THE DAY
Important Economic Calender Data
*There is no important calendar data for the rest of the day.
INFORMATION
*The calendar is based on UTC (Coordinated Universal Time) time zone.
The economic calendar content on the relevant page is obtained from reliable news and data providers. The news in the economic calendar content, the date and time of the announcement of the news, possible changes in the previous, expectations and announced figures are made by the data provider institutions. Darkex cannot be held responsible for possible changes that may arise from similar situations.
MARKET COMPASS
The rise in digital assets, led by Bitcoin, continued during European trading today. BTC dominance also continues. Expectations that Trump is leading the presidential race are the main dynamic underpinning the gains, while markets continue to monitor macro indicators from the US.
Among the data released today, although Consumer Confidence was realized above the forecasts, the indicator showing the number of job openings throughout September, excluding the agricultural sector and briefly referred to as JOLTS, remained below the forecasts. The first impact after the release of the figures was a depreciation in the dollar and a supportive effect on the rise in digital assets. Macro indicators that will provide information about the health of the US labor market will continue to be monitored.
The critical US employment data to be released on Friday is likely to be the most important development of this week. Click here to review our report on this subject.
The key variables of our equation continue to point to a bullish long-term outlook for digital assets. We remain committed to our warning that we may see short-term pullbacks. However, in the current market ecosystem, these potential pullbacks may remain limited. It would be useful for investors to pay attention to this point.
TECHNICAL ANALYSIS
BTC/USDT
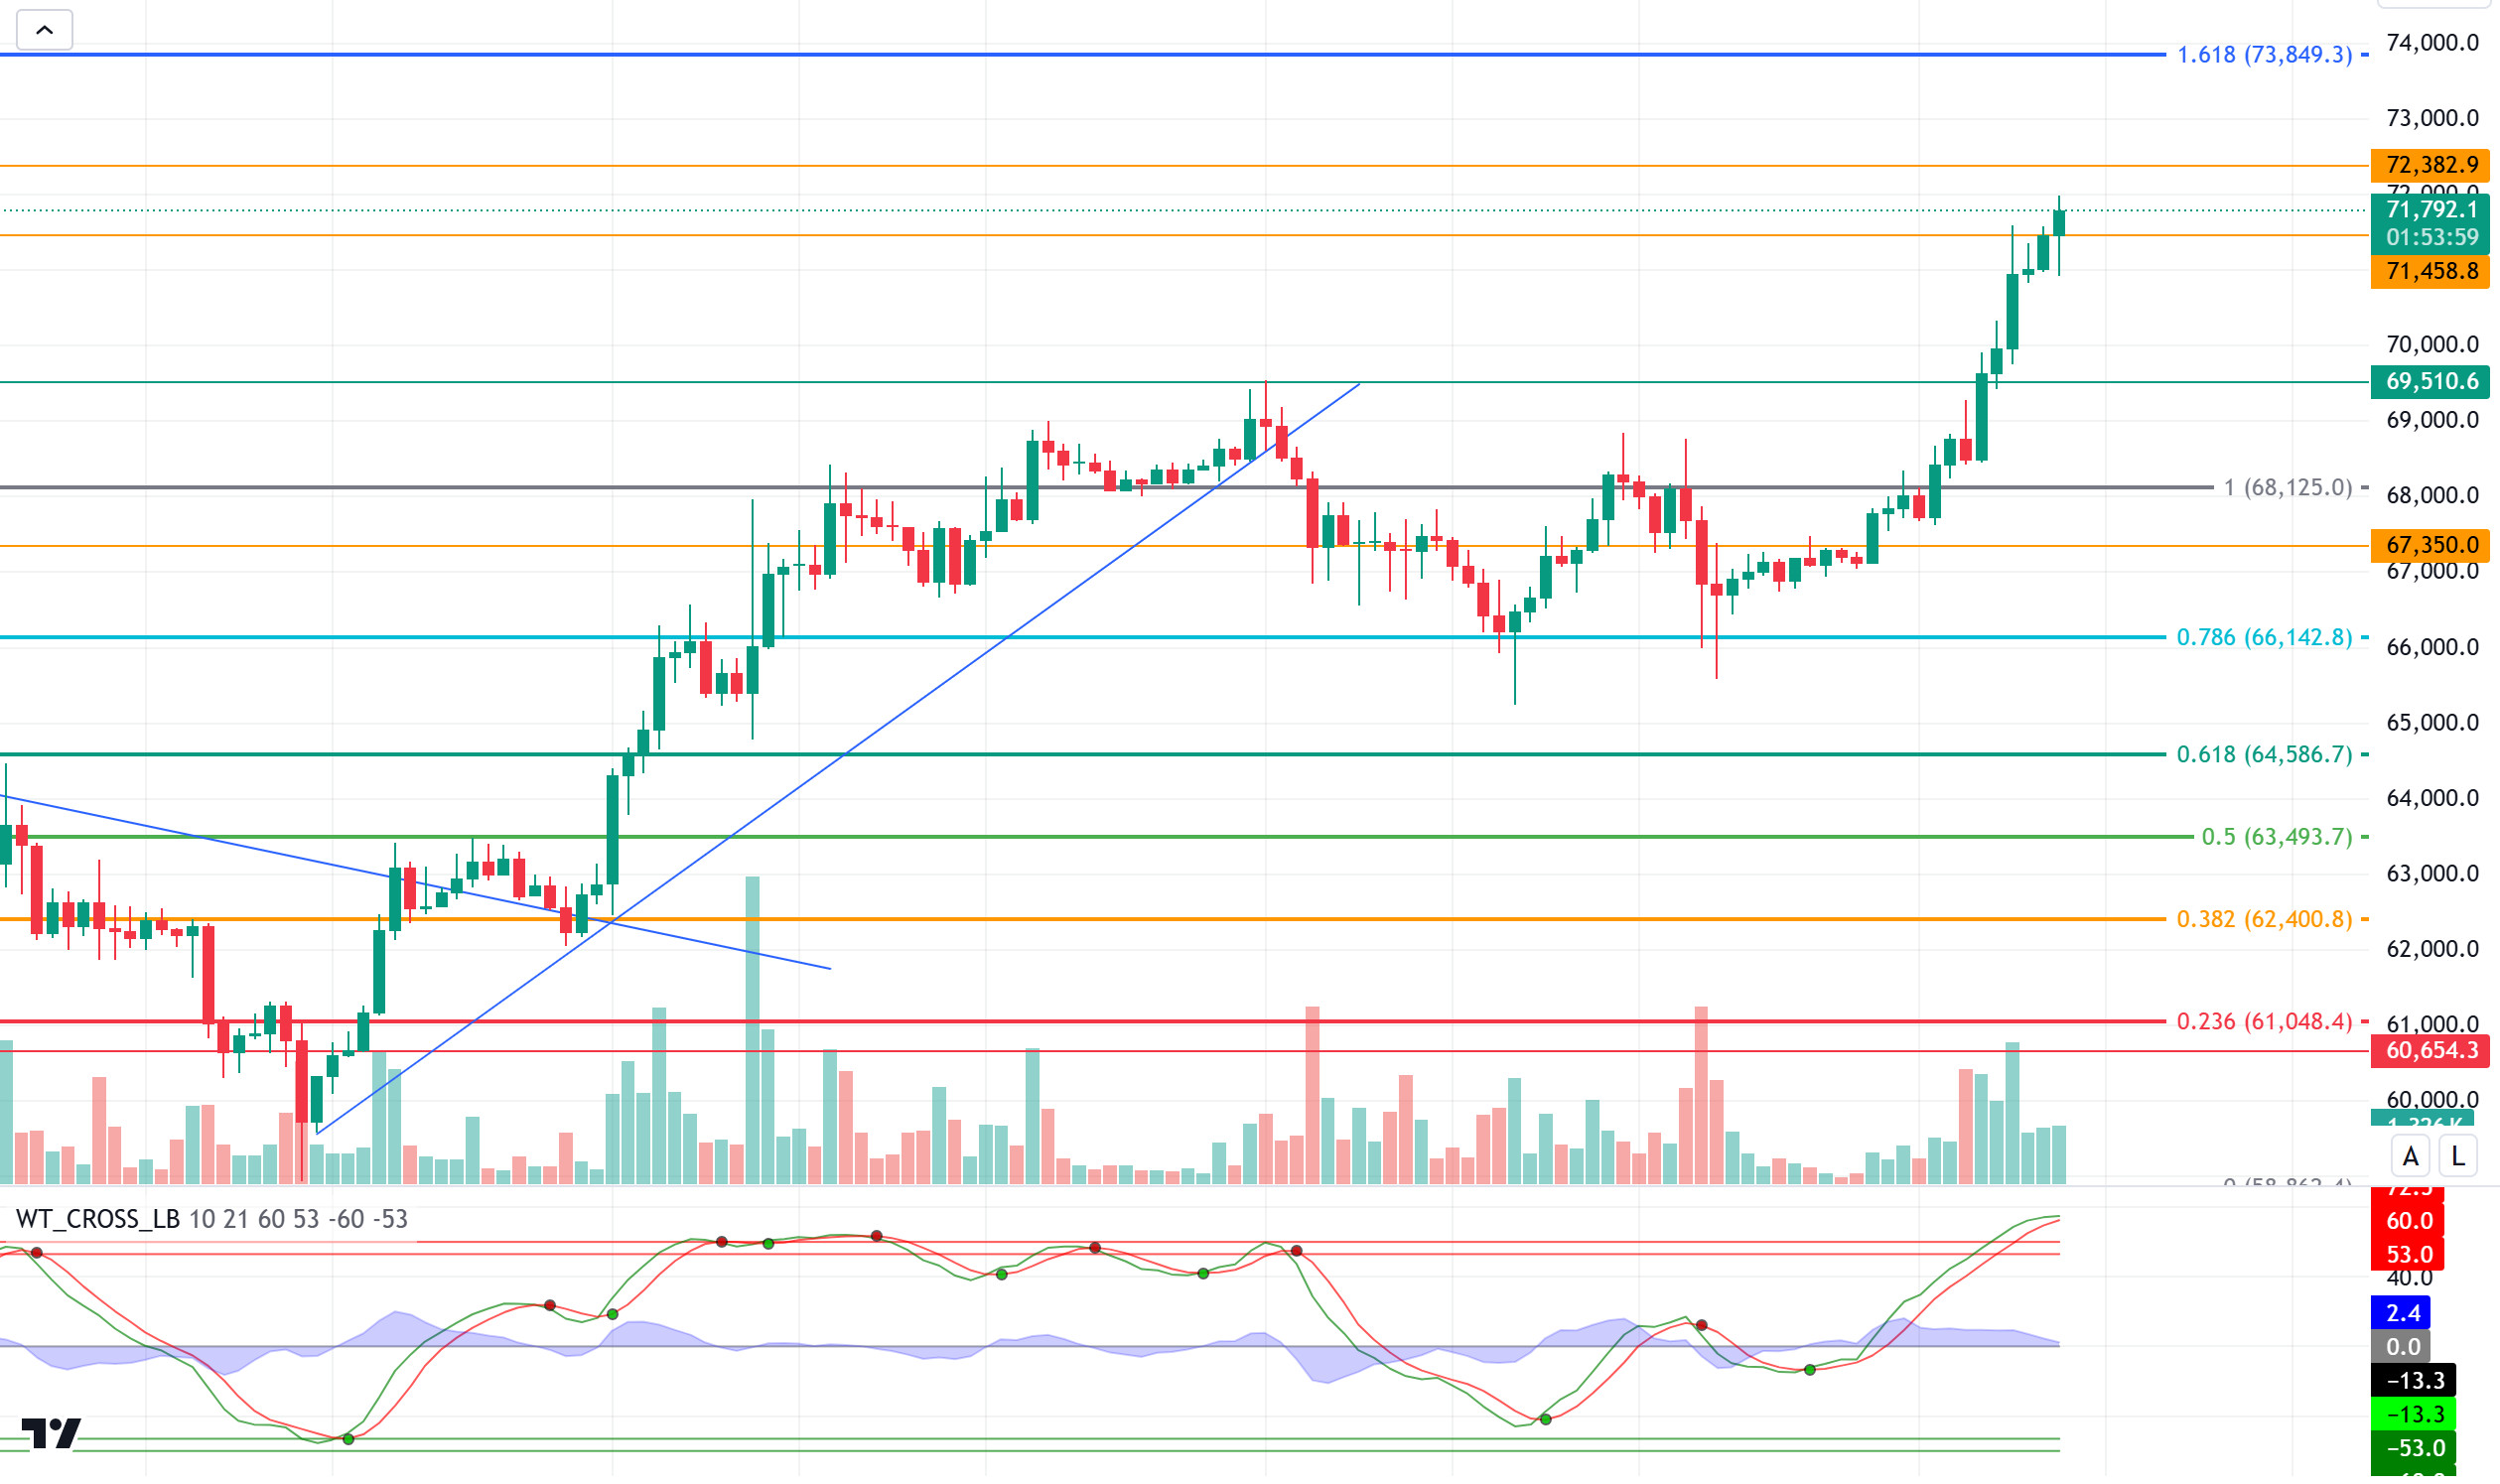
Bitcoin continues to hold on to its peak. As we reached the end of October, “uptober” made its effect felt with the interest of institutional investors and pushed Bitcoin above the 71,000 level. With the intense agenda awaiting the market in the coming days, the level at which Bitcoin price movements will meet the US elections will give us an idea about a new ATH level.
When we look at the BTC technical outlook, it is currently pricing at 71,682, just above the resistance level of 71,458 during the day. With the market dynamics keeping the risk appetite high, we will follow the hourly closures above the resistance level of 71,458 in the continuation of the bullish movements. In case of hourly closures, the minor resistance level that will meet us will be the 72,382 point. Technical indicators coming into the overbought zone may cause the bullish momentum to weaken. A correction in BTC may be seen as necessary to gain new upward momentum. The support level we will follow in the retracement will be 69,510.
Supports 69,510 – 68,125- 67,350
Resistances 71,458 – 72,382 – 73,750
ETH/USDT
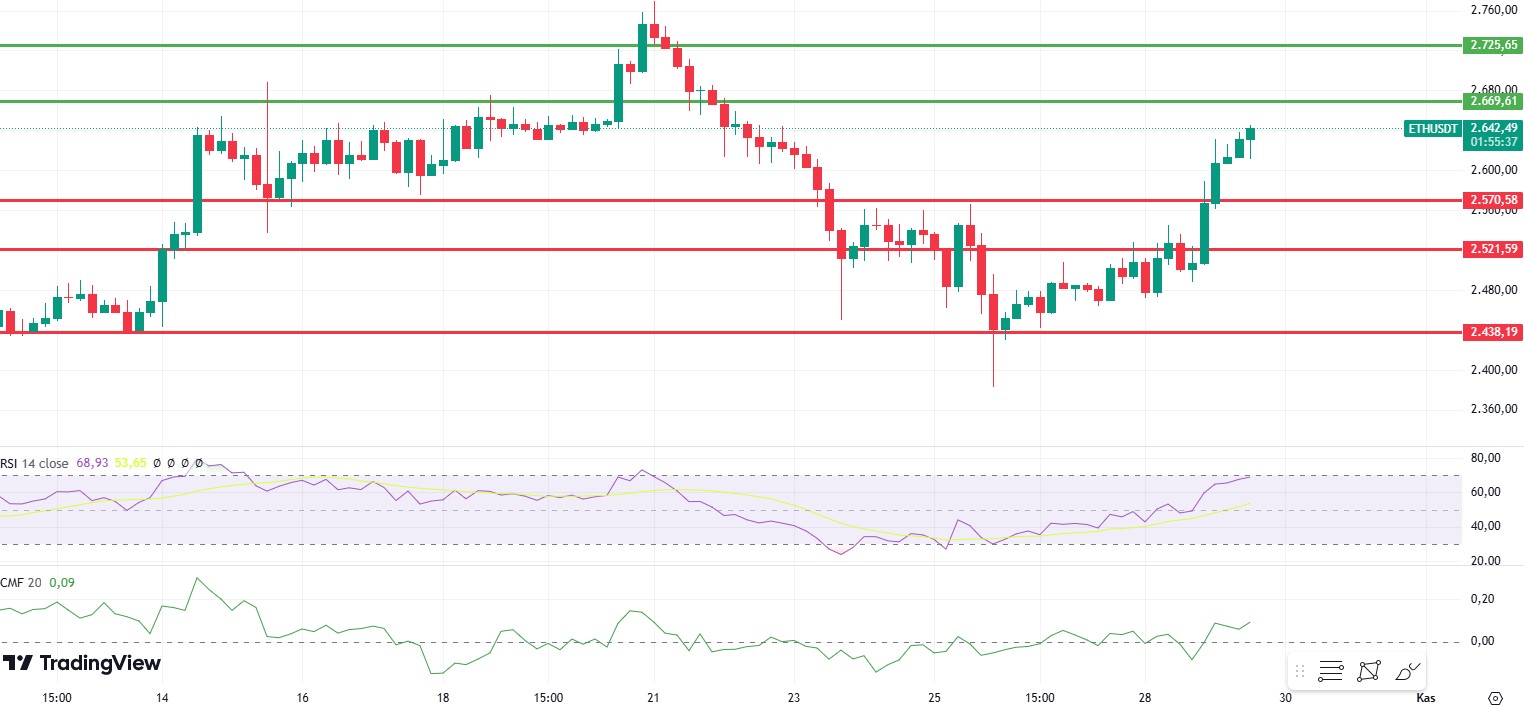
Although Relative Strength Index (RSI) and Chaikin Money Flow (CMF) still look positive for ETH, which moved relatively weak during the day, the negative divergence in the hourly time interval in RSI may bring some decline. Cumulative Volume Delta (CVD) also shows that futures-weighted purchases continue. This is another data that supports a possible correction in the evening. However, in addition to all these, exceeding the 2,669 level, which is the most important resistance level, may disrupt the negative outlook and bring a continuation of the rise. Loss of the 2,571 level may deepen the decline.
Supports 2,571 – 2,521 – 2,438
Resistances 2,669 – 2,725 – 2,792
LINK/USDT
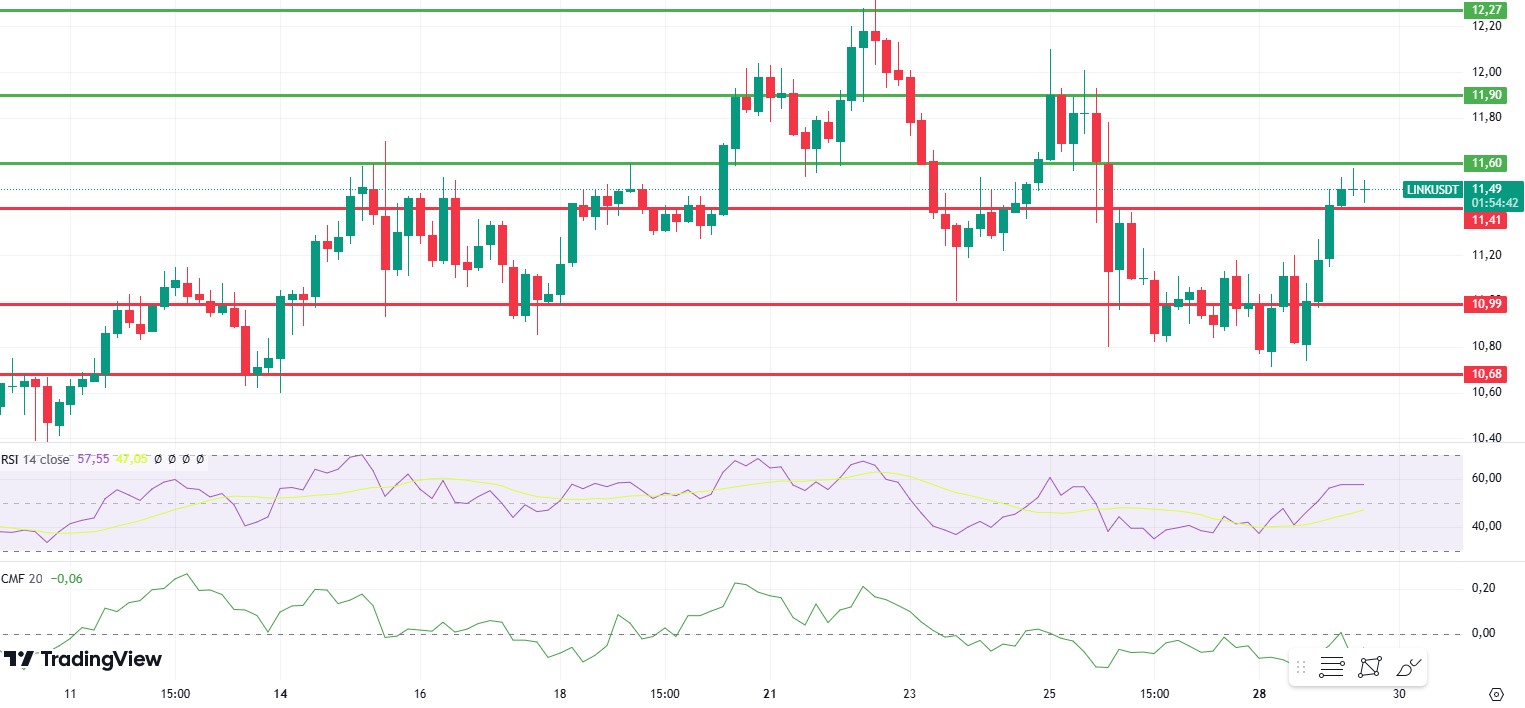
As mentioned in the morning analysis, LINK failed to break the 11.60 level and fell again to 11.41. Although it is slightly up again with the market rally, the excessive increase in Relative Strength Index (RSI) and the negative outlook in Chaikin Money Flow (CMF) indicate that the rises may be limited. A break of the 11.60 level may enable the positive scenario, but closes below 11.41 may bring declines to 10.99.
Supports 11.41 – 10.99 – 10.68
Resistances 11.60 – 11.90 – 12.27
SOL/USDT
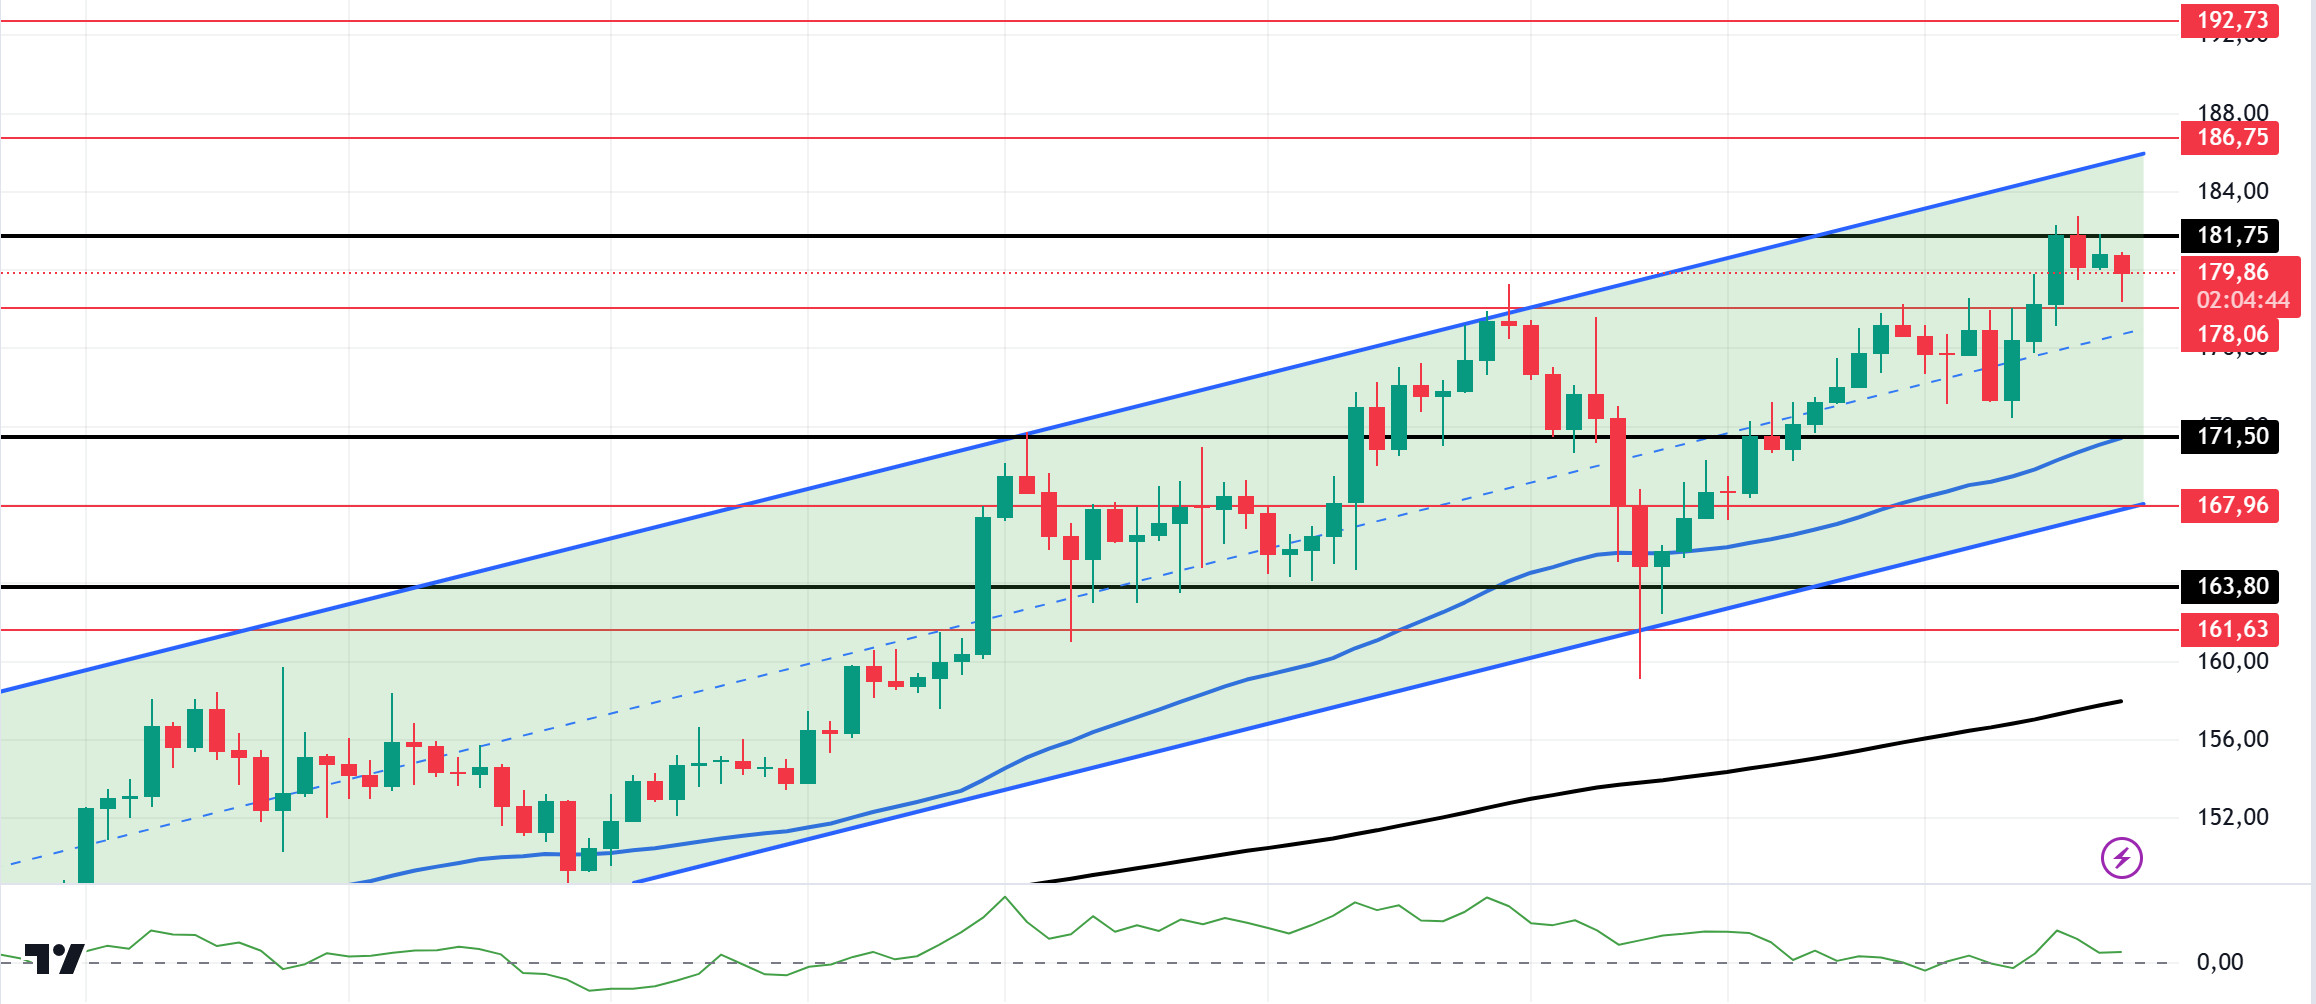
SOL, which has been priced horizontally since our morning analysis, encountered resistance at the highest level of the last 3 months after a 4-day rise. On the 4-hour timeframe, SOL tested strong resistance at $181.75. The 50 EMA (Blue Line) continues to be above the 200 EMA (Black Line). This means that the uptrend will continue, but the large distance between them may bring possible declines. The Chaikin Money Flow (CMF)20 indicator has been decreasing since our morning analysis. The fact that the price is stable and the CMF indicator is falling reminds us of the possibility of a pullback. This indicates that inflows are decreasing and the rise is in line with the general market. Since October 10, the high swap level has been at 154.29. This is where buyers and sellers have traded the most. For this reason, investors who want to realize profits may cause a retreat from these levels. The 181.75 level stands out as a very strong resistance level in the uptrend driven by both macroeconomic conditions and innovations in the Solana ecosystem. If it rises above this level, the rise may continue strongly. In case of possible political reasons or profit sales, the support levels of 171.50 and 163.80 may be triggered again. If the price comes to these support levels, a potential bullish opportunity may arise.
Supports 178.06 – 171.50 – 167.96
Resistances 181.75 – 186.75 – 192.73
ADA/USDT
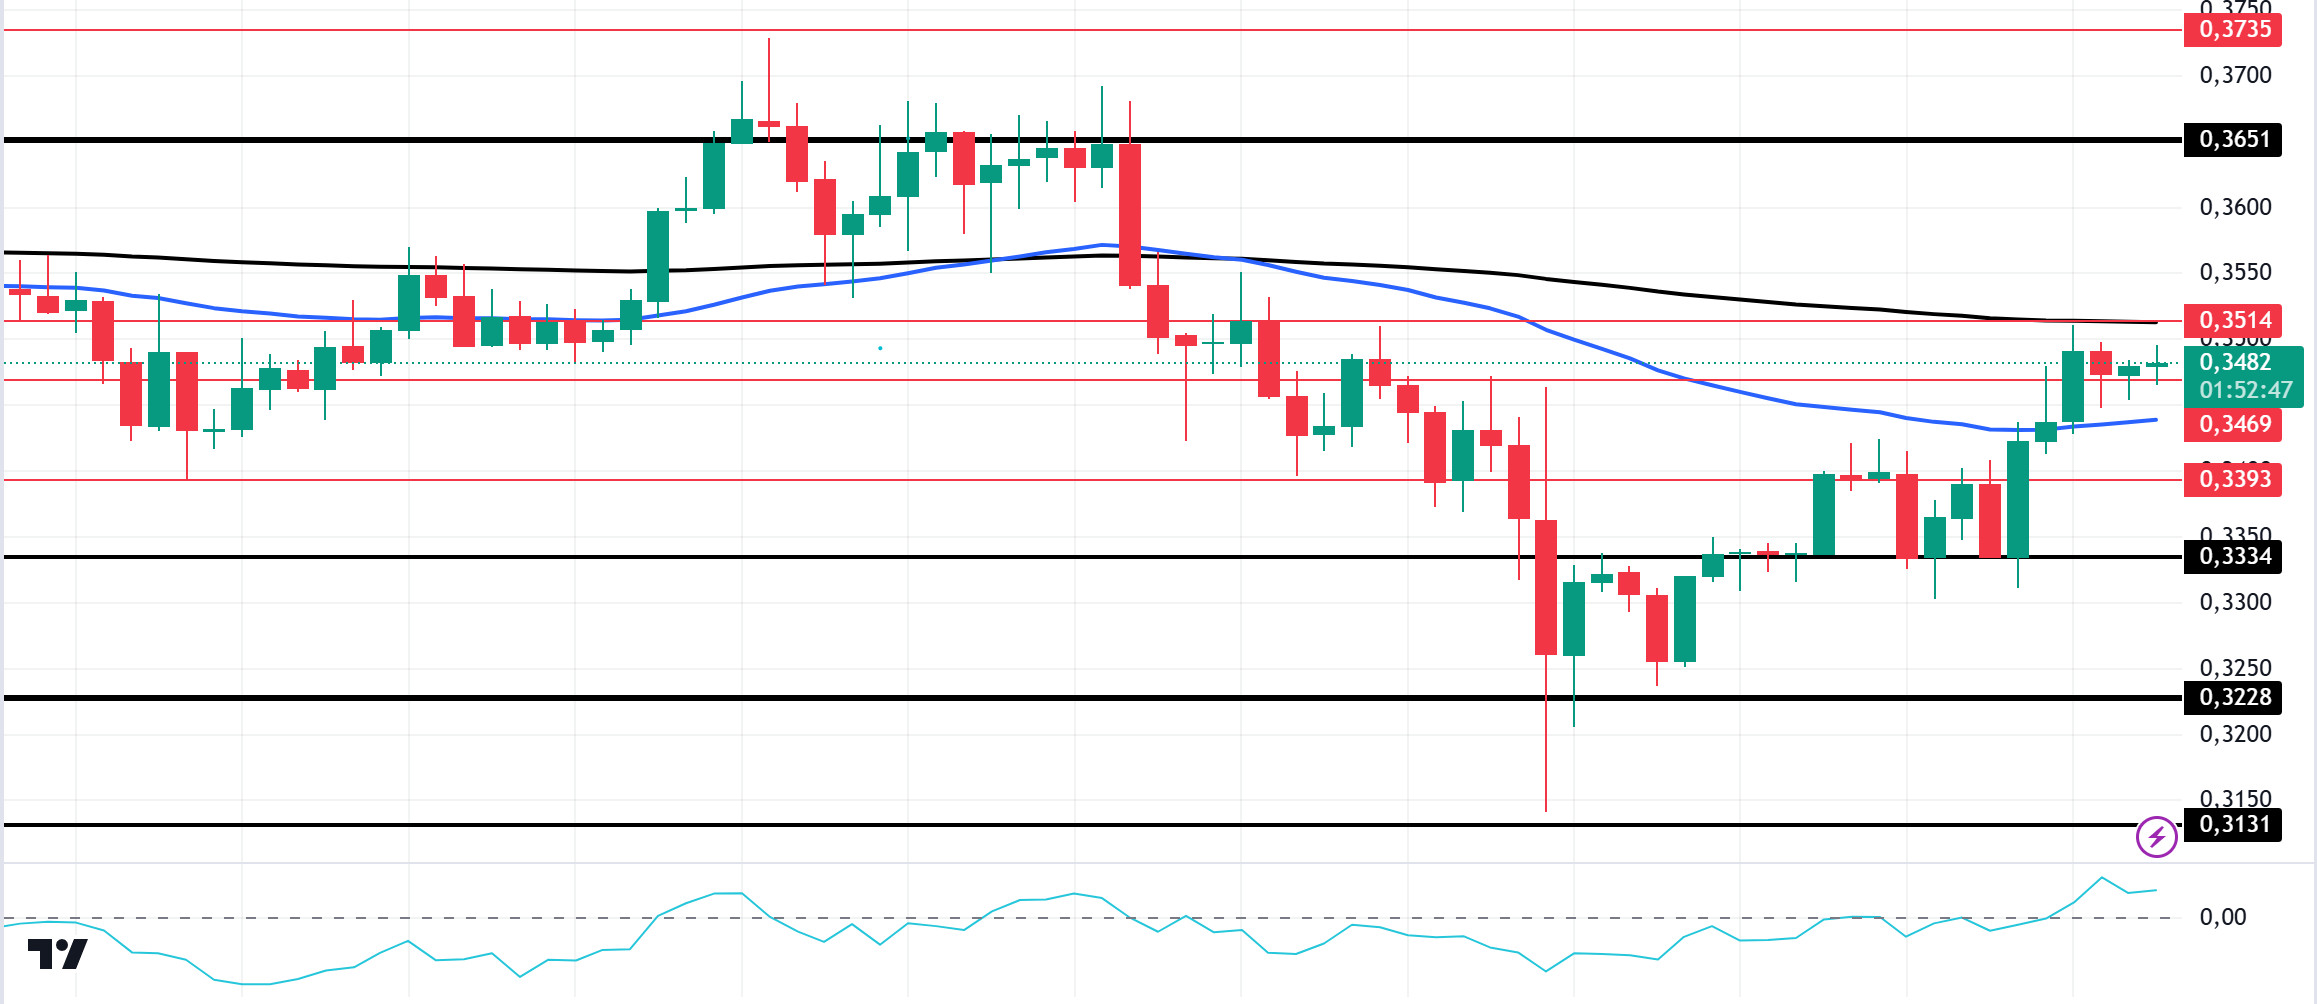
Technically, on the 4-hour chart, the price is stuck between the 50 EMA (Blue Line) and the 200 EMA (Black Line). At the same time, the 50 EMA is below the 200 EMA. This shows that the trend is bearish. At the same time, ADA price is currently stuck in a three-month range after testing resistance twice and support three times. The Chaikin Money Flow (CMF)20 indicator has increased and turned positive. Therefore, we can see that money inflows are increasing. As a matter of fact, the price may retest the 200 EMA even though there is support from the 50 EMA and resistance from the 200 EMA. If it exceeds this resistance, it may test the 0.3651 level once again. If the decline continues, it may test the support level of 0.3228 once again. It may be appropriate to buy when it reaches this price level.
Supports 0.3469 – 0.3393 – 0.3334
Resistances 0.3514 – 0.3651 – 0.3735
AVAX/USDT
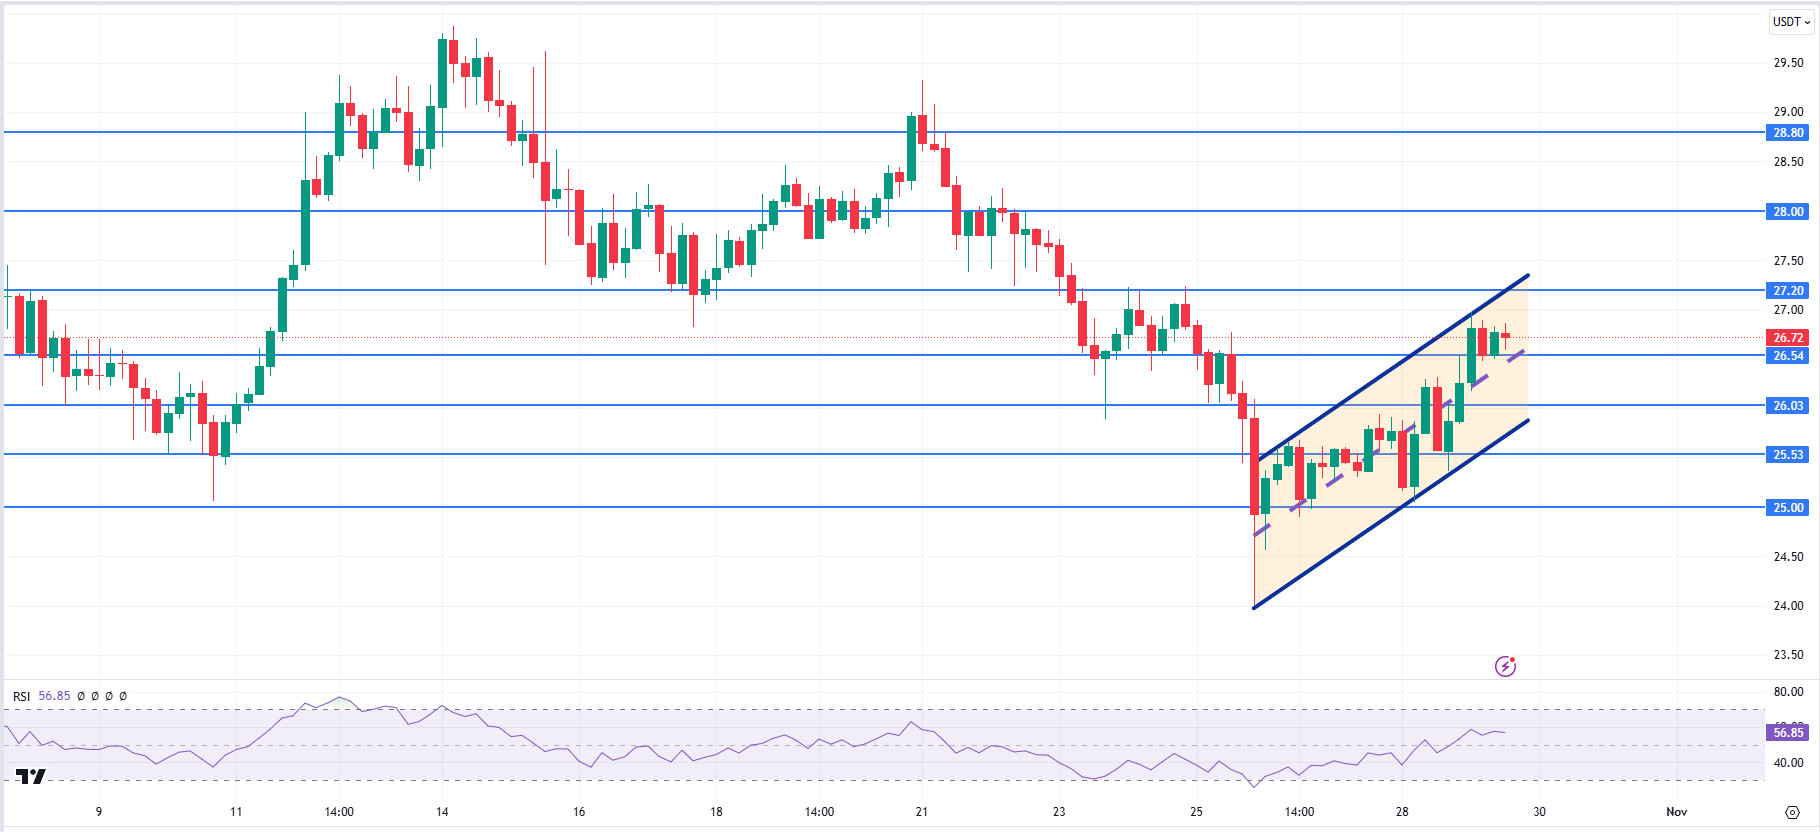
AVAX, which opened today at 26.26, is trading at 26.72, up about 1.5% during the day. Conference board consumer confidence and job openings and staff turnover rate data will be released by the US today. In particular, the job openings and staff turnover rate data is important for the market, which is nervous about recession. A much lower than expected data may be negatively priced by the market. In addition, news flows from the Middle East will be important for the market.
On the 4-hour chart, it moves within the bullish channel. It is in the middle band of the bullish channel and with a Relative Strength Index value of 56, some decline can be expected from these levels. In such a case, it may test 26.03 support. On the other hand, if today’s data is perceived positively or news that the tension in the Middle East is over, purchases may increase. In such a case, it may test the 27.20 resistance. As long as it stays above 25.00 support during the day, the desire to rise may continue. With the break of 25.00 support, sales may increase.
Supports 26.54 – 26.03 – 25.53
Resistances 27.20 – 28.00 – 28.80
TRX/USDT
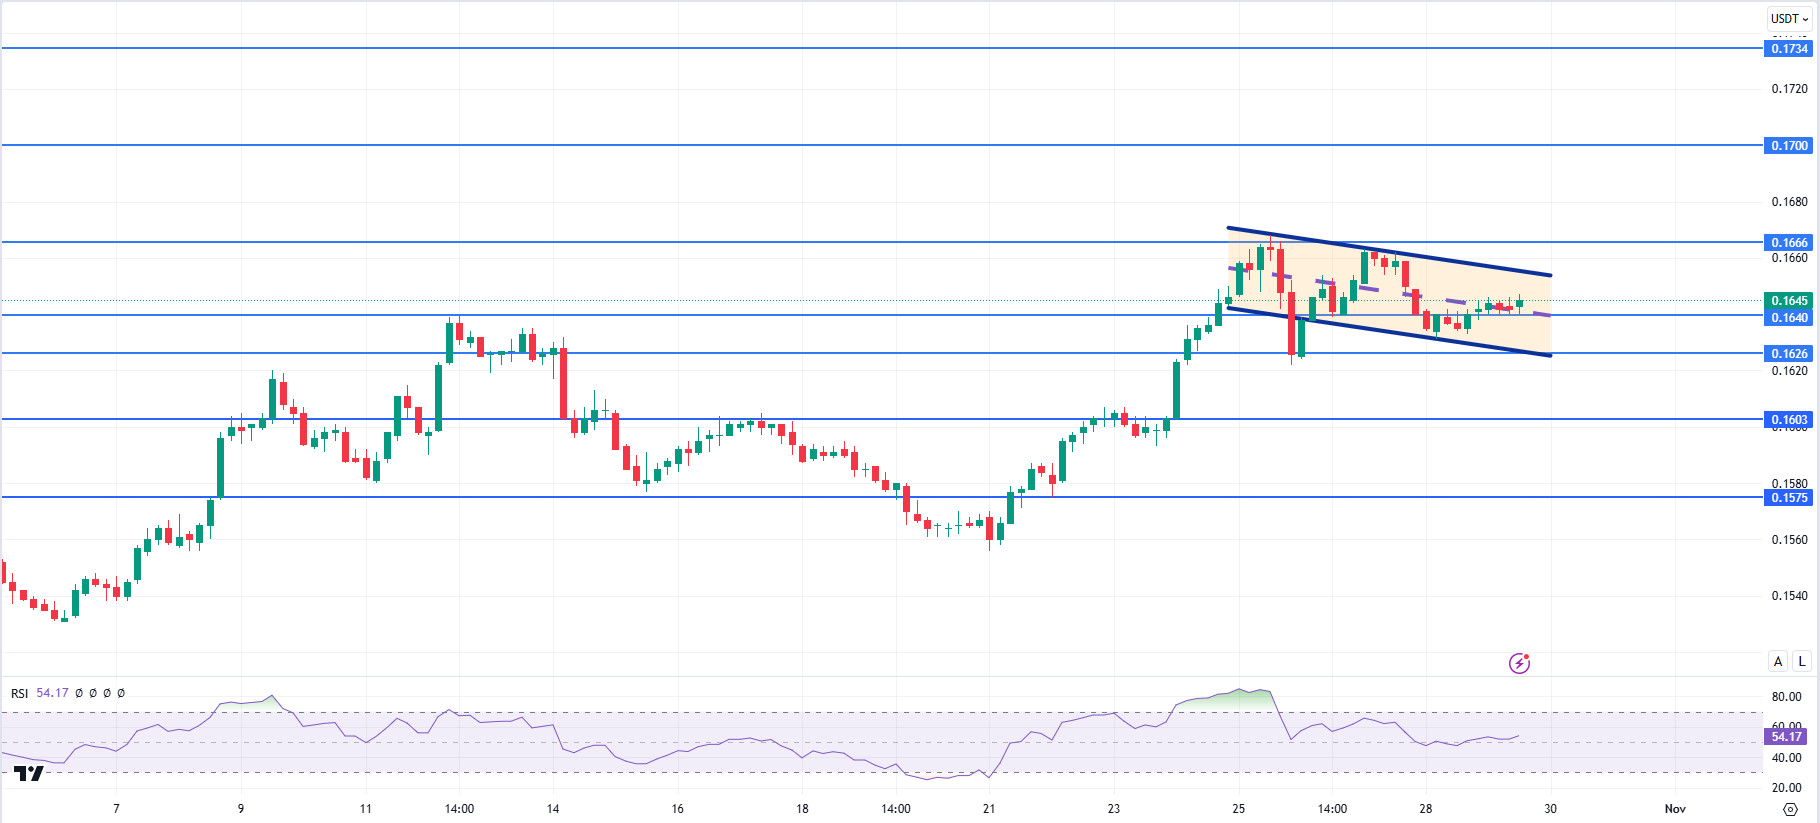
TRX, which started today at 0.1642, is trading at 0.1645, moving horizontally during the day. Today, conference board consumer confidence and job opportunities and staff turnover rate data are important data that the market will follow. Volatility in the market may increase during the data release. The market will also be closely following the news flows regarding the tension in the Middle East.
On the 4-hour chart, the bearish channel is in the middle band. Relative Strength Index value is 54 and some decline can be expected from its current level. In such a case, it may move to the lower band of the channel and test the 0.1626 support. However, it cannot close the candle below 0.1640 support and may test 0.1666 resistance with the buying reaction that will occur if news flow comes that the tension in the Middle East is over. As long as TRX stays above 0.1482 support, the desire to rise may continue. If this support is broken downwards, sales can be expected to increase.
Supports 0.1640 – 0.1626 – 0.1603
Resistances 0.1666 – 0.1700 – 0.1734
DOT/USDT
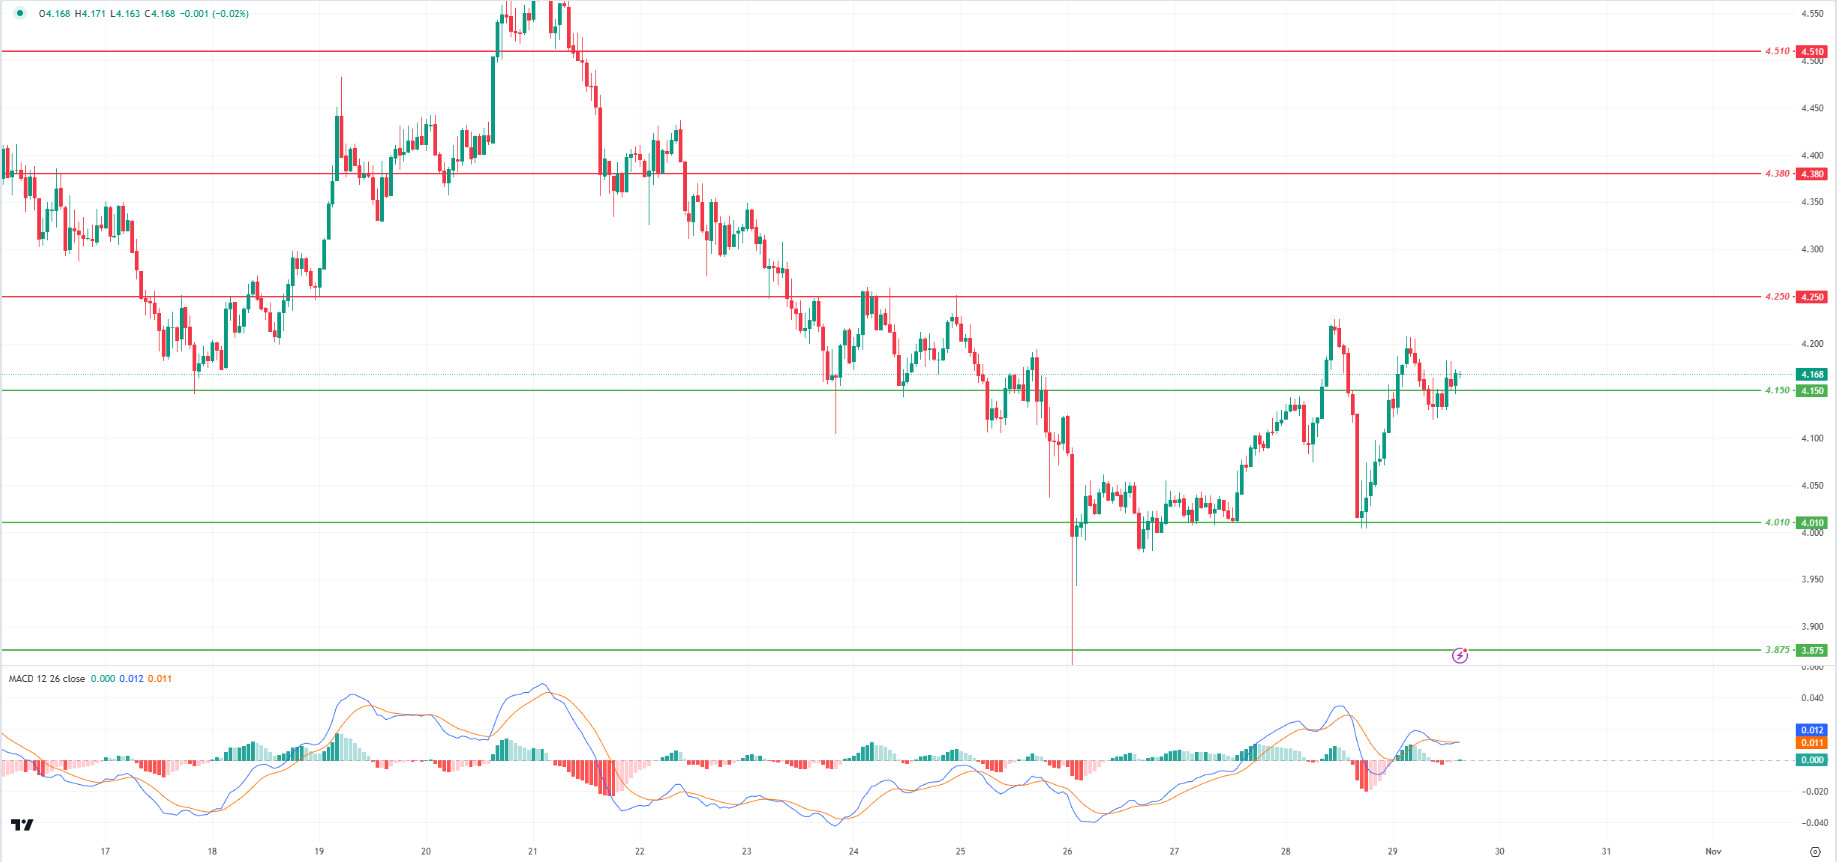
When we examine the Polkadot (DOT) chart, we see that the price is above the 4.150 level. According to the MACD oscillator, we can say that the selling pressure has decreased compared to the previous hour. In this context, the price may want to break the selling pressure at the 4,250 resistance level. On the other hand, if the price breaks the 4.150 support band down, we can expect a retracement towards 4.010 levels.
Supports 4,150 – 4,010 – 3,875
Resistances 4.250 – 4.380 – 4.510
SHIB/USDT
Shiba Inu has launched the NFT bridge for its Layer-2 blockchain Shibarium. This innovation aims to facilitate the transfer of Ethereum-based NFTs to Shibarium, offering lower transaction fees and faster transaction times. Users will be able to deposit and withdraw Ethereum-based NFTs with wallets such as MetaMask, which could add liquidity and user base to the Shibarium ecosystem.
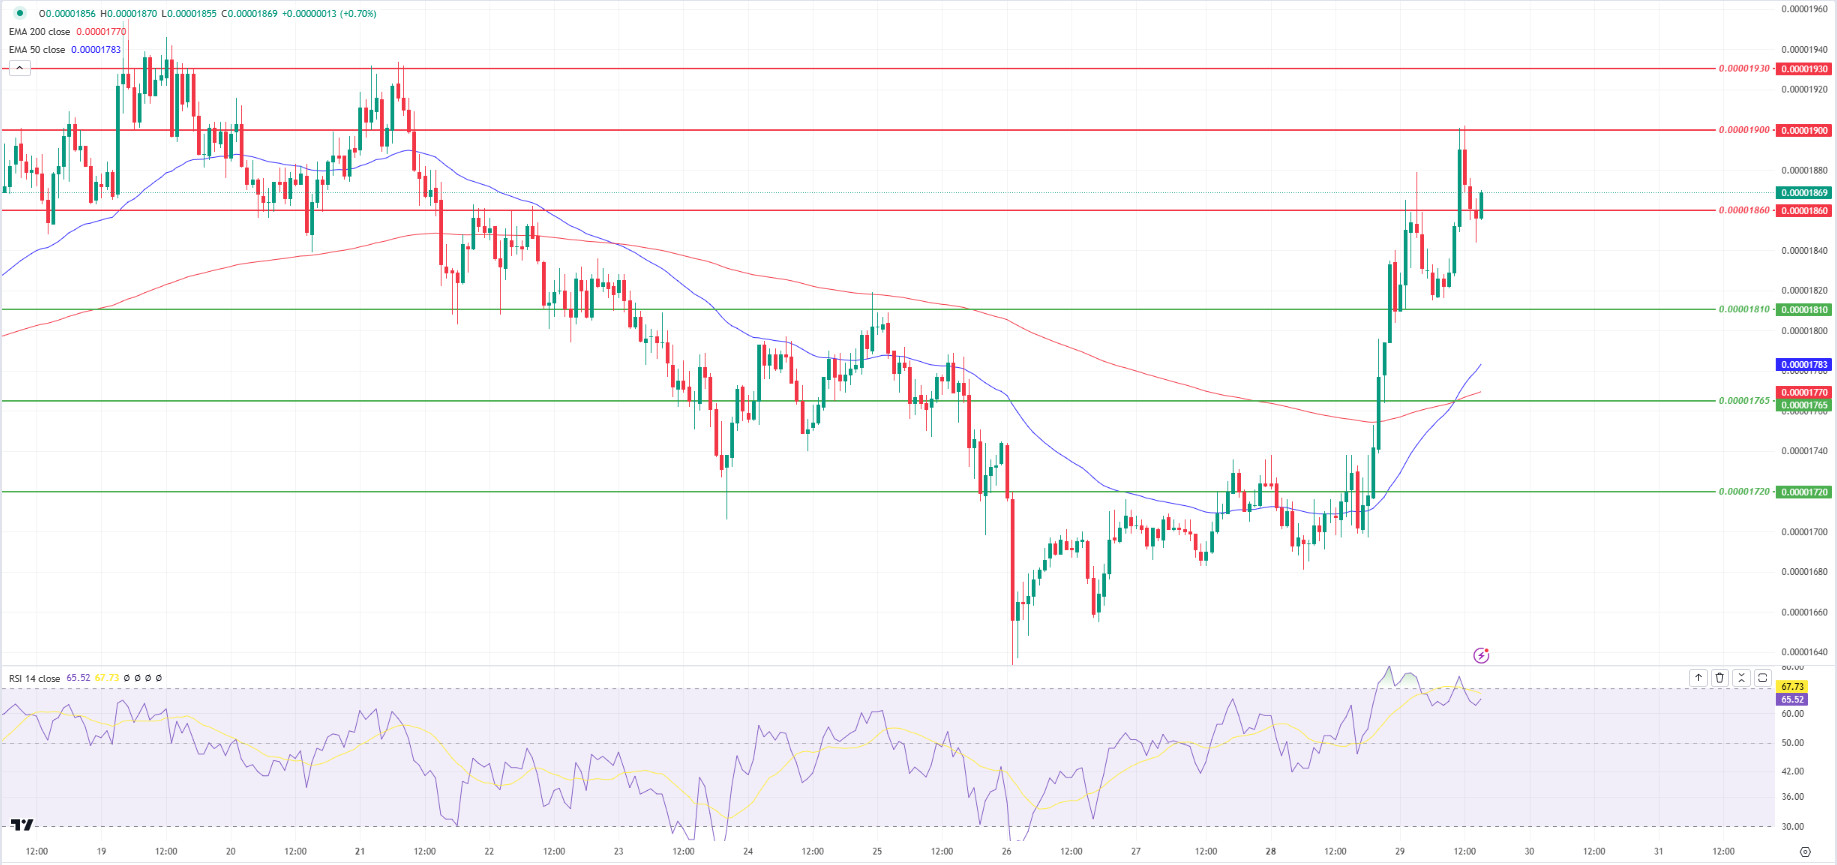
SHIB was rejected from the 0.00001900 resistance level. After the negative divergence between the Relative Strength Index (RSI) oscillator and the price, the price was rejected from the resistance level of 0.00001900. Currently the price is hovering around 0.00001860 levels. In the negative scenario, if the price breaks below 0.00001860, we can expect a pullback to 0.00001810. In the positive scenario, the EMA50 (Blue Line) broke the EMA200 upwards (Golden Cross). In this context, if the price holds above 0.00001860, it may want to break the selling pressure at 0.00001900.
Supports 0.00001810 – 0.00001765 – 0.00001720
Resistances 0.00001860 – 0.00001900 – 0.00001930
LEGAL NOTICE
The investment information, comments and recommendations contained herein do not constitute investment advice. Investment advisory services are provided individually by authorized institutions taking into account the risk and return preferences of individuals. The comments and recommendations contained herein are of a general nature. These recommendations may not be suitable for your financial situation and risk and return preferences. Therefore, making an investment decision based solely on the information contained herein may not produce results in line with your expectations.


