MARKET SUMMARY
Latest Situation in Crypto Assets
| Asset | Last Price | 24h Change | Dominance | Market Cap |
|---|---|---|---|---|
| BTC | 80,974.15 | 2.50% | 59.51% | 1.60 T |
| ETH | 3,141.44 | -1.39% | 14.06% | 378.31 B |
| SOLANA | 207.22 | 0.74% | 3.63% | 97.80 B |
| DOGE | 0.2790 | 22.73% | 1.52% | 41.00 B |
| XRP | 0.5761 | -0.84% | 1.20% | 32.75 B |
| CARDANO | 0.5761 | 0.33% | 0.74% | 20.06 B |
| SHIB | 0.00002492 | 12.17% | 0.54% | 14.74 B |
| TRX | 0.1640 | -0.18% | 0.53% | 14.18 B |
| AVAX | 31.12 | -1.12% | 0.47% | 12.70 B |
| LINK | 13.76 | -4.47% | 0.32% | 8.63 B |
| DOT | 5.048 | 2.36% | 0.28% | 7.63 B |
*Prepared on 11.11.2024 at 06:00 (UTC)
WHAT’S LEFT BEHIND
Bitcoin Price Exceeds $80,000
Bitcoin (BTC) surpassed $80,000, extending its weekly gain to 16% and reaching its highest level since February With BTC’s appreciation, the annualized premium on three-month bitcoin futures on major exchanges such as Binance and Deribit exceeded 14% for the first time since June, according to Velo data. On CME, the futures premium rose above 10%.
Mt. Big Bitcoin Moves from Mt. Gox
On Sunday, a significant transfer of 30,371 BTC from the shuttered Mt. Gox exchange on Sunday, a significant transfer of 30,371 BTC caught the attention of the crypto community. The transaction, worth approximately $2.44 billion, took place just after midnight UTC and marks a milestone in the long-awaited repayment process for creditors.
Elon Musk Supports Ending the Federal Reserve
Elon Musk took a step in support of Utah Senator Mike Lee’s call to abolish the US Federal Reserve, re-sharing Lee’s post in this direction. Senator Lee stated that the central bank should be abolished, arguing that monetary policy should be under more direct control of the executive branch.
Ki Young Ju, founder and CEO of CryptoQuant
Ki Young Ju, founder and CEO of CryptoQuant, wrote on the X platform: “The market is expected to adjust as Bitcoin futures market indicators are overheating, but currently Bitcoin is entering the price discovery phase and the market is getting hotter. If there is a correction and consolidation, the bull market is likely to continue; however, a strong rally at the end of the year could set the stage for a bear market in 2025. ”
HIGHLIGHTS OF THE DAY
Important Economic Calender Data
| Time | News | Expectation | Previous |
|---|---|---|---|
| Stellar (XLM) General – Coinbase Launches SLR and XLM Futures Contracts | – | – | |
| Filecoin (FIL) Event – Event in Bangkok, Thailand | – | – | |
| Arbitrum (ARB) Meetup – Event in Bangkok in Collaboration with Azuki | – | – | |
| SKALE (SKL) Conference – Sawadee Web3 Gaming Conference in Bangkok, Thailand | – | – | |
| Oasis Network (ROSE) Summit – Super Intelligence Summit | – | – |
INFORMATION
*The calendar is based on UTC (Coordinated Universal Time) time zone.
The economic calendar content on the relevant page is obtained from reliable news and data providers. The news in the economic calendar content, the date and time of the announcement of the news, possible changes in the previous, expectations and announced figures are made by the data provider institutions. Darkex cannot be held responsible for possible changes that may arise from similar situations.
MARKET COMPASS
Digital assets started the new week with rallies led by Bitcoin, which renewed its record highs. The ongoing “Trump rally” continued to whet the appetite of buyers on Sunday and BTC approached around $82,000 with the upward momentum continuing today.
Global markets left an important agenda behind. After the US Federal Reserve’s (FED) announcements and the critical presidential election, the news from China this morning had an impact on asset prices. Announcing the stimulus package that investors have been waiting for a while, the leaders of the world’s second largest economy failed to convince the markets. It was seen that the incentives announced were aimed at enabling local governments to manage their debts rather than reviving the economy. For this reason, stock markets on the continent were generally negative. European futures contracts point to a slightly higher opening. Since banks will be closed in the US due to “Veterans Day”, volumes are expected to remain low today.
From the short term to the big picture.
The victory of former President Trump, one of the main pillars of our bullish expectation for the long term perspective in digital assets, produced a result in line with our forecasts. The continuation of the Fed’s interest rate cut cycle and the inflows into BTC ETFs, indicating increased institutional investor interest, support our big picture upside forecast for now.
In the short term, given the nature of the market and pricing behavior, we think it would not be surprising to see some respite or pullbacks in digital assets from time to time. At this point, it is worth reiterating that fundamental dynamics remain bullish. While the expansion of the largest digital currency Bitcoin’s record high may encourage buyers to take new, upside positions, we will watch this group struggle with the crowd that may want to take profit realizations.
TECHNICAL ANALYSIS
BTC/USDT
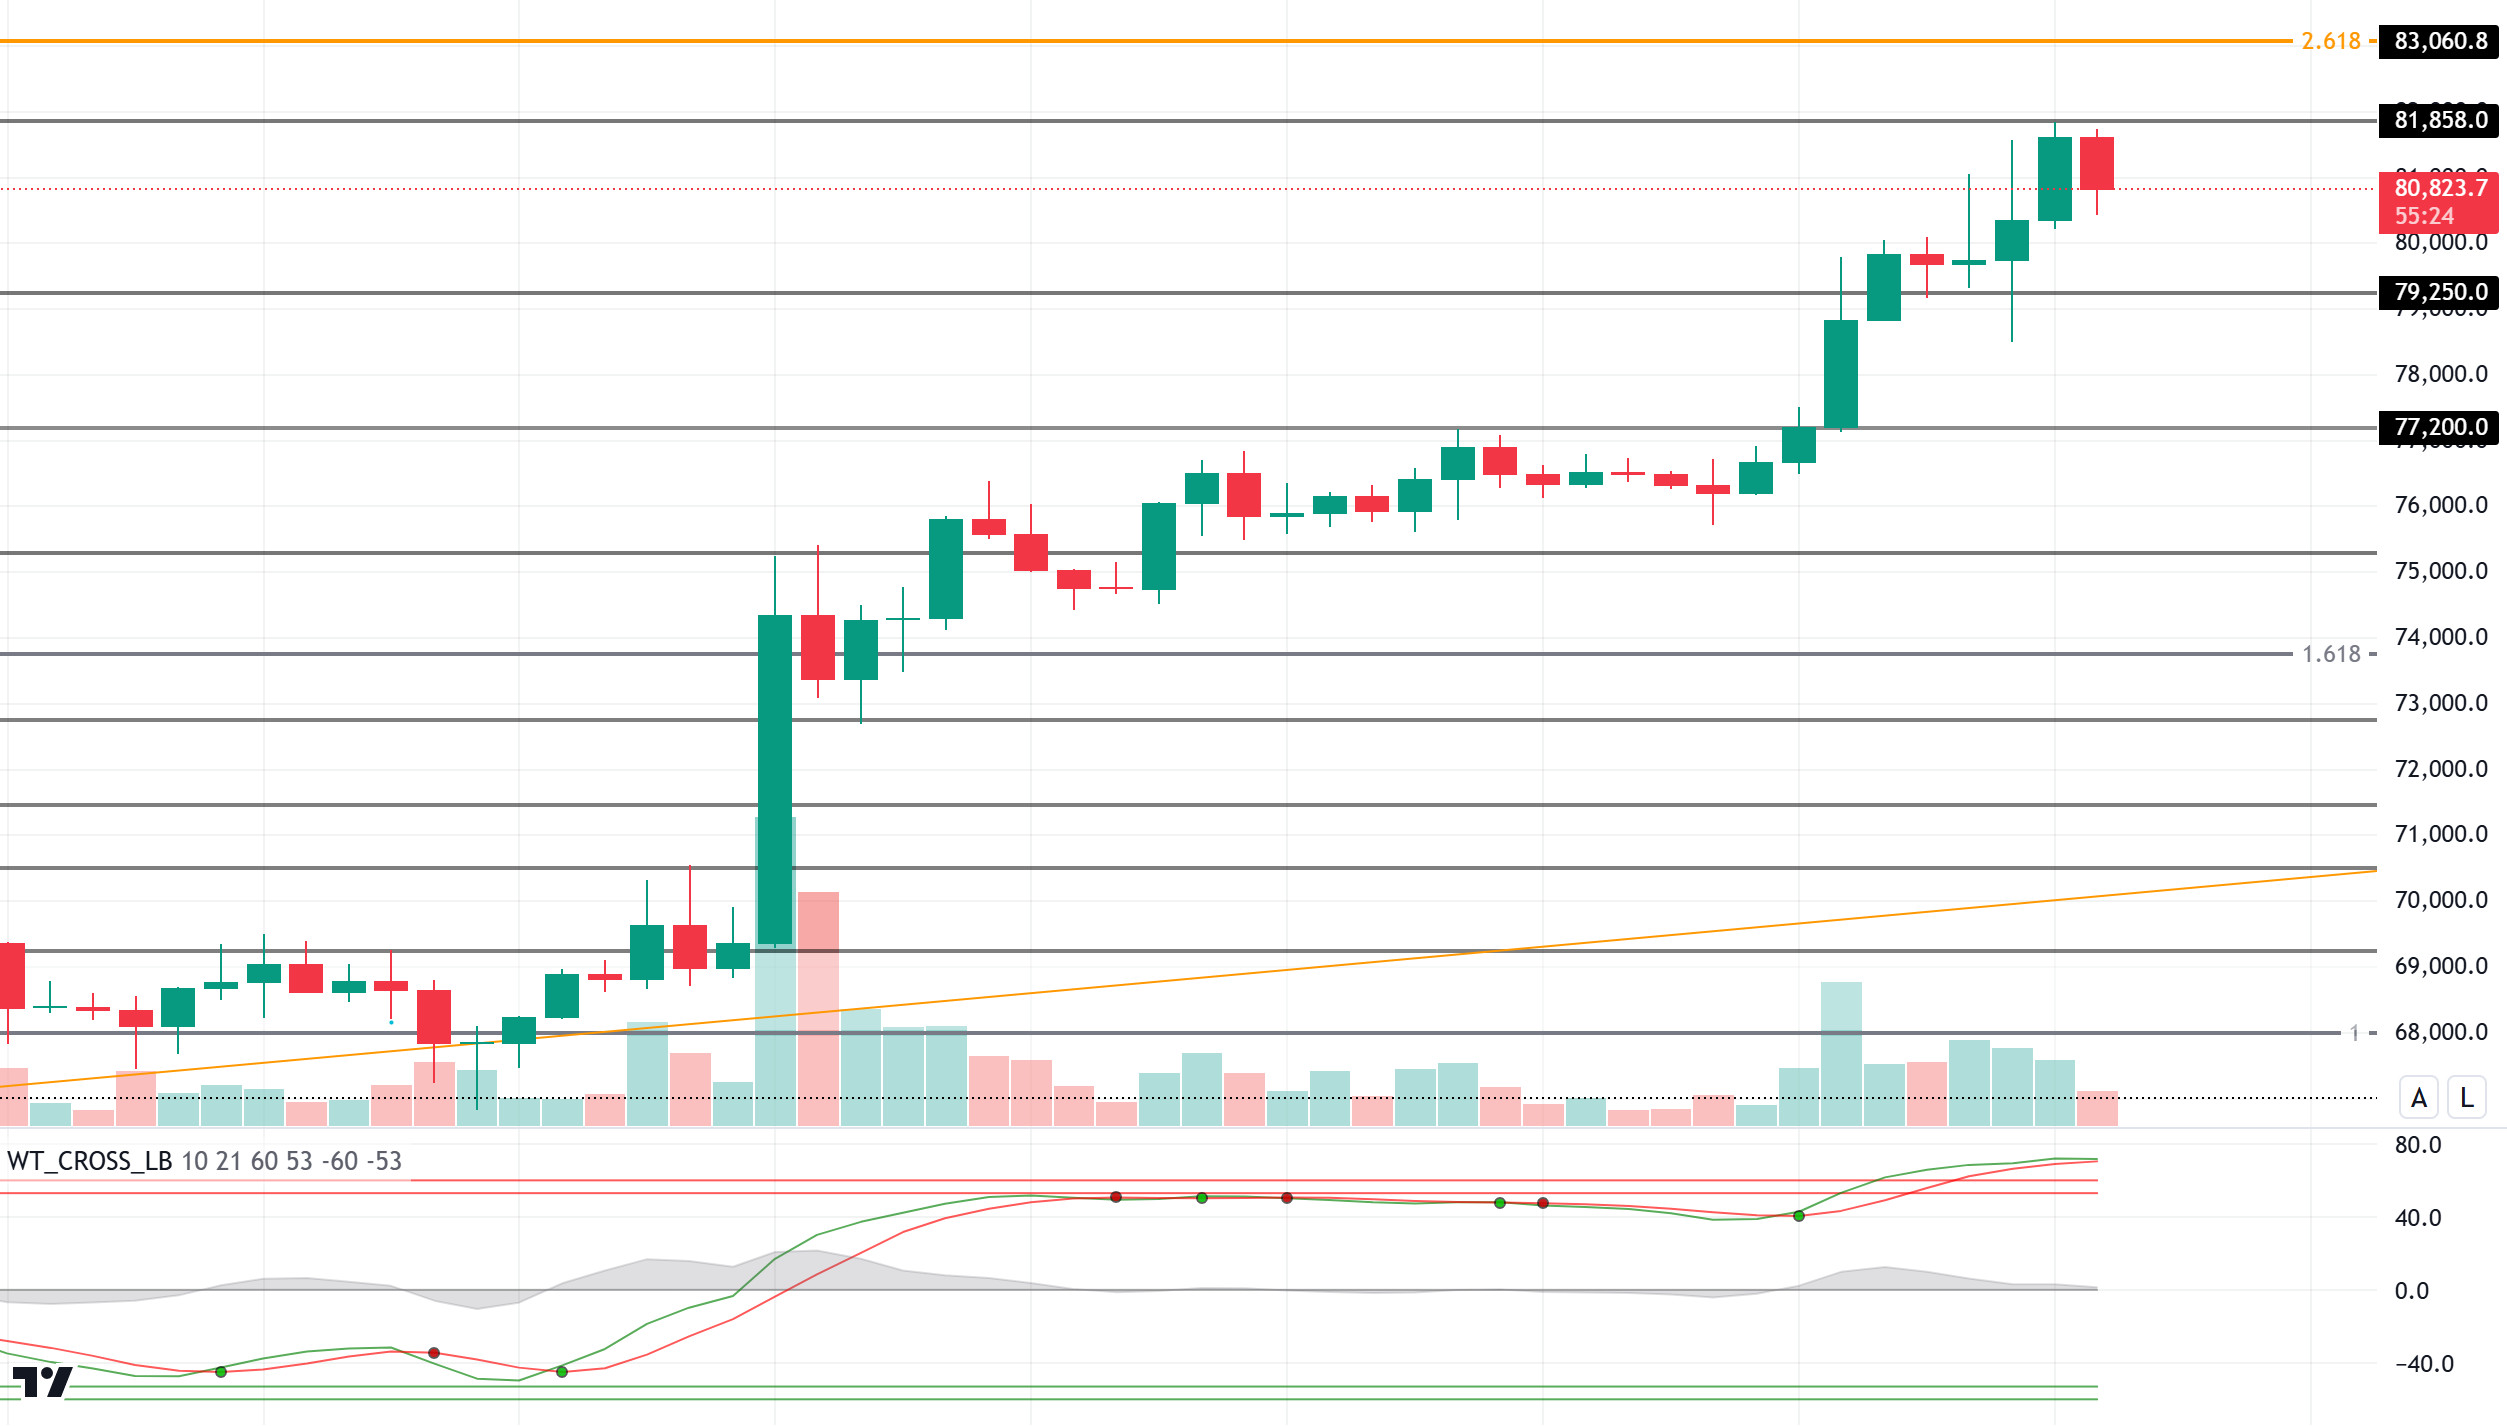
Following the US presidential elections, D. Trump’s victory pushed Bitcoin to a new ATH level of 81,858, with strong demand from both individual and institutional investors. The market sentiment reached the “extreme greed” level in Bitcoin, which increased its weekly gain to 16%, raising expectations among investors for a potential correction.
Looking at the BTC technical outlook, the price continues to create new highs with increasing upside momentum. BTC, which reached a new ATH level of 81,858 over the weekend, seems to continue to maintain its gains. With the increasing optimism in the market, the technical oscillators’ buy signals in the overbought zone attract attention. BTC, which is expected to make a correction in its technical outlook, maintains its strong stance as the fundamental outlook dominates. The support level we will follow in a potential pullback will be 79,250 points. With the peaks creating new peaks, Fibonacci 2.618 (83,060) may appear.
Supports 79,250 – 77,200 – 75,300
Resistances 81,858 – 83,060 – 85,000
ETH/USDT
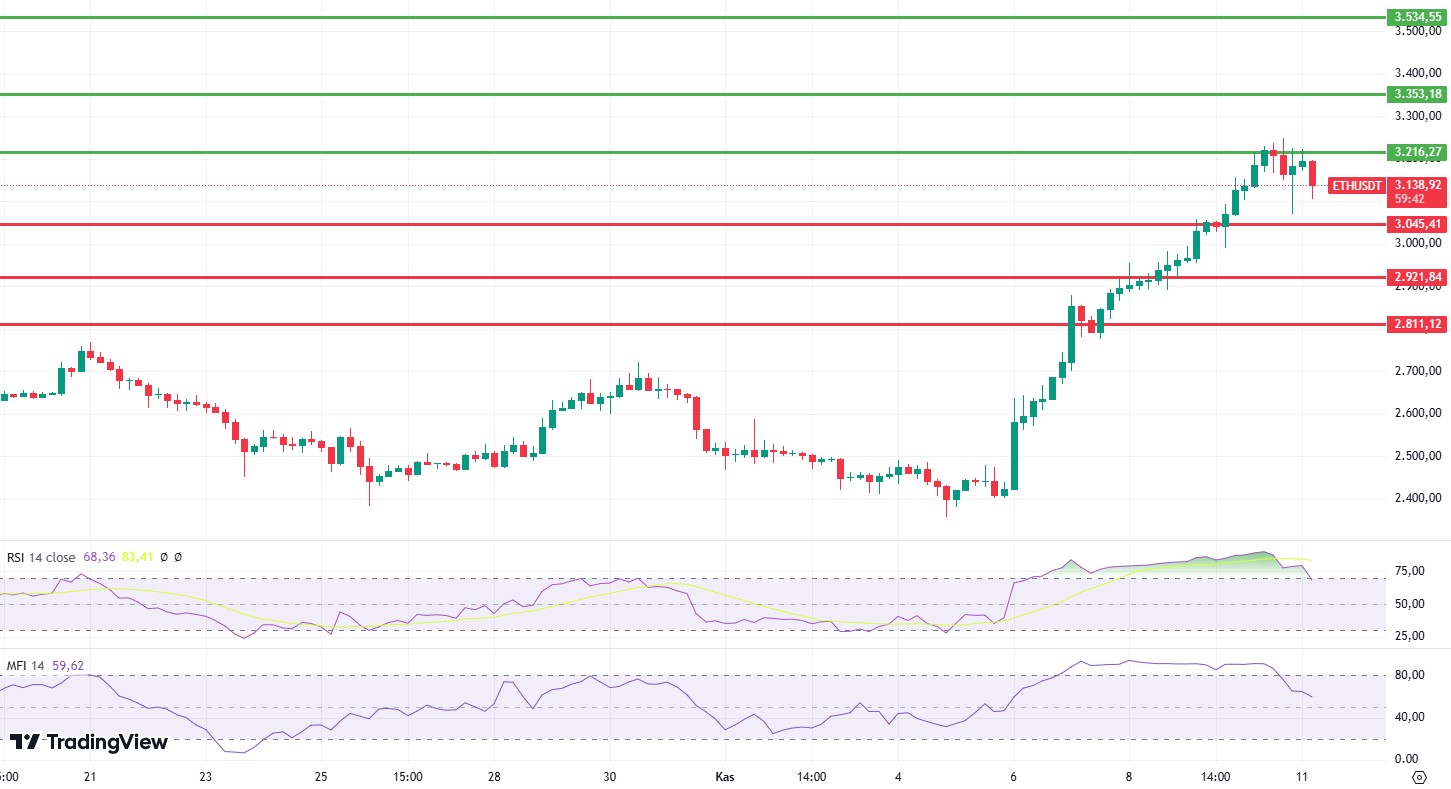
ETH surpassed the important resistance levels of 2,921 and 3,045 with the rise of Bitcoin and rose as high as 3,216. The sideways movement in this region can be seen as a healthy correction by allowing the Relative Strength Index (RSI) to move out of the overbought zone. Chaikin Flow (CMF) and Money Flow Index (MFI) also seem to be correcting similarly. In addition to all these, the Cumulative Volume Delta (CVD) is another factor that seems to be very positive for ETH, with spot buying still continuing on the spot side and increased selling pressure from the futures channel. Although ETH is likely to remain horizontal between 3,216 – 3,045 levels during the day, the break of the 3,216 level may continue the sharp rises. Below 3,045, we could see the correction continue to 2,921 and then to 2,811, the kijun support on the daily timeframe.
Supports 3,045 – 2,921 – 2,811
Resistances 3,216 – 3,353 – 3,534
XRP/USDT
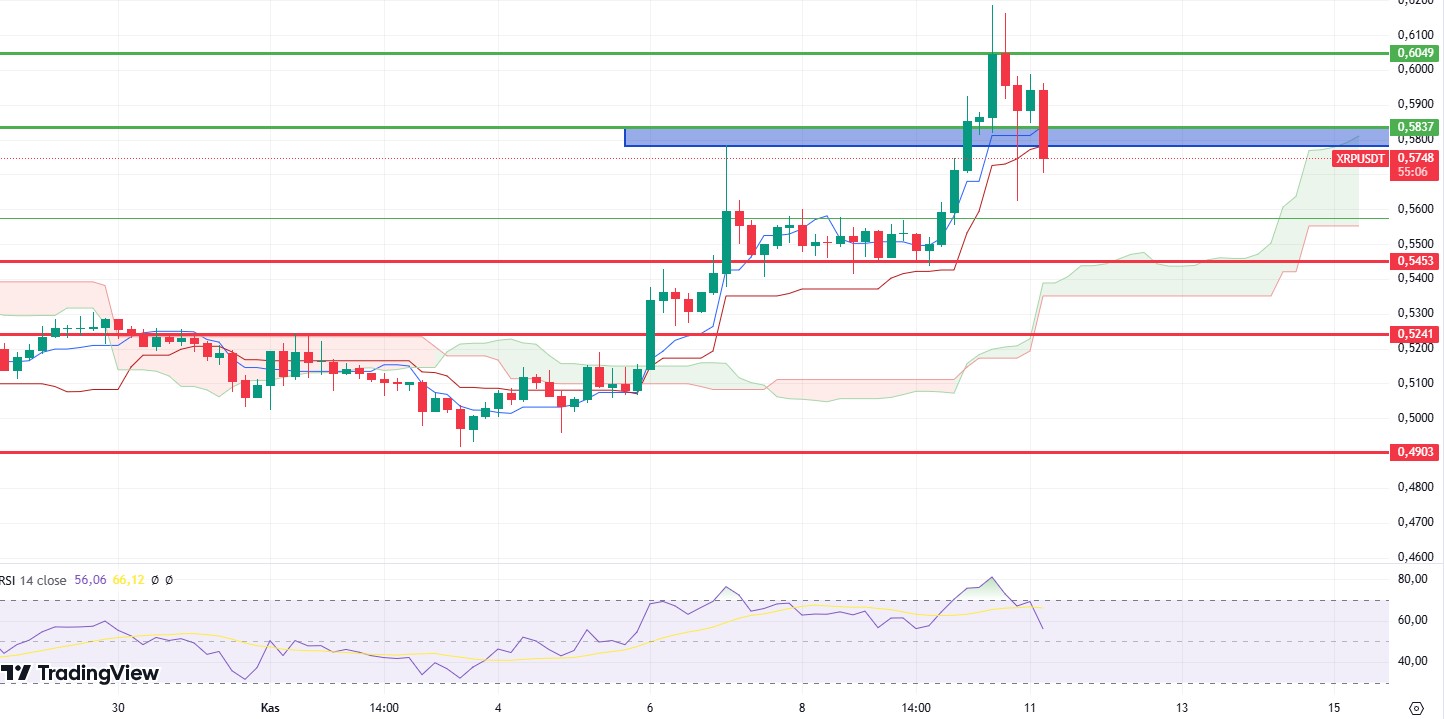
XRP, which is trying to exceed the 0.6049 region, which is also the fib (0.786) level with the momentum by exceeding important resistance levels with the rise of the market, has faced selling pressure from this region. For XRP, which lost the kijun and tenkan zones in the Ichimoku indicator with the decline it experienced, it is necessary to ensure persistence above the region indicated by the blue box on the chart in order to regain the positive scenario. Despite a potential positive divergence on the Relative Strength Index (RSI), it seems likely that the price will rebound quickly from the 0.5453 kumo cloud levels. Loss of the 0.5453 level may deepen the decline and cause pullbacks to the 0.5242 region.
Supports 0.5453 – 0.5241 – 0.4903
Resistances 0.5837 – 0.6049 – 0.6655
SOL/USDT
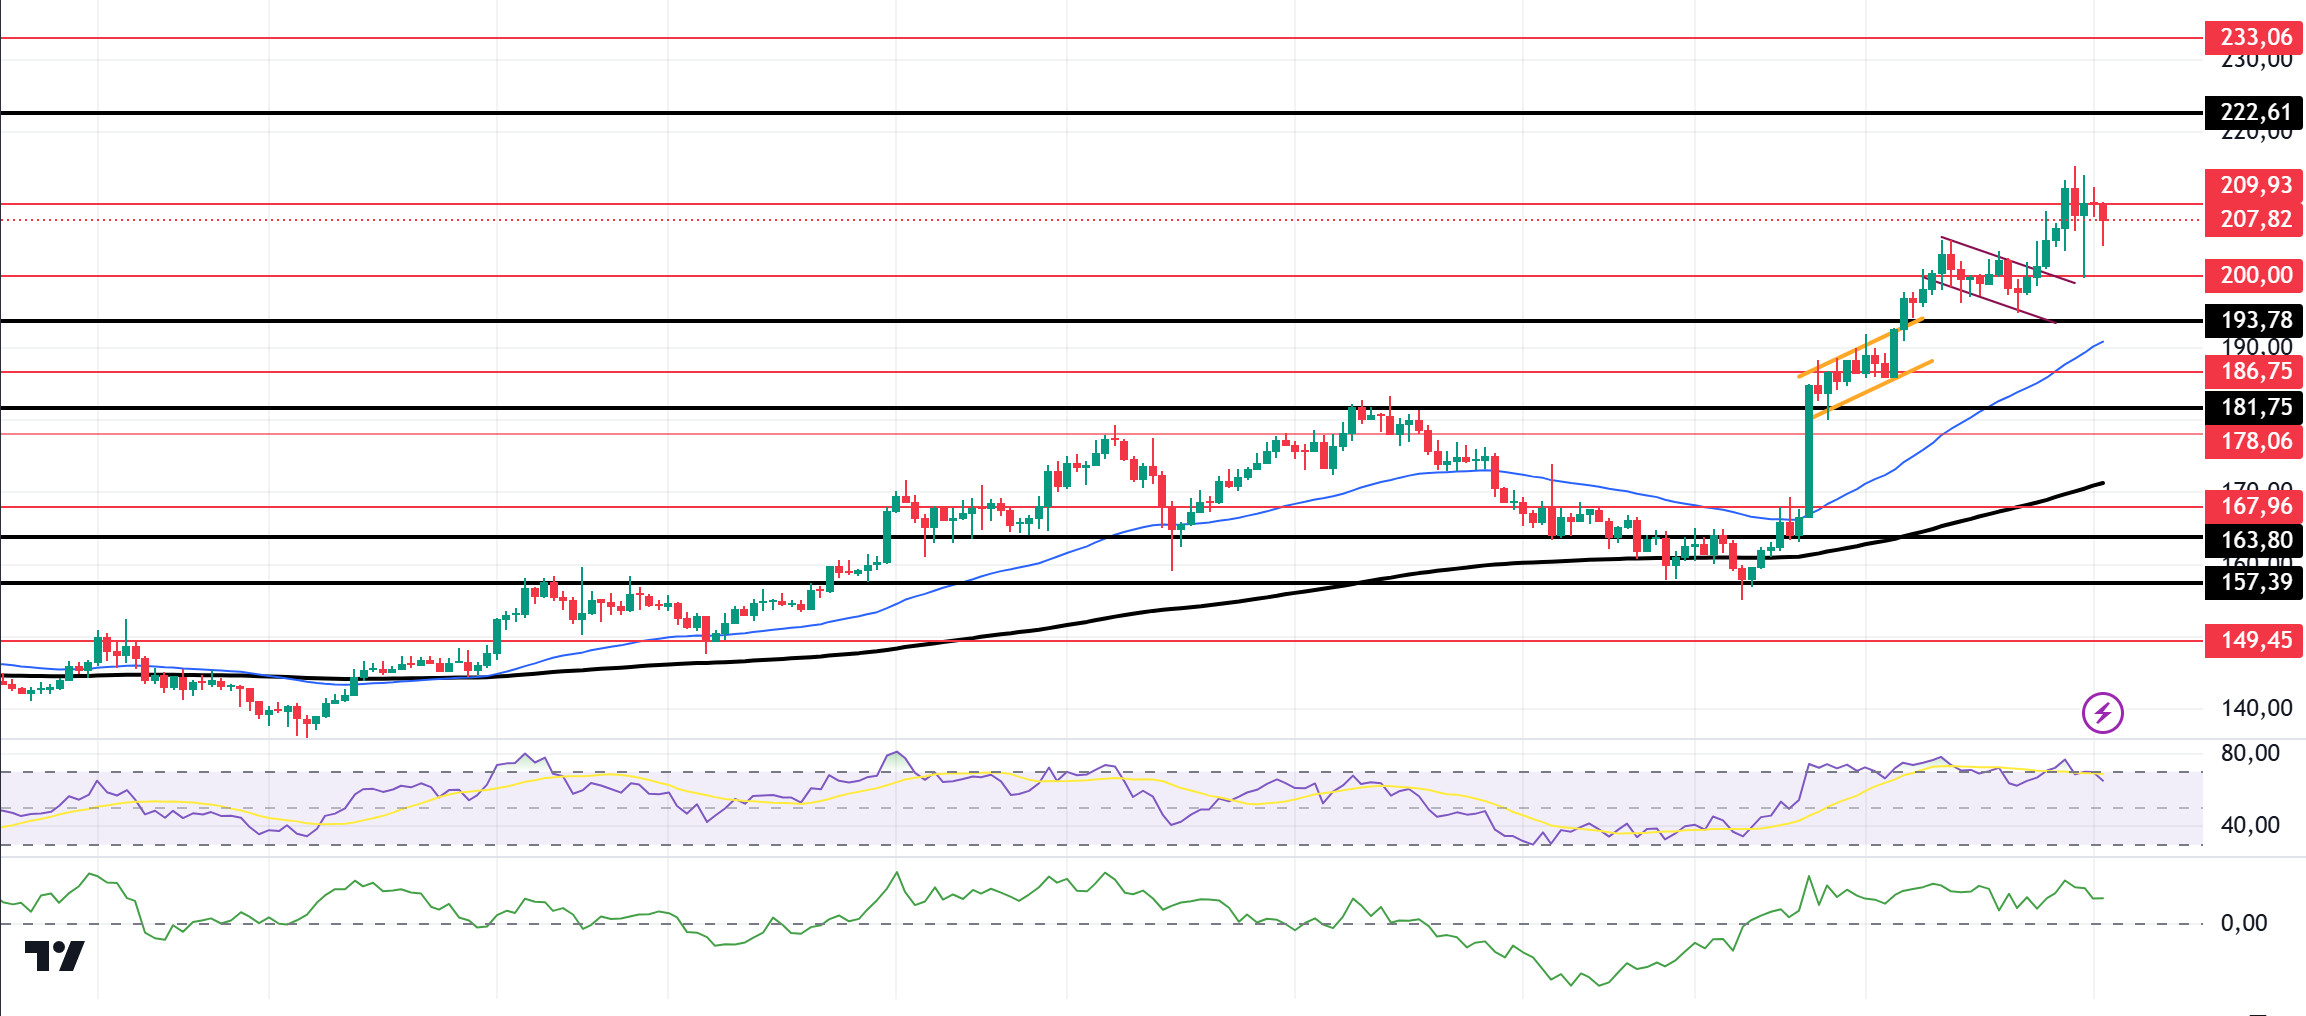
Even though the market in general is rising, SOL seems to have outperformed other competitors. This is partly because the Trump administration, possibly including the new SEC chairman, has raised the likelihood of spot Solana ETF approval. In the Solana ecosystem, the OI currently stands at about 22.5 million SOLs, or $4.22 billion, which is where it was last seen in December 2021, according to data from CoinGlass. In the last 7 days, $837.92 million worth of 184.3 short positions were classified. Technically, SOL started to exhibit horizontal movements. Although it has declined by 1.47% in the last 24 hours, it is priced at 207.82, the highest level since March. At the same time, it strongly broke the 193.78 level, which we call critical resistance, and ran it as a support level. In the 4-hour timeframe, the 50 EMA (Blue Line) continues to be above the 200 EMA (Black Line). This could mean that the uptrend will continue. However, the gap between the two averages has widened too much, creating a difference of 10%. This could cause pullbacks. At the same time, Relative Strength Index (RSI)14 is in the overbought zone, which may bring profit sales. However, when we examine the Chaikin Money Flow (CMF)20 indicator, although money inflows are positive, inflows have started to decline. The 222.61 level is a very strong resistance point in the uptrend driven by both macroeconomic conditions and innovations in the Solana ecosystem. If it rises above this level, the rise may continue strongly. In case of retracements due to possible macroeconomic reasons or profit sales, the 193.78 support level can be triggered again. If the price hits this support level, momentum may increase and a potential bullish opportunity may arise.
Supports 200.00 – 193.78 – 186.75
Resistances 209.93 – 222.61 – 233.06
ADA/USDT
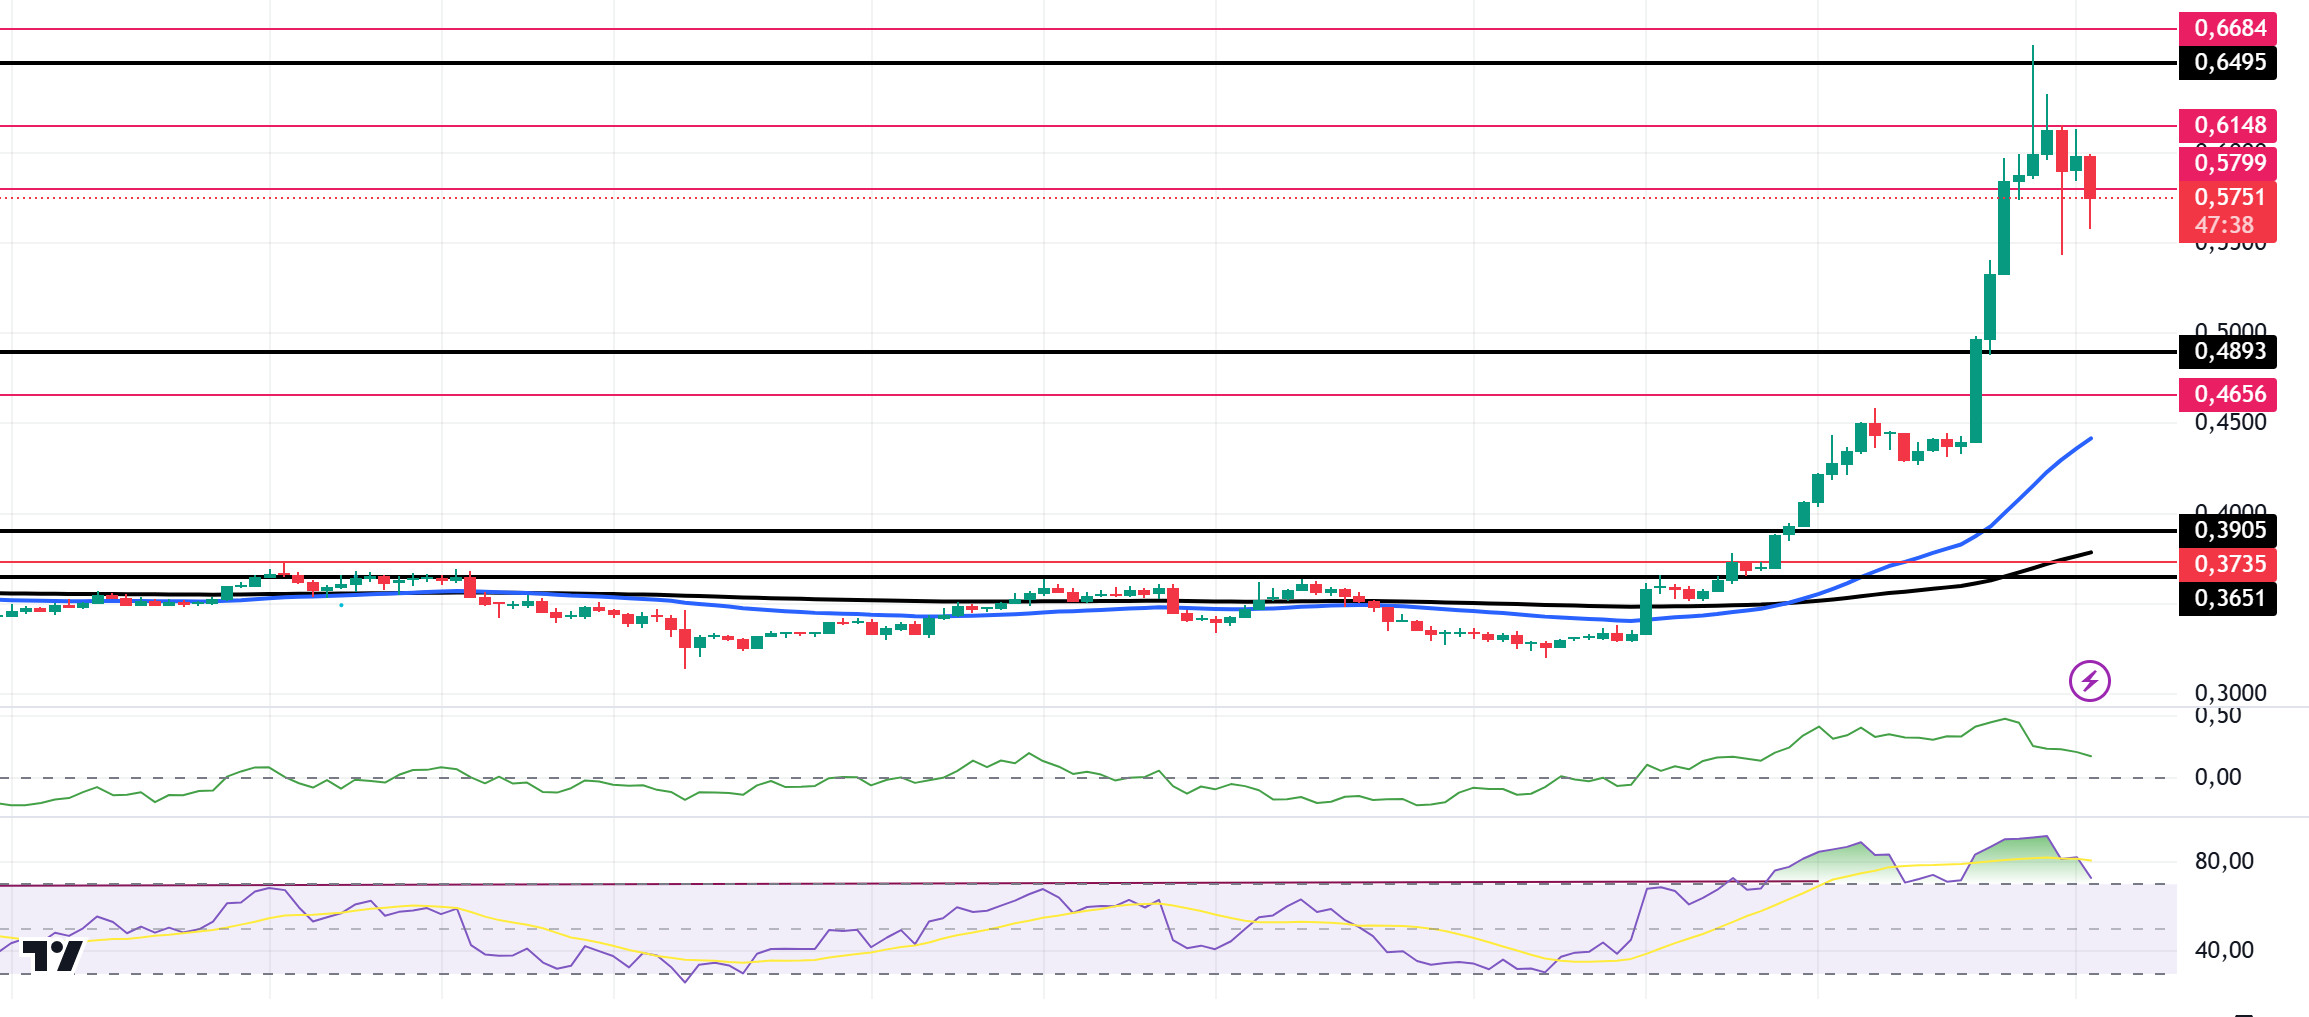
Trump’s election as president triggered a surge in cryptocurrency markets. One of the main reasons is that Cardano plans to work with the Trump Administration on crypto policy in 2025. “I’m going to spend a lot of time working with lawmakers in Washington, D.C.,” Charles Hoskinson said on Saturday. However, the Trump administration is expected to bring a crypto-friendly executive to head the SEC. In the Cardano ecosystem, it continued its upward momentum and swept liquidity. As of press time, Cardano has gained 72.45% in the last 7 days. Whale trading activity has also increased and large holders have traded over $11.5 billion on the Cardano network. Technically, the price is pricing above the 50 EMA (Blue Line) and 200 EMA (Black Line) on the 4-hour chart. However, the 50 EMA has moved above the 200 EMA. This shows us that the trend is bullish. At the same time, when we examine the Chaikin Money Flow (CMF)20 indicator, it is in positive territory but inflows have decreased. However, Relative Strength Index (RSI)14 is in the overbought zone, which may bring profit sales. Considering all this, it has made the 0.5799 level support, which works as a resistance. The support level of 0.4893 should be followed in the decline that will be experienced due to the macroeconomic data and negativities in the ecosystem or in the retracements brought by profit sales. It may be appropriate to buy when it comes to this price level. In the rises due to macroeconomic data or developments in the ecosystem, the 0.6495 level should be followed as a strong resistance. If it breaks this level, the rise may strengthen.
Supports 0.5799 – 0.4893 – 0.4656
Resistances 0.6148 – 0.6495 – 0.6684
LEGAL NOTICE
The investment information, comments and recommendations contained herein do not constitute investment advice. Investment advisory services are provided individually by authorized institutions taking into account the risk and return preferences of individuals. The comments and recommendations contained herein are of a general nature. These recommendations may not be suitable for your financial situation and risk and return preferences. Therefore, making an investment decision based solely on the information contained herein may not produce results in line with your expectations.


