BTC/USDT
Bitcoin left behind a historic week. Eyes were on the US elections in the week of developments that affected the market considerably. D.Trump, who came to the agenda with his promises about Bitcoin and the crypto market during his election campaign, became the 47th President of the USA. Immediately after this development, the FED’s 25 basis point interest rate cut brought new ATH levels in Bitcoin. In this process, the interest of institutional investors, especially BlackRock and Microstrategy, stood out.
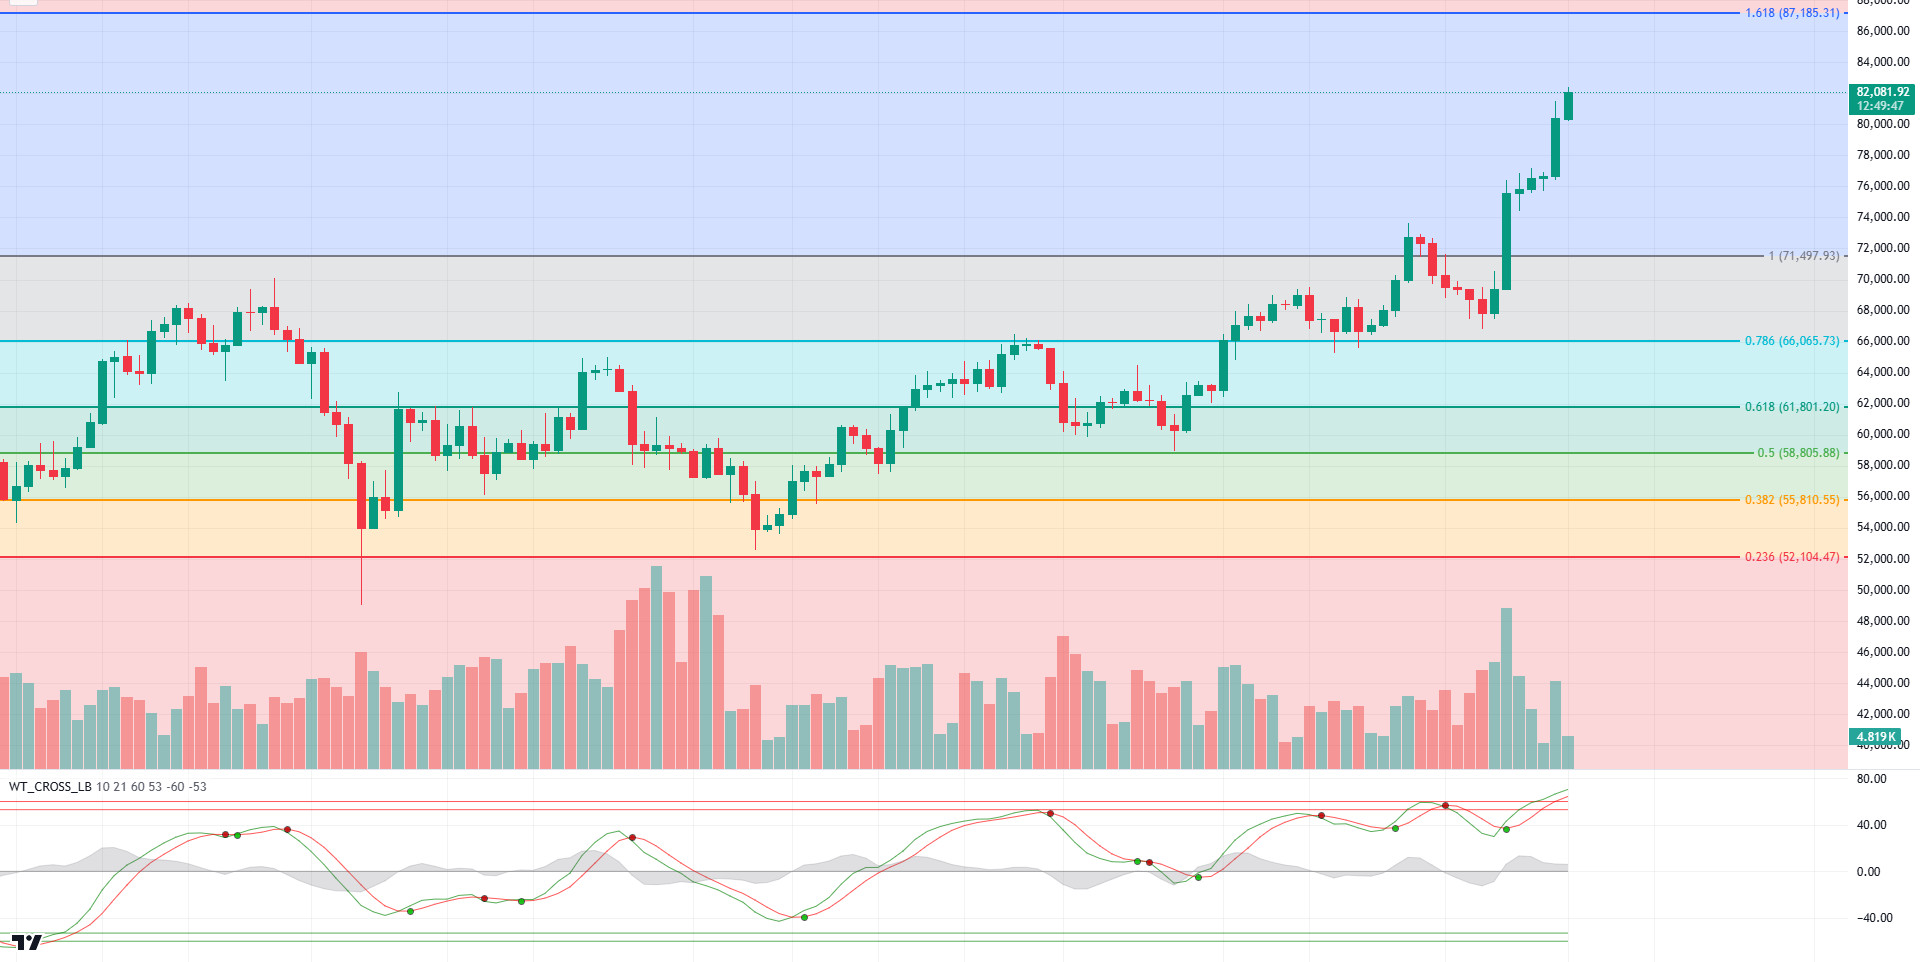
In BTC’s daily technical outlook, the previous all-time high (ATH) of 73,750 was tested, as the Fibonacci 1 (71,497) level we highlighted in the previous analysis was breached. The upside momentum boosted by upbeat fundamentals pushed BTC price to a new all-time high of 82,371. When we look at the technical oscillators, unlike the hourly charts, it moves in the overbought zone by maintaining the buy signal on the daily chart. In the continuation of the upward movement, the Fibonacci 1.618 (87,185) level may appear. Although optimistic developments continue to keep the price at its peak, we may witness pullbacks with occasional correction movements.
Supports 75,800 – 73,750 – 71,497
Resistances 81,858 – 83,000 – 85,000
ETH/USDT
With the victory of Donald Trump in the US presidential election, the rise in all risky markets has positively affected ETH, allowing it to overcome important resistance levels. With this rise, the increase in MVRV value may be one of the most important points to pay attention to. Looking at Ethereum’s past cycles, it is seen that the MVRV value has entered long-term bullish cycles with the MVRV value exceeding 1.25 levels. With this rise, the MVRV value, which exceeded this level and rose to 1.65 levels, shows that the rises may continue until 2.2 levels. On the other hand, when the ETH/BTC chart is analyzed, the loss of the 0.04010 level shows that Bitcoin may experience higher pricing and rises against Ethereum for a while. The regain of the specified level and the fall of Bitcoin dominance below the important support level of 58% may lead to an increase in demand for the altcoin market led by Ethereum.
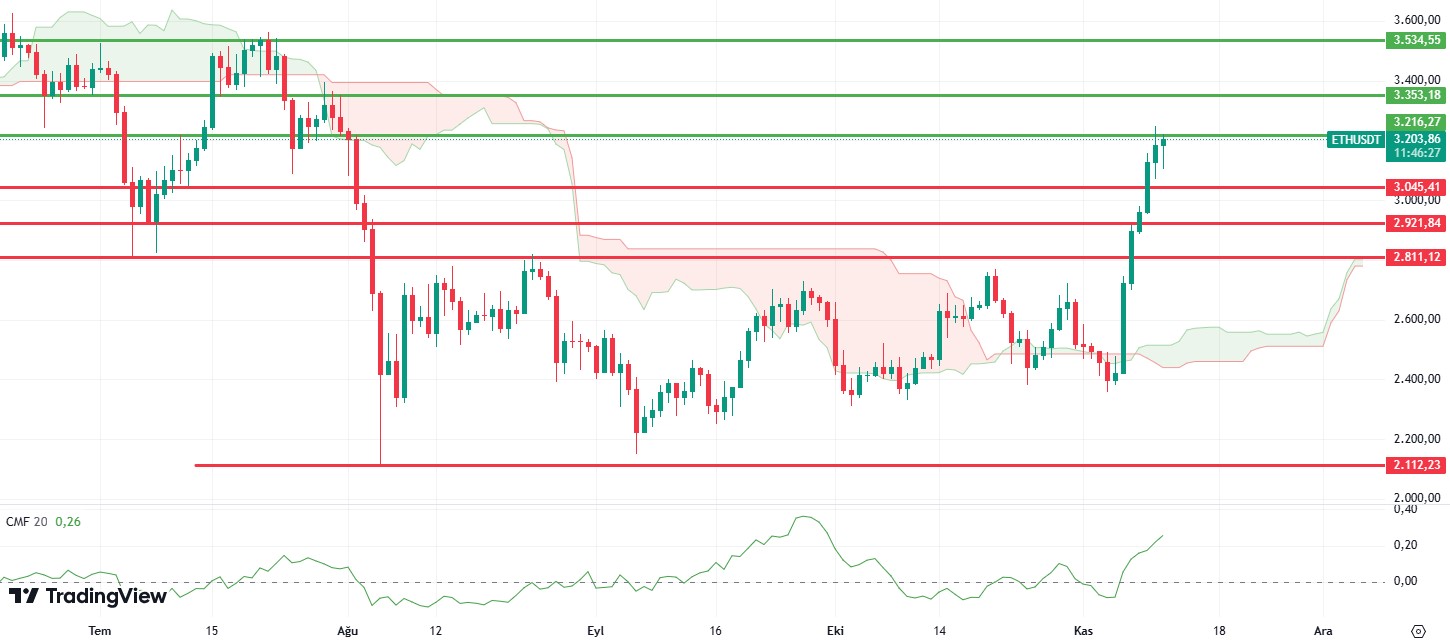
If we analyze ETH technically, one of the first details that catches the eye is the Chaikin Money Flow (CMF) value, which rose to +0.25. Considering that ETH is mostly supported by the spot side in Cumulative Volume Delta (CVD), it can be said that there is a positive cycle for the medium to long term.
On the other hand, both BTC dominance and the Relative Strength Index (RSI) value, which is in the overbought zone, may cause ETH to move sideways in the short term or a correction to 3.016 levels. Exceeding the 3.255 – 3.373 zone may accelerate the uptrend.
Supports 3,016 – 2,952 – 2,780
Resistances 3,255 – 3,373 – 3,558
XRP/USDT
Ripple broke the 0.5276 resistance with the recent rise and experienced a slight retracement by selling at 0.6188. For XRP, where the effects of the double peak and negative divergence on the Relative Strength Index (RSI) in the daily time interval are experienced, a re-test to the 0.5276 level or a continuation of the horizontal movement can be expected in the short term. With closures above 0.6526, we can see the continuation of the rises. Positive structures on Chaikin Money Flow (CMF) and momentum indicate that the rise may continue even after the possibility of a retest.
Supports 0.5276 – 0.4647 – 0.4087
Resistances 0.6526 – 0.7405 – 0.7990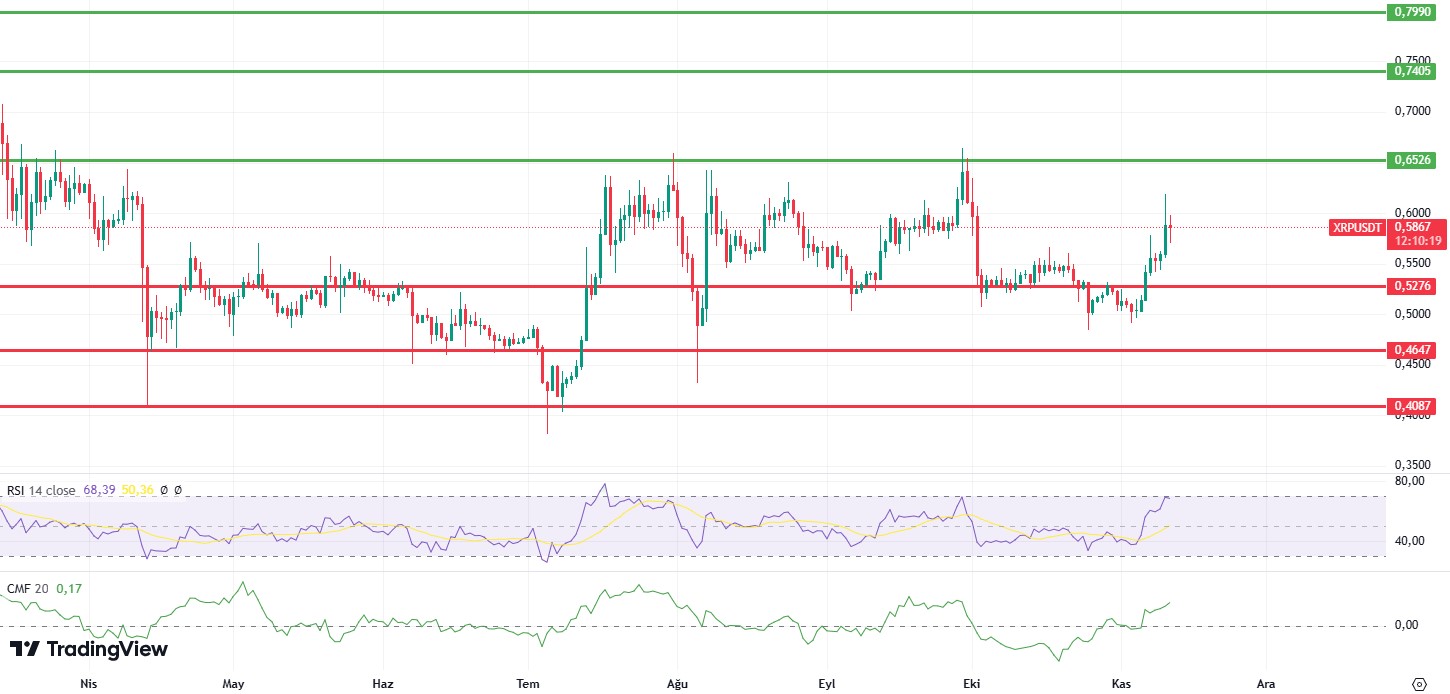
SOL/USDT
In the US elections last week, Trump surpassed 270 delegates and became president according to unofficial results. After these results, the cryptocurrency market started to rise. Pro-crypto promises were at the center of Donald Trump’s 2024 campaign, but it remains to be seen what changes the crypto community will face now that Trump is back in office. It’s worth remembering that in 2021, Trump expressed a disparaging view of Bitcoin, telling Fox Business that the world’s first cryptocurrency “looks like a scam”. After these results, the cryptocurrency market reacted very positively, increasing by 22.81% last week to reach a market capitalization of 2.74 trillion. The FED cut interest rates by 25 basis points to 4.50-4.75%. Powell said that risks to the targets remain “roughly balanced” and that they need to be cautious against inflationary pressures and will do their best not to deviate from the 2% target. Another important development was that US jobless claims, which were announced as 218,000, showed a moderate increase, coming in at 221,000. Next week, inflation data from the US will be important.
In the Solana ecosystem, it experienced a significant increase in on-chain transfer volume, reaching a peak of approximately $224 billion in just one day. On the other hand, NFT overtook Ethereum in the royalties market, gaining a 51% share. Beyond market dominance, Solana’s success in the NFT sector will increase demand for SOL and bolster investor confidence. The chain’s TVL increased by over $7.48 billion. The Open Interest (OI) ratio has also increased significantly. Currently, OI has reached its highest level since April 1 at $4.44 billion.
The memecoin market on Solana has reached a surprising milestone, with the total market capitalization jumping a sharp 30% last week to an all-time high of $12 billion. Launched in January 2024, the Pump.fun platform quickly became a launchpad for meme coins on the blockchain. Since its inception, the platform has attracted a lot of attention and the total market capitalization of coins created on the Pump.fun ecosystem recently reached $3 billion, an all-time high for the ecosystem. So far, nearly 3 million projects have been launched on the platform. This explains the rise in the ecosystem’s volume. Next week, inflation data from the US will be important.
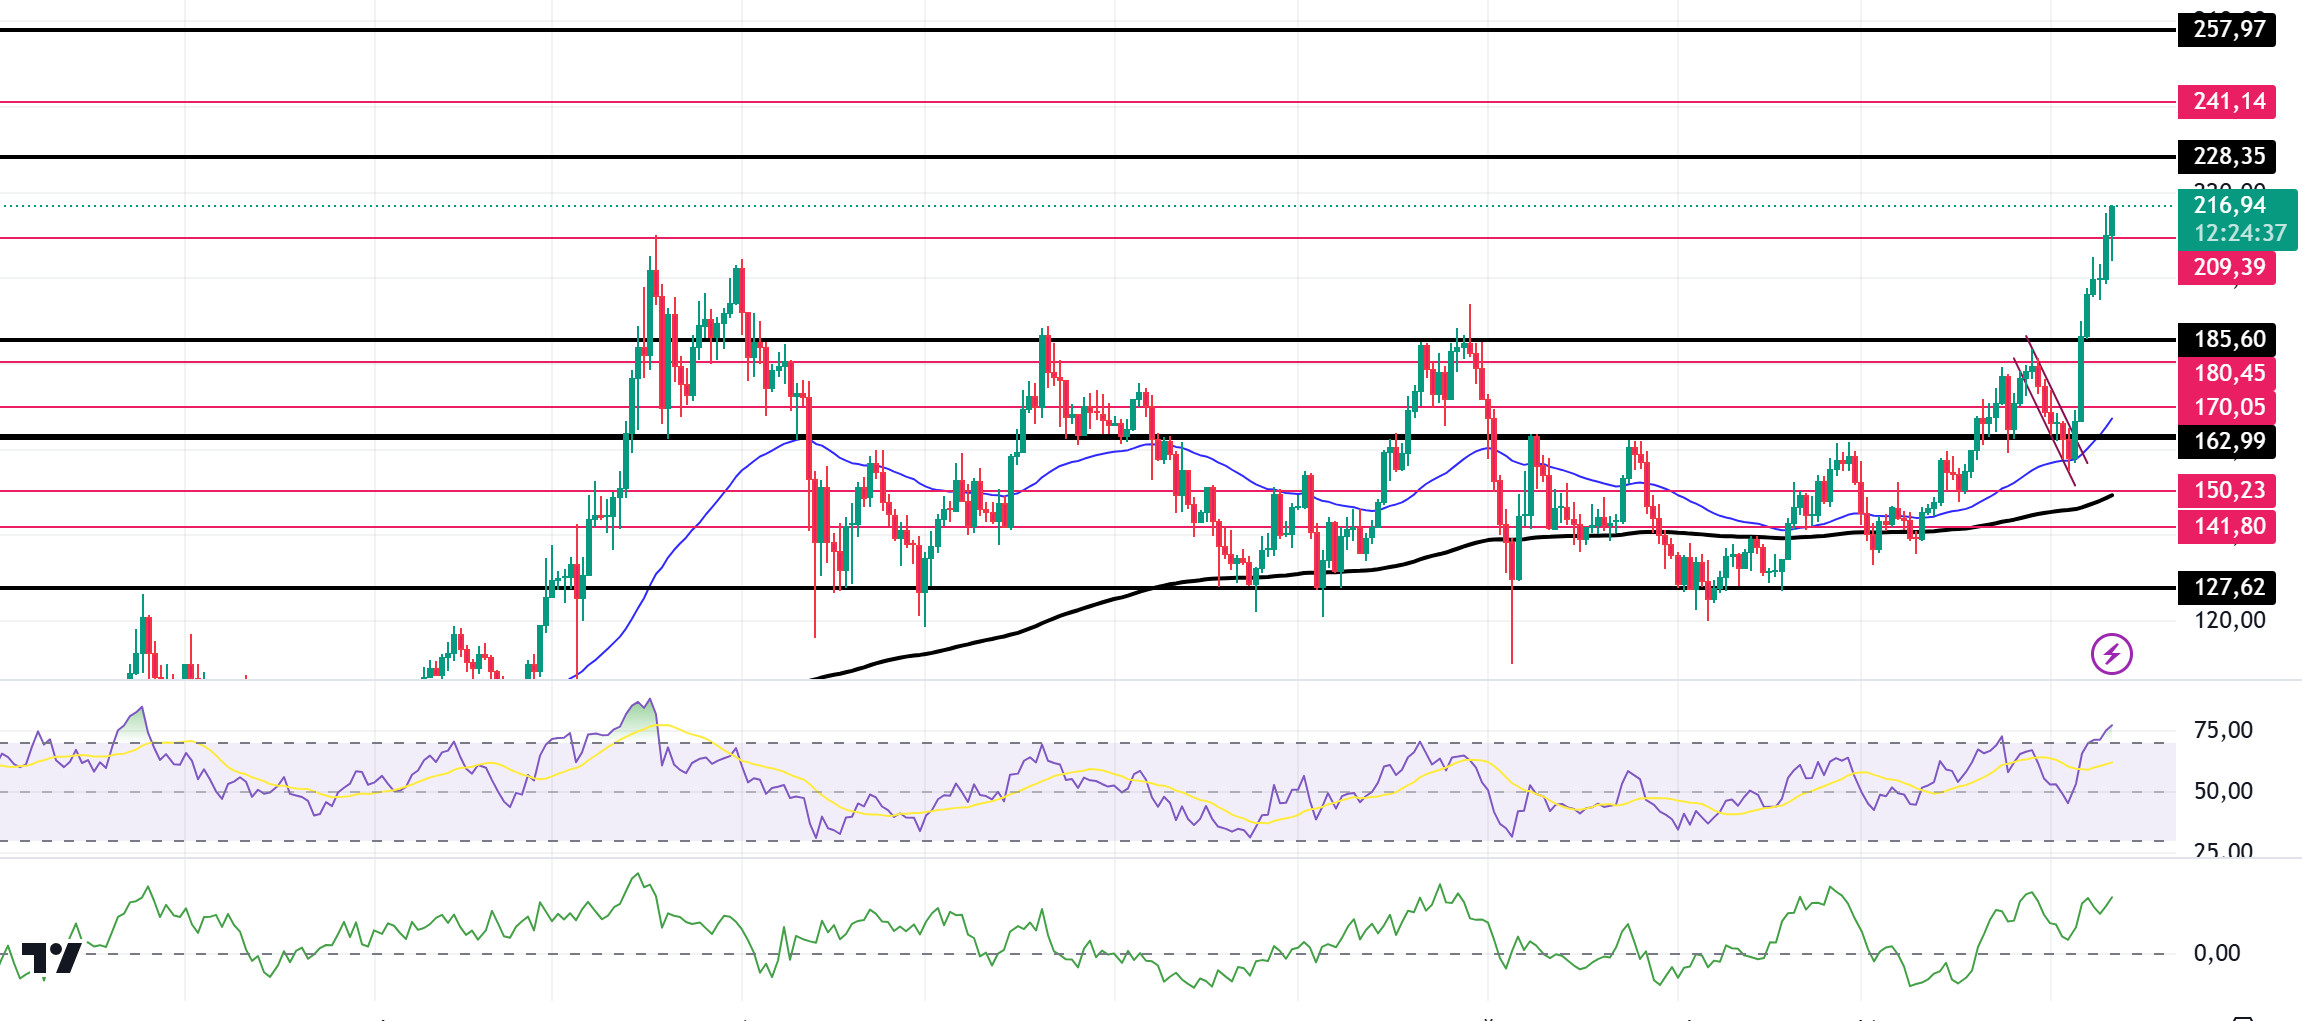
Technically, SOL is priced at 215.45, up 5.06% in the last 24 hours. On our daily chart, the 50 EMA (Blue Line) continues to accelerate upwards from the 200 EMA (Black Line). This shows that the trend is bullish. The 185.60 level, which is a strong resistance, is working as a support after being broken by a voluminous candle last week. This is an important support level for the continuation of the uptrend. At the same time, the Relative Strength Index (RSI) is at 14 overbought levels. This raises the possibility of a price pullback. However, when we analyze the Chaikin Money Flow (CMF)20 indicator, inflows are positive and inflows continue to increase. If the positive results in macroeconomic data and positive developments in the ecosystem continue, it may test the first major resistance level of 228.35. In case of declines due to political developments or negative news in the Solana ecosystem, the 185.60 level can be followed and a buying point can be determined.
Supports 209.39 – 185.60 – 180.45
Resistances 228.35 – 241.14 – 257.97
ADA/USDT
In the US elections last week, Trump surpassed 270 delegates and became president according to unofficial results. After these results, the cryptocurrency market started to rise. Pro-crypto promises were at the center of Donald Trump’s 2024 campaign, but it remains to be seen what changes the crypto community will face now that Trump is back in office. It’s worth remembering that in 2021, Trump expressed a disparaging view of Bitcoin, telling Fox Business that the world’s first cryptocurrency “looks like a scam”. After these results, the cryptocurrency market reacted very positively, increasing by 22.81% last week to reach a market capitalization of 2.74 trillion. The FED cut interest rates by 25 basis points to 4.50-4.75%. Powell said that risks to the targets remain “roughly balanced” and that they need to be cautious against inflationary pressures and will do their best not to deviate from the 2% target. Another important development was that US jobless claims, which were announced as 218,000, showed a moderate increase, coming in at 221,000. Next week, inflation data from the US will be important.
In the Cardano ecosystem, the Foundation plans to sell $500 million of ADA. The community is calling for balanced budgeting for stability amid market shifts. It is also divided over Charles Hoskinson amid allegations of ‘Cardano cancer’. In a briefing video shared by Plutus Staking, Hoskinson emphasized his “significant financial commitment to the development of ADA. He invested significant resources early on to fund development contracts. He stated that his total personal investment in Cardano is now $450 million. This investment has been crucial to the growth of the blockchain since its inception.” Funding rates have also increased significantly on the chain. At the time of writing, this rate is now 0.0217%. This shows that derivatives traders are increasingly opening new long positions in Cardano. On November 6, 18.53 million tokens were unlocked on ADA. Meanwhile, it continues to prepare for the second phase of Chang, a crucial upgrade designed to implement the latest features of minimum viable on-chain governance. The surge began with the release of Node 10.1, a major upgrade that introduces new governance capabilities and prepares the network for the upcoming Chang 2 hard fork. Node 10.1.1 is the first mainnet node to support the Chang 2 cross-period hard fork, a crucial step in Cardano’s governance evolution. The release also introduces advanced authorization options, allowing share pool operators (SPOs) to authorize predefined voting options. These developments have raised optimism that Cardano’s price could rise in the coming weeks as the network consolidates its infrastructure and prepares for new functionalities. Meanwhile, Plutus scripts increased by 3,358 to a total of 91,698. The total number of transactions increased by 0.98 million compared to last month, reaching a total of 97.92 million. In the Cardano ecosystem, ADA’s Open Interest data shows that it rose from $217.71 million on Wednesday to $329.01 million on Friday, the highest level since mid-April. This steady increase in address activity and whale trades suggests that market confidence is growing, with potential FOMO (Fear of Missing Out) building among investors. As Cardano rides this bullish wave, the community is watching closely to see if the momentum will continue. According to the on-chain data provider, the number of ADA transactions exceeding $100,000 per day has skyrocketed. On Thursday, 697 of these transactions took place. All these data explained the rise.
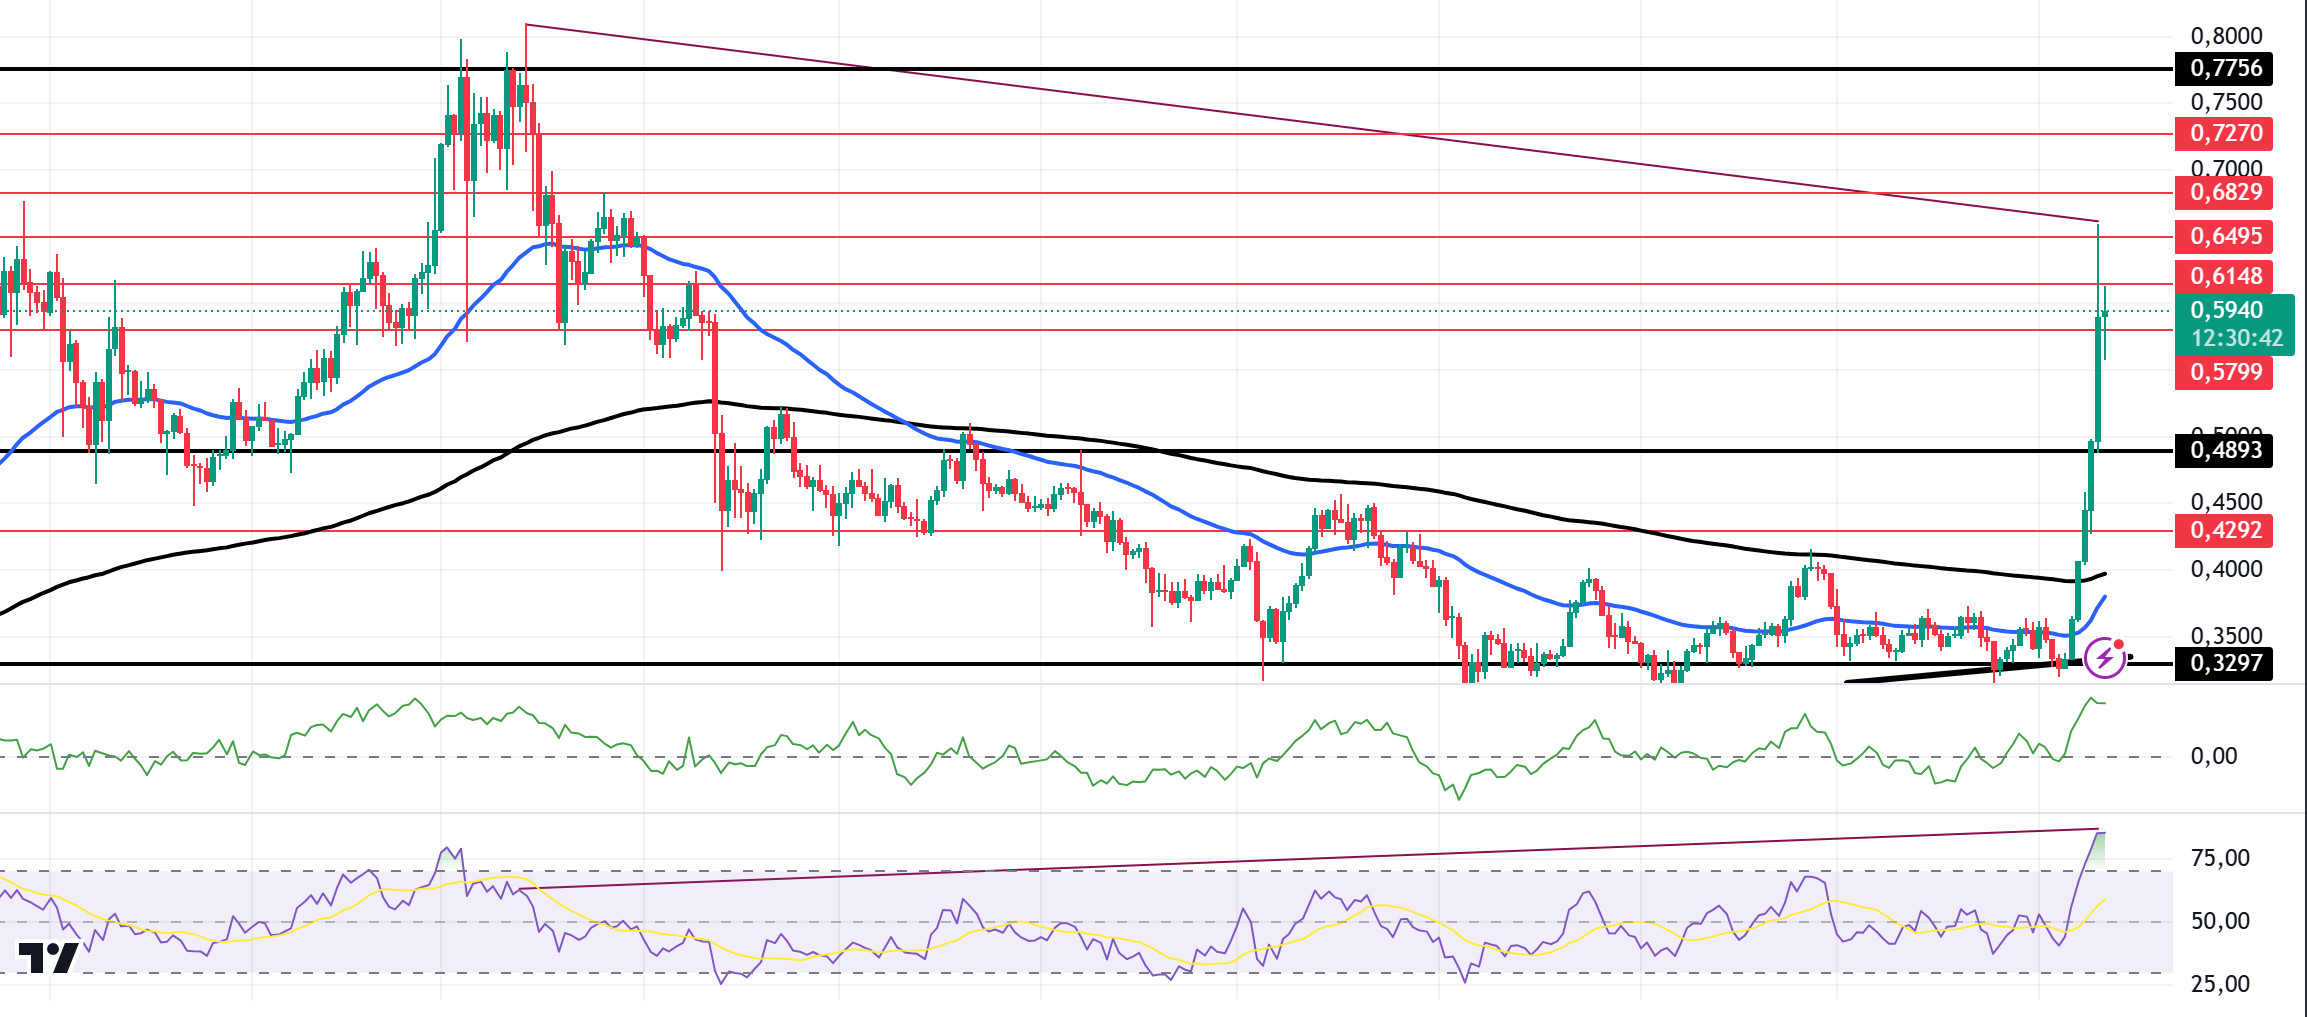
Technically, ADA is priced at 0.5917, up 1.70% in the last 24 hours. Looking at the daily chart, the 50 EMA (Blue Line) remains below the 200 EMA (Black Line), but the difference between the two averages has narrowed a lot. This signals that it may move from a bear market to a bull market. When we look at the liquidity zones of ADA, there is an important liquidity place at $ 0.6460. When we look at the Chaikin Money Flow (CMF)20 indicator, money inflows started to decrease, albeit positive. Relative Strength Index (RSI)14 is in the overbought zone. At the same time, divergence attracts attention. This may bring profit sales. In case of possible macroeconomic conditions and negative developments in the Cardano ecosystem and the continuation of the downtrend, 0.4893 can be followed as a strong support. In case of a continuation of the uptrend, 0.7756 should be followed as a strong resistance.
Supports 0.5799 – 0.4893 – 0.4292
Resistances: 0.6148 – 0.6495 – 0.6829
DOT/USDT
Polkadot Blockchain Academy aims to give a new impetus to Web3 education with the online PBA-X program starting in 2025. With Hyperbridge launching its main network on Polkadot, the possibilities for secure and scalable cross-chain communication have been expanded. A partnership with SP Negócios in São Paulo will support blockchain education and innovative solutions. Also, at the Sub0 Reset event, Gavin Wood announced that Polkadot’s JAM protocol will make significant strides in Web3 scalability. These initiatives could reinforce Polkadot’s leadership in technology and education, while increasing interest in the ecosystem and attracting more developers to the project.
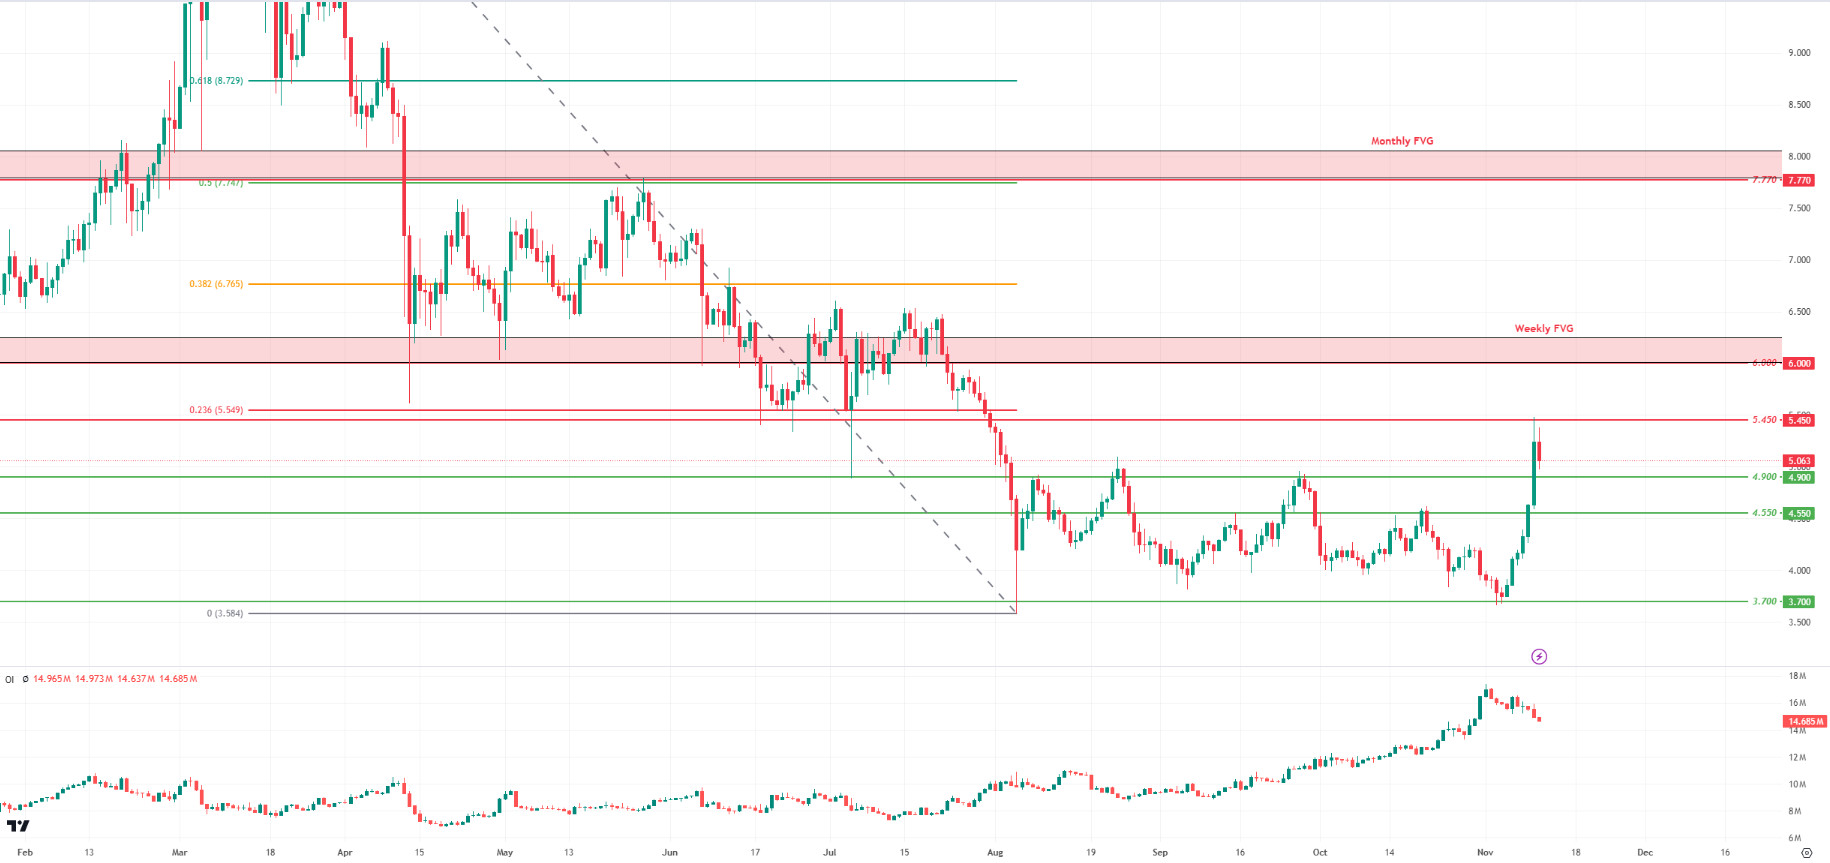
When we analyze Polkadot (DOT) technically, it managed to break through the $81,900 level, a psychological resistance, as Bitcoin reached the $5,450 level. However, it can be observed from the Open Interest (OI) oscillator that DOT, which retreated from the 5,450 level, experienced a decrease in open positions in this region. This suggests that the 5,450 level can be considered as a strong resistance. If the buyer appetite continues and the price breaks the selling pressure at 5,450, the next target is likely to be the $6 level. This level may constitute an important resistance point as both the Fibonacci 0.236 level and the weekly Fair Value Gap (FVG) area. On the other hand, if the price fails to break through the 5,450 level, a retracement towards the support area at 4,900 could be possible.
Supports 4,900 – 4,550 – 3,700
Resistances 5.450 – 6.000 – 7.770
LEGAL NOTICE
The investment information, comments and recommendations contained in this document do not constitute investment advisory services. Investment advisory services are provided by authorized institutions on a personal basis, taking into account the risk and return preferences of individuals. The comments and recommendations contained in this document are of a general type. These recommendations may not be suitable for your financial situation and risk and return preferences. Therefore, making an investment decision based solely on the information contained in this document may not result in results that are in line with your expectations.


