MARKET SUMMARY
Latest Situation in Crypto
| Assets | Last Price | 24h Change | Dominance | Market Cap |
|---|---|---|---|---|
| BTC | 88,173.90 | -1.41% | 59.84% | 1,75 T |
| ETH | 3,065.51 | -3.72% | 12.65% | 369,11 B |
| SOLANA | 210.03 | -3.00% | 3.40% | 99,17 B |
| DOGE | 0.3696 | -4.95% | 1.86% | 54,34 B |
| XRP | 0.8017 | 16.45% | 1.56% | 45,48 B |
| CARDANO | 0.5939 | 3.95% | 0.71% | 20,85 B |
| TRX | 0.1789 | -0.31% | 0.53% | 15,46 B |
| SHIB | 0.00002374 | -7.61% | 0.48% | 14,01 B |
| AVAX | 31.86 | -4.19% | 0.45% | 13,00 B |
| LINK | 13.24 | -1.53% | 0.28% | 8,30 B |
| DOT | 4.865 | -3.91% | 0.25% | 7,40 B |
*Prepared on 11.14.2024 at 13:30 (UTC)
WHAT’S LEFT BEHIND
Powell’s Falcon Speech
In his latest speech, Federal Reserve Chairman Jerome Powell said that the Federal Reserve is in no rush to cut interest rates in the context of a strong economy, a hawkish statement that quickly sparked turmoil in the global market. Following Powell’s speech, US stocks closed near intraday lows, while the US dollar rose sharply along with US Treasury yields and the ICE US Dollar Index hit a one-year high. Investors lowered their expectations for the probability of a Fed rate cut in December to around 50% from 80% the previous day, in stark contrast to the CPI data.
A Hard Correction in the Crypto Market
Bitcoin fell as low as $87,000, while major cryptocurrencies such as Ethereum and Solana also declined. However, XRP stood out, rising 18%, while Hedera (HBAR) was among the assets that moved positively.
Saylor: Bitcoin Reserve Could Reduce National Debt
Michael Saylor, CEO of MicroStrategy, stated that the creation of a strategic Bitcoin reserve by the US could reduce the national debt by 45%. According to Saylor, this step could make a significant contribution to the US economy.
Big Exits in Bitcoin ETFs
On November 14, US spot Bitcoin and Ethereum ETFs saw outflows of $400.7 million. These outflows caused Bitcoin to fall 2% to $88,200 and Ethereum to fall below $3,100.
HIGHLIGHTS OF THE DAY
Important Economic Calender Data
| Time | News | Expectation | Previous |
|---|---|---|---|
| – | eCash (XEC) Upgrade Regular Heartbeat Upgrade | – | – |
| – | Starknet (STRK) Token Unlock – Starknet unlocks 64 million tokens | – | – |
| – | Enjin Coin (ENJ) Competition Timeless Tramyarus Multiverse Quest | – | – |
| 13:30 | US Core Retail Sales (MoM) (Oct) | 0.3% | 0.5% |
| 13:30 | US Retail Sales (MoM) (Oct) | 0.3% | 0.4% |
| 13:30 | US NY Empire State Manufacturing Index (Nov) | -0.3 | -11.90 |
| 14:00 | FOMC Member Collins Speaks | – | – |
| 18:15 | FOMC Member Williams Speaks | – | – |
INFORMATION
*The calendar is based on UTC (Coordinated Universal Time) time zone. The economic calendar content on the relevant page is obtained from reliable news and data providers. The news in the economic calendar content, the date and time of the announcement of the news, possible changes in the previous, expectations and announced figures are made by the data provider institutions. Darkex cannot be held responsible for possible changes that may arise from similar situations.
MARKET COMPASS
The agenda of the US, the world’s largest economy, continues to determine asset prices. Yesterday, the cautious attitude in the markets increased following the statements of the country’s Federal Reserve Chairman Powell, which included the message that they would not be in a hurry to cut interest rates. While retreats were observed in stock market indices and digital assets, albeit in different tones, the dollar continued to maintain its strength. The upbeat sentiment coming from China this morning does not seem to have been enough to increase investors’ risk appetite and we can say that the markets are in “cautious mode” for now.
US macro indicators and the statements of the Federal Open Market Committee (FOMC) members will be monitored later in the day. Prior to Powell’s remarks, the probability of a 25 basis points rate cut, which was above 80% according to the CME FedWatch Tool, has since fallen to around 60%. Today, especially October retail sales data may have an impact on the markets after FOMC officials emphasized that they will continue to monitor economic data. While higher-than-expected data may increase the pressure on digital assets by reinforcing expectations that the FED will not be hasty in rate cuts, numbers that do not meet expectations may have the opposite effect.
From the short term to the big picture.
The victory of former President Trump, one of the main pillars of our bullish expectation for the long-term outlook in digital assets, produced a result in line with our forecasts. The continuation of the Fed’s rate-cutting cycle (albeit with cautious messages from Powell…) and the inflows into BTC ETFs, indicating increased institutional investor interest (in addition to MicroStrategy’s BTC purchases, Microsoft starting to consider a purchase…), support our upside forecast for the big picture for now.
In the short term, given the nature of the market and pricing behavior, we think it would not be surprising to see occasional respite or pullbacks in digital assets. At this point, it is worth reiterating that fundamental dynamics remain bullish. While Bitcoin, the largest digital currency, has extended its record highs several times, which may encourage buyers to take new, upside positions, we will watch this group struggle with the masses who may want to take profit realizations. Volatility is likely to increase during this struggle.
TECHNICAL ANALYSIS
BTC/USDT
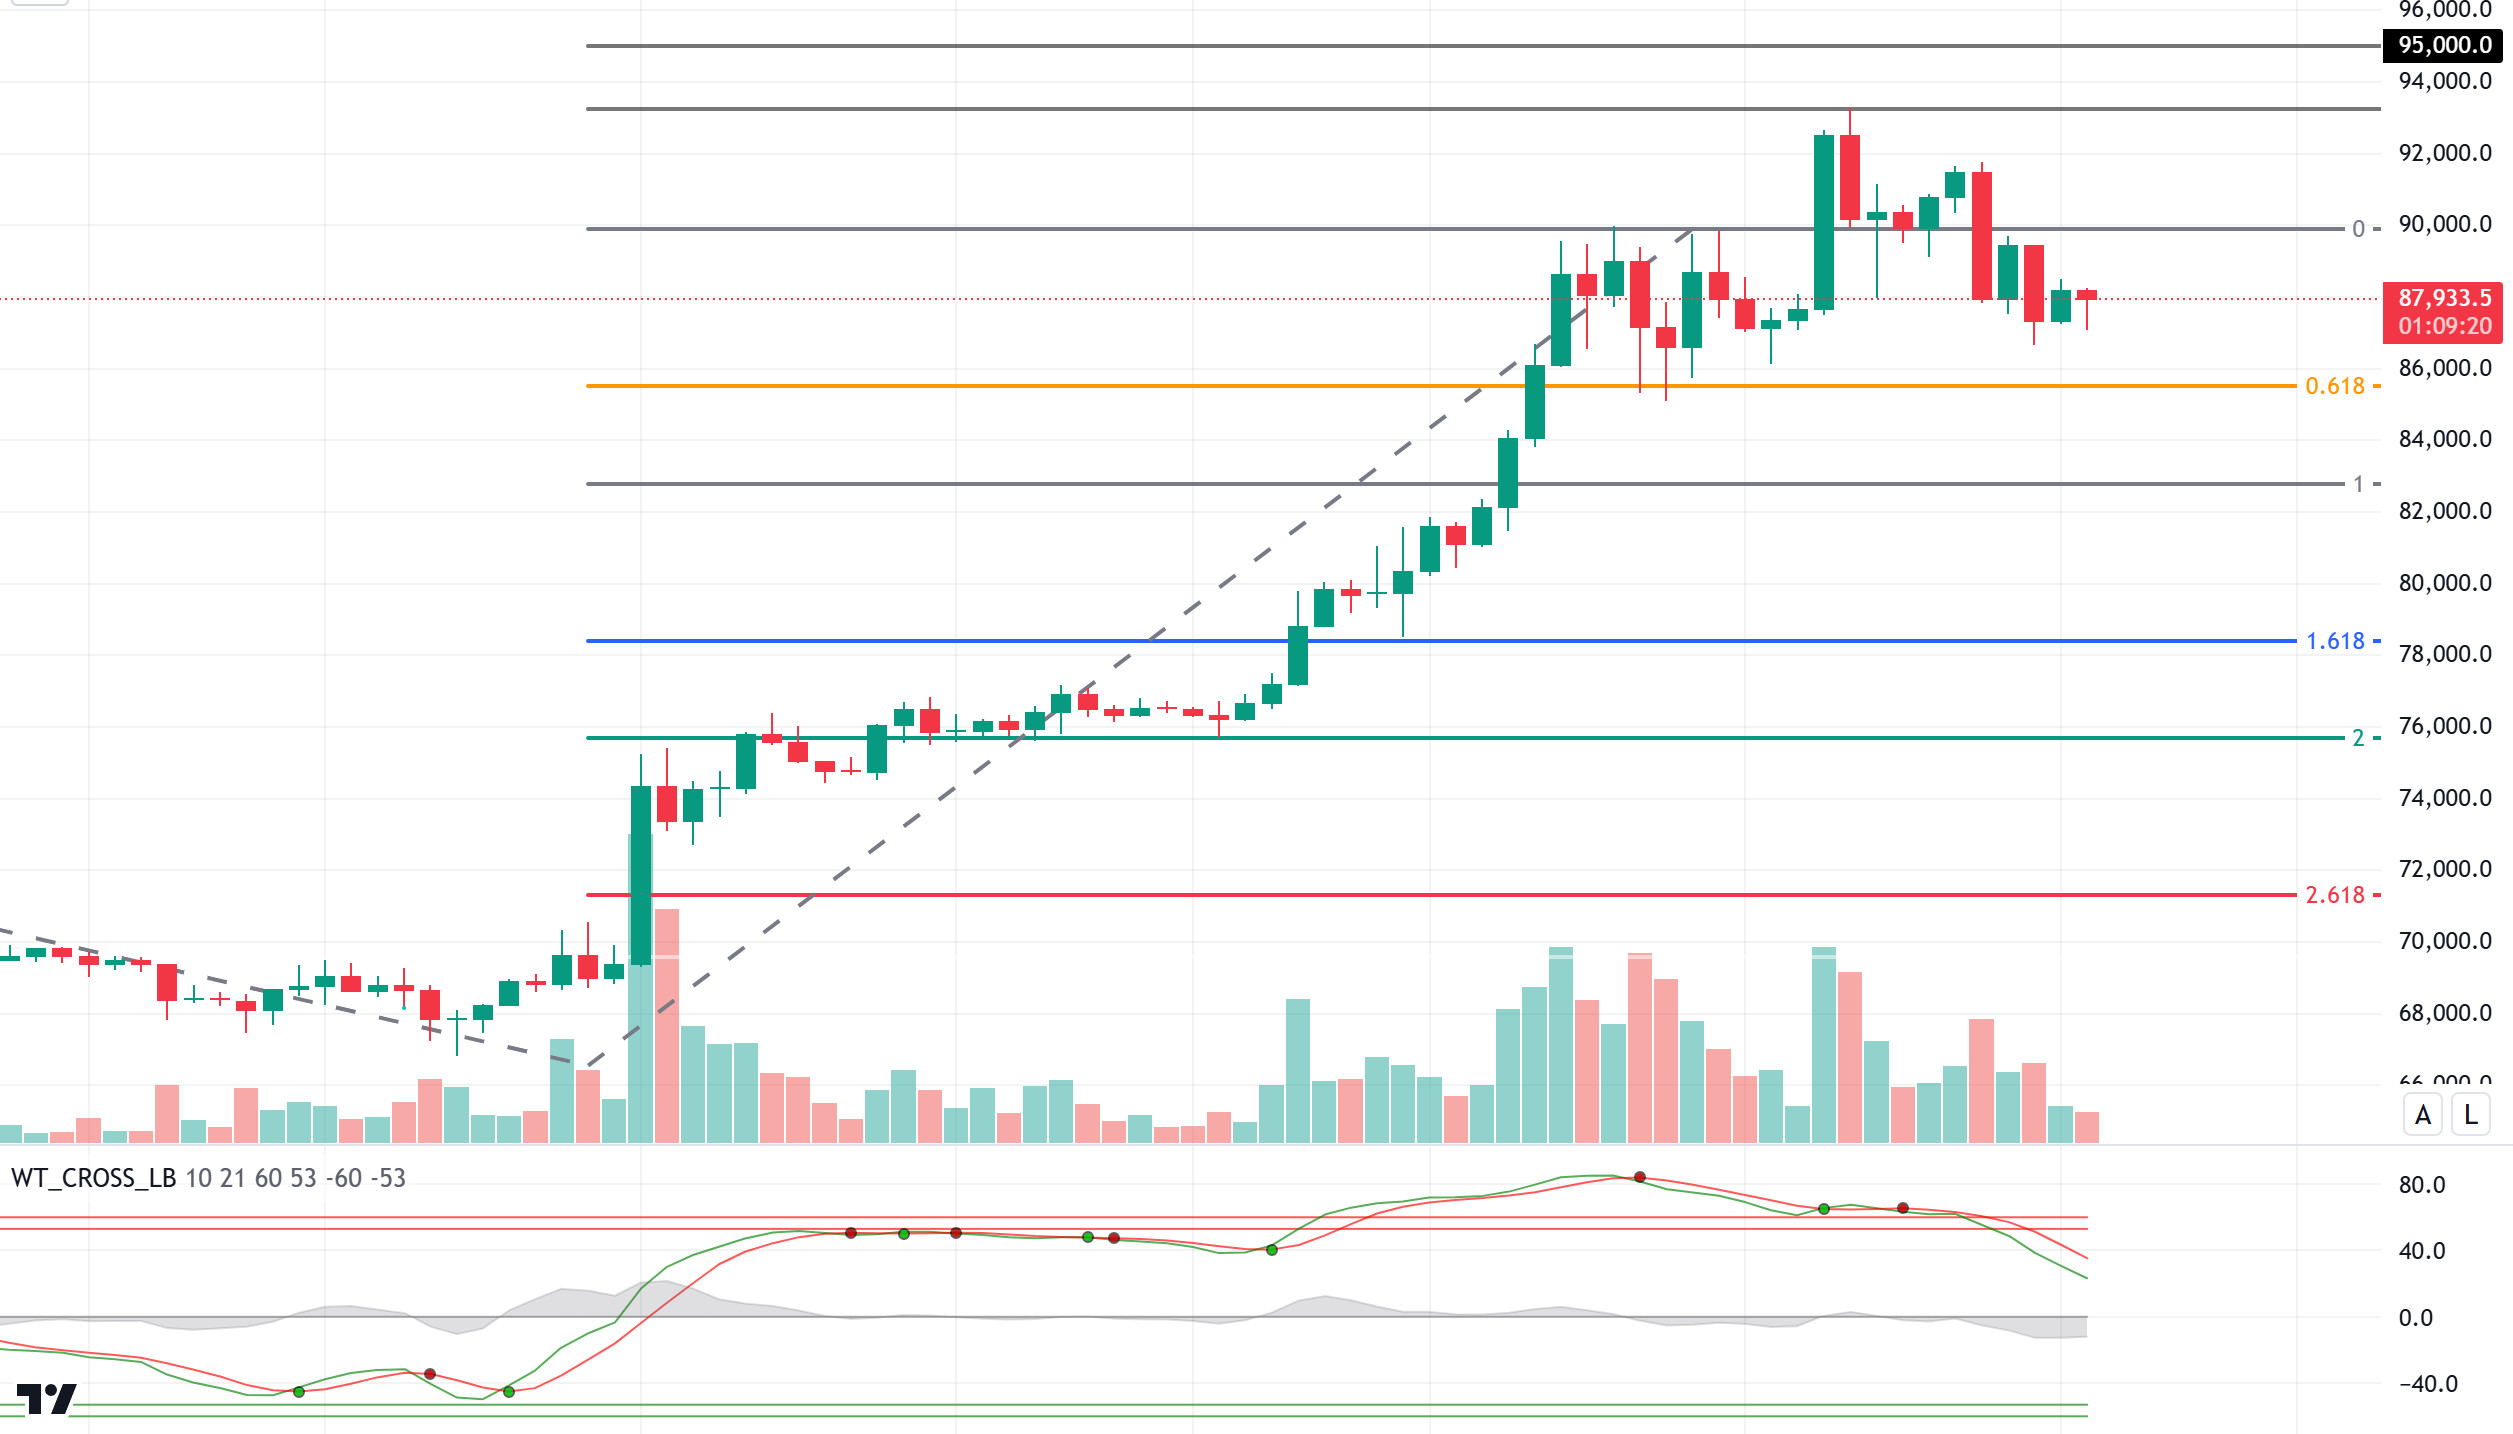
Fed Chairman Jerome Powell gave a hawkish message by stating that there would be no rush to cut interest rates despite the strong economic outlook. This statement caused a wave of selling in global markets; US stocks fell while the dollar and treasury yields rose. Bitcoin also lost value with this effect, falling below $87,000. Outflows from US spot ETFs broke a six-day streak of net inflows, while miners transferred 25,000 BTC to exchanges in recent days, raising expectations of a new wave of selling among investors.
With all these developments, BTC, which could not maintain its upward momentum in the technical outlook, tested below the 87,000 level with a decline below the 90,000 level. The wave trend, which is our technical oscillator, has turned its direction down with the sell signal it has been giving from the overbought zone for a long time. In case the correction deepens, we will follow the Fibonacci 0.618 (85,500) support level. In the continuation of positive developments on the US President D.Trump side, the 90,000 level in BTC is seen as a critical threshold.
Supports 85,500 – 83,000 – 80,000
Resistances 90,000 – 93,000 – 95,000
ETH/USDT
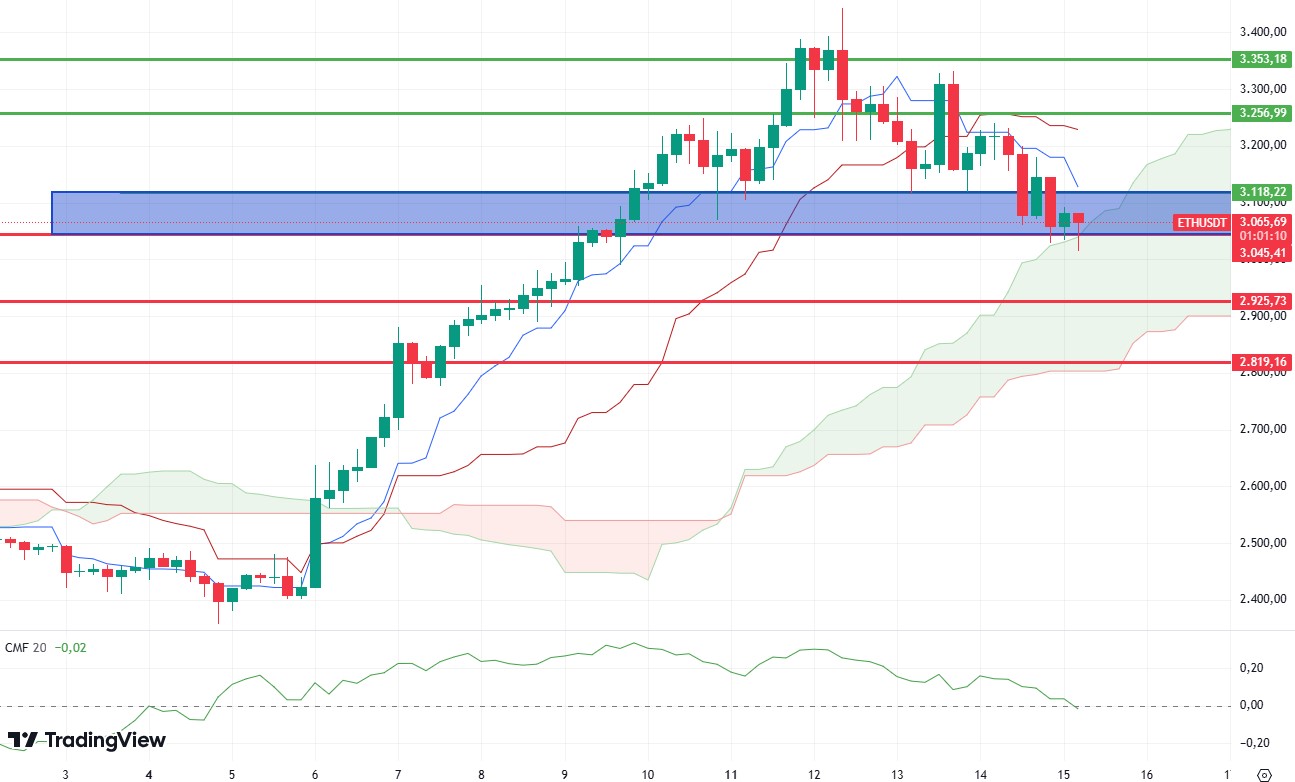
ETH fell yesterday, dropping below the 3,045 support and the kumo cloud level. It then came back to the main support zone, marked by the blue box on the chart. It is seen that the negative structure on the Relative Strength Index (RSI) has turned neutral. Chaikin Money Flow (CMF), on the other hand, declined to 0, taking support from the decision-making point. In addition, when Cumulative Volume Delta (CVD) is analyzed, it is seen that the decline is common from the futures and spot side. In the light of all this data, it can be said that ETH is at the decision-making point. Closures below the 3,045 level may cause the correction to continue until 2,925 levels. Regaining the 3,118 level could trigger rises up to 3,256 levels.
Supports 3,045 – 2,925 – 2,819
Resistances 3,118 – 3,256 – 3,353
XRP/USDT
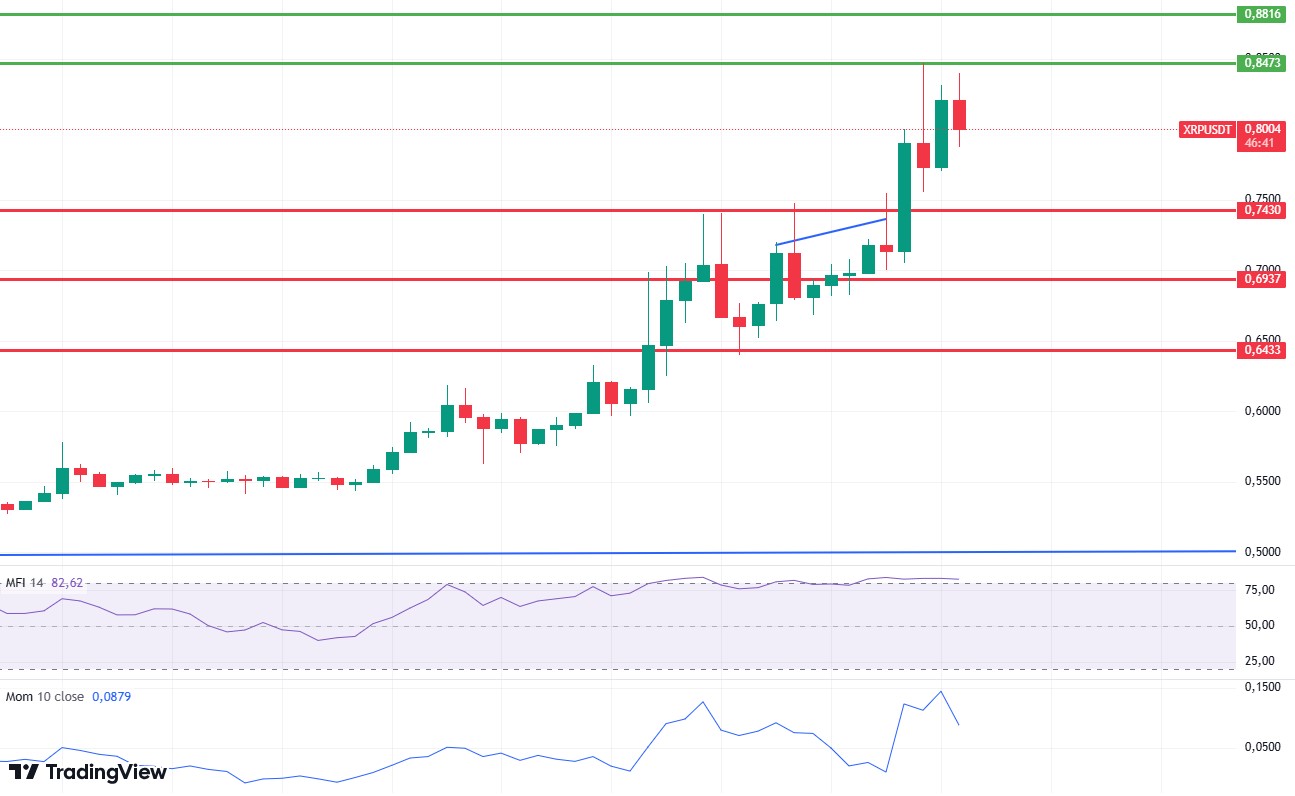
The rise continues breathlessly for XRP, which has experienced an upward momentum in recent days with Trump winning the election. XRP quickly surpassed the 0.7430 region yesterday after SEC chairman Gary Gensler’s statement that he may resign. For XRP, which was met with selling pressure at 0.8473, it is seen that the Relative Strength Index (RSI) level entered the overbought zone and then moved down again. A very similar structure is seen on the Money Flow Index (MFI). Momentum has turned down with the reaction from the 0.8473 level. For XRP, which can continue its rise with the break of the 0.8437 level, attention should be paid to the 0.7430 level, which is the most important support point. A break of this level may cause the decline to intensify.
Supports 0.7430 – 0.6937 – 0.6433
Resistances 0.8473 – 0.8816 – 0.9382
SOL/USDT
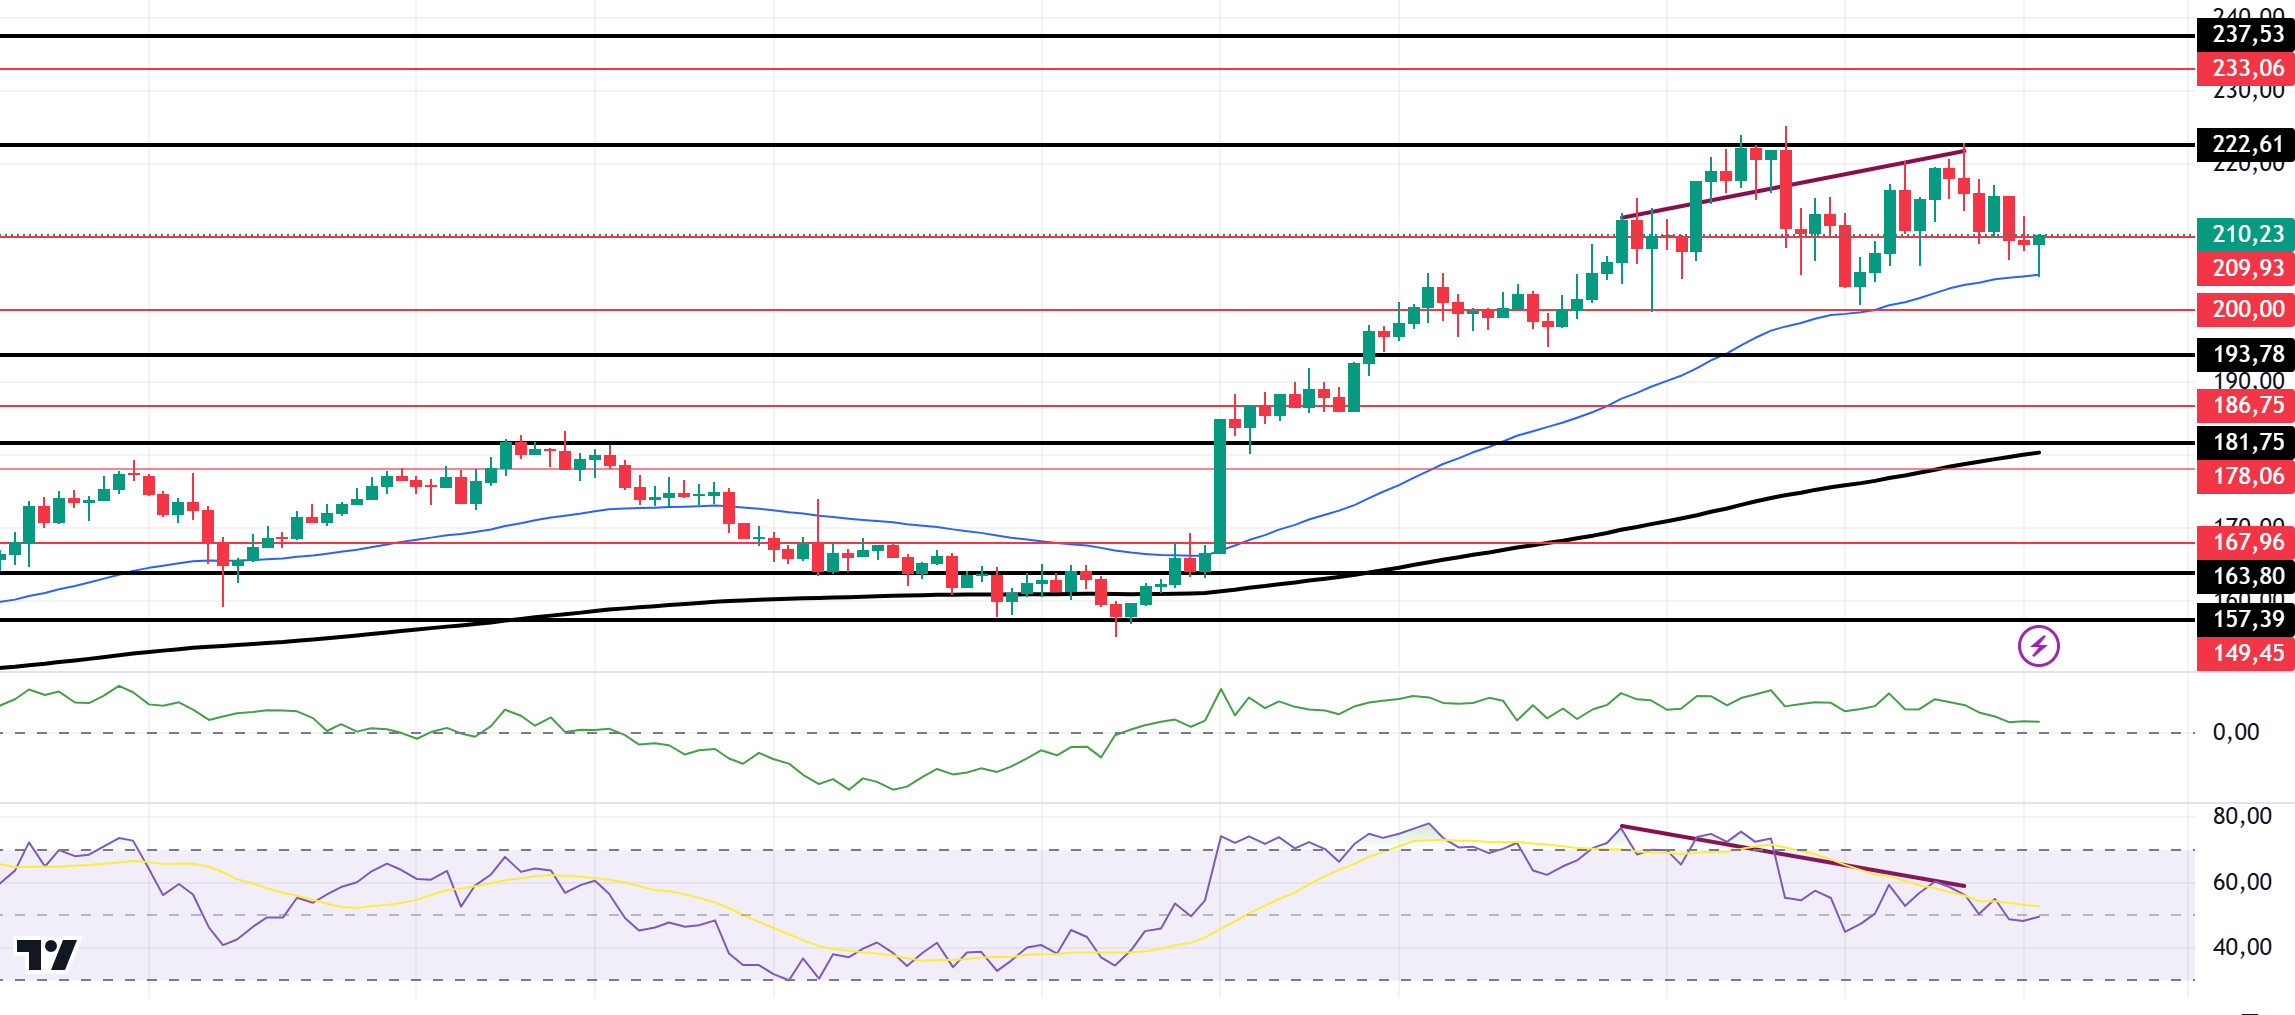
Looking at the Solana ecosystem, crypto investment firm Sol Strategies, led by Leah Wald, acquired four validators for $18 million. This acquisition increased the amount of SOL transferred to Solana validators owned by Sol Strategies by 699,012 SOL to 948,804 SOL and enabled Sol Strategies to earn verification commissions from this transfer. This explains the growing interest in the Solana network, which has become a magnet for institutional investment. “This acquisition will meaningfully expand Sol Strategies’ staking capabilities,” said Leah Wald, emphasizing the importance of this acquisition. It comes with Solana’s growing recognition within traditional finance; especially at the recent Breakpoint conference, major financial institutions such as Franklin Templeton, Citibank and Société Générale announced new projects based on the Solana blockchain. On the 4-hour timeframe, the 50 EMA (Blue Line) continues to be above the 200 EMA (Black Line). This could mean that the uptrend will continue. However, the gap between the two averages continues to widen a lot, with a difference of 13.16%. This could cause pullbacks. However, when we examine the Chaikin Money Flow (CMF)20 indicator, money inflows are positive, but inflows have started to approach neutral. At the same time, there is a mismatch between the Relative Strength Index (RSI)14 chart and the RSI. This may bring a continuation of sales. The price was up by about 2.69% with support from the 50 EMA. The 222.61 level is a very strong resistance point in the uptrend driven by both macroeconomic conditions and innovations in the Solana ecosystem. SOL, which has tested here twice, has lost its momentum and has broken the downward uptrend that has formed since November 5. If it starts rising again and rises above the 222.61 level, the rise may continue strongly. In case of retracements due to possible macroeconomic reasons or profit sales, support levels of 193.78 and 181.75 may be triggered again. If the price hits these support levels, a potential bullish opportunity may arise if momentum increases.
Supports 200.00 – 193.78 – 186.75
Resistances 209.93 – 222.61 – 233.06
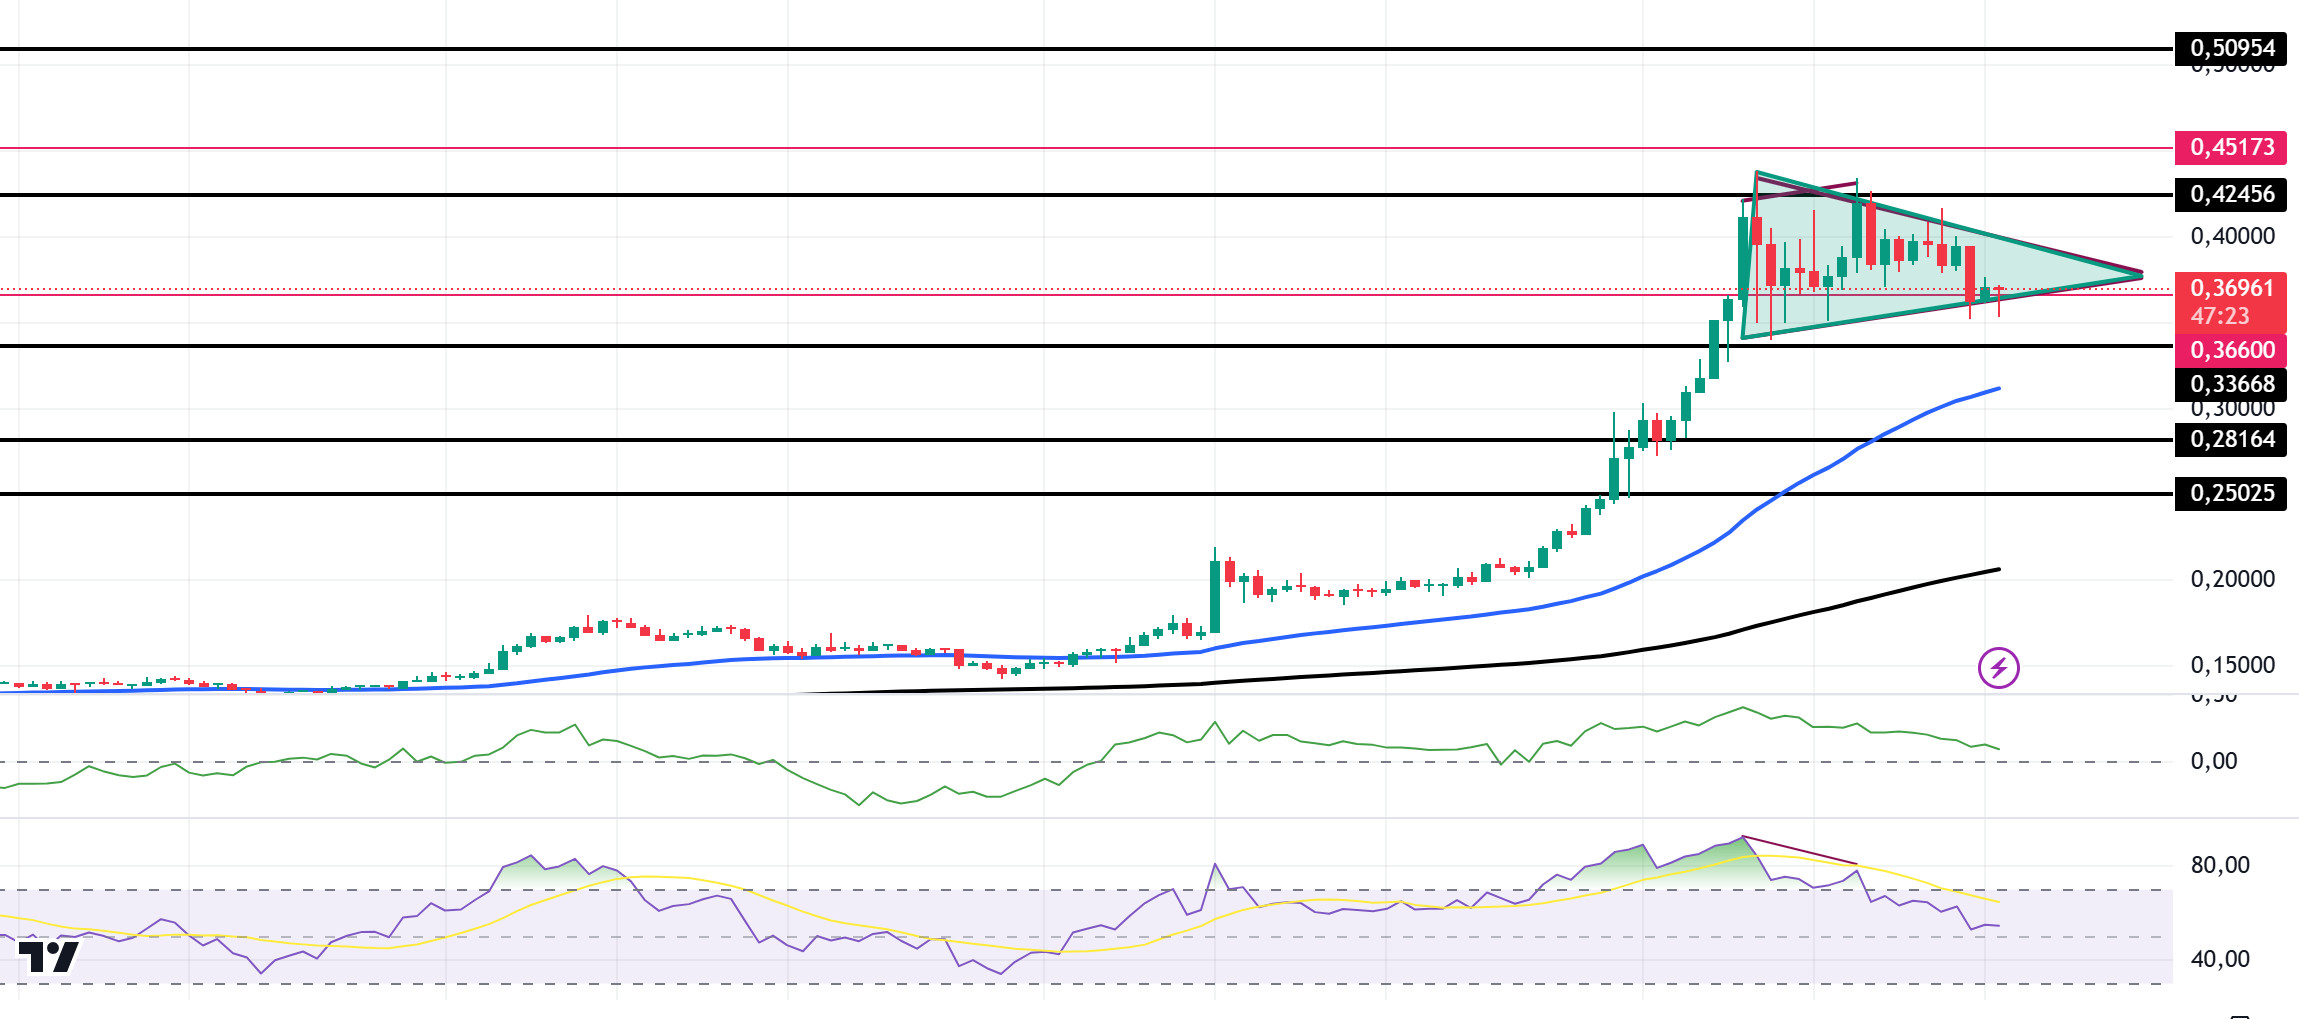
DOGE/USDT
During Dogecoin’s recent surge, 61 billion DOGE changed hands in just one day, a record for whale transactions. But now Dogecoin’s rally is cooling off, struggling to stay above $0.35. This is because its trading volume has fallen by about 33% in the last 24 hours, confirming the gradual increase in its sales. Technically, DOGE has moved sideways since our analysis yesterday. On the 4-hour timeframe, the 50 EMA (Blue Line) continues to be above the 200 EMA (Black Line). This could mean that the uptrend will continue. However, the gap between the two averages has widened a lot, forming a difference of 51.25%. This could cause pullbacks. At the same time, Relative Strength Index (RSI)14 is in overbought territory. This could bring profit sales. Also, there is a mismatch between the chart and the RSI. This is a bearish signal. However, when we examine the Chaikin Money Flow (CMF)20 indicator, money inflows look positive. On the other hand, the flag pennant pattern draws attention. In a scenario where this pattern works, DOGE may reach an all-time high. The 0.42456 level is a very strong resistance point in the rises driven by both macroeconomic conditions and innovations in the Doge coin. If DOGE, which tested here, maintains its momentum and rises above this level, the rise may continue strongly. In case of retracements due to possible macroeconomic reasons or profit sales, the support levels of 0.33668 and 0.28164 can be triggered again. If the price hits these support levels, a potential bullish opportunity may arise if momentum increases.
Supports 0.36600 – 0.33668 – 0.28164
Resistances 0.42456 – 0.45173 – 0.50954
LEGAL NOTICE
The investment information, comments and recommendations contained herein do not constitute investment advice. Investment advisory services are provided individually by authorized institutions taking into account the risk and return preferences of individuals. The comments and recommendations contained herein are of a general nature. These recommendations may not be suitable for your financial situation and risk and return preferences. Therefore, making an investment decision based solely on the information contained herein may not produce results in line with your expectations.


