MARKET SUMMARY
Latest Situation in Crypto Assets
| Assets | Last Price | 24h Change | Dominance | Market Cap |
|---|---|---|---|---|
| BTC | 91,999.68 | -0.01% | 58.94% | 1,82 T |
| ETH | 3,131.68 | -0.37% | 12.21% | 377,19 B |
| SOLANA | 243.19 | 0.54% | 3.74% | 115,48 B |
| DOGE | 0.3899 | 2.69% | 1.85% | 57,20 B |
| XRP | 1.110 | -3.40% | 2.04% | 63,05 B |
| CARDANO | 0.7627 | -0.01% | 0.86% | 26,69 B |
| TRX | 0.2059 | 0.10% | 0.58% | 17,79 B |
| SHIB | 0.00002525 | -1.02% | 0.48% | 14,86 B |
| AVAX | 35.50 | -0.96% | 0.47% | 14,52 B |
| LINK | 15.05 | 2.58% | 0.31% | 9,44 B |
| DOT | 5.969 | 1.79% | 0.29% | 9,06 B |
*Prepared on 11.19.2024 at 06:00 (UTC)
WHAT’S LEFT BEHIND
Giant Bitcoin Purchase from MicroStrategy
MicroStrategy bought a total of 51,780 Bitcoin between November 11th and 17th. The company continued to aggressively accumulate Bitcoin this week after completing 27,000 Bitcoin purchases last week. With the new purchases, the average cost per Bitcoin was $88,627, totaling $4.6 billion.
Trump Makes New Moves in Crypto Space: Bakkt Acquisition on the Agenda
Donald Trump, who is preparing to return to the White House in 2025, is expanding his ventures in the cryptocurrency sector. According to the Financial Times, Trump Media & Technology Group is in advanced negotiations to acquire cryptocurrency exchange Bakkt. This step is seen as part of Trump’s strategy to grow the “crypto business”.
Bitcoin ETF Options List on Nasdaq
Nasdaq is preparing to list options on BlackRock’s Bitcoin exchange-traded fund. The move will allow investors to invest or manage their risk in Bitcoin through derivatives. This listing of Bitcoin ETF options could bring a new influx of liquidity to the cryptocurrency market.
Semler Scientific Expands Bitcoin Strategy
Health technology company Semler Scientific bought 215 more Bitcoin between November 6 and 15, bringing its total reserves to 1,273 BTC. A total of $17.7 million was spent for this purchase. The company’s Bitcoin investment returned 37.3% during this period. Between October 1 and November 15, Bitcoin’s total return was recorded as 18.9%.
USDT Inflow of 3.2 Billion to Crypto Exchanges!
According to data from CryptoQuant, a total of $3.2 billion worth of USDT has entered centralized cryptocurrency exchanges since November 5. This is the largest inflow since November 2021. In the same period, trading volume increased by 55% to $2.4 trillion and the number of transactions increased by 46% to over 610 million. The total number of active addresses increased by 14% to 26.7 million. This data reveals the rapid increase in the use of stablecoins.
SEC Chairman Gary Gensler Expected to Resign
Rumors that US Securities and Exchange Commission (SEC) Chairman Gary Gensler will resign are on the agenda in Washington. It is stated that the resignation may become official after Thanksgiving. This development may have great repercussions in the cryptocurrency market.
HIGHLIGHTS OF THE DAY
Important Economic Calender Data
| Time | News | Expectation | Previous |
|---|---|---|---|
| Aptos (APT) Bitwise Aptos Staking ETP: Physically backed APTB with ~4.7% returns net of fees | |||
| BNB (BNB) BNB Beacon Chain Sunset | |||
| Internet Computer (ICP) Bitfinity L2 Mainnet | |||
| 13:30 | US Building Permits (Oct) | 1.44M | 1.43M |
| 18:10 | FOMC Member Schmid Speaks |
INFORMATION:
*The calendar is based on UTC (Coordinated Universal Time) time zone. The economic calendar content on the relevant page is obtained from reliable news and data providers. The news in the economic calendar content, the date and time of the announcement of the news, possible changes in the previous, expectations and announced figures are made by the data provider institutions. Darkex cannot be held responsible for possible changes that may arise from similar situations.
MARKET COMPASS
The high dollar index and US bond yields, which have been affecting the stock market indices and thus the risk appetite of global markets for some time, eased slightly this morning, slightly increasing investors’ willingness to take risk. The US 10-year bond yield eased from 4.50% to around 4.40%. We can say that we are seeing the effect of this on the digital assets front, but we can’t say that prices in major cryptocurrencies are much different from the levels seen in the last few days.
Having left the critical developments behind at the beginning of the month, the markets have largely focused on the next move of the US Federal Reserve (FED) and the names that President-elect Trump will include in his cabinet. In addition, the crypto world has been keenly watching the news flows (such as MicroStrategy…), which indicate a growing interest in digital assets at the institutional level.
From the short term to the big picture.
The victory of former President Trump on November 5, which was one of the main pillars of our bullish expectation for the long-term outlook in digital assets, produced a result in line with our forecasts. The continuation of the Fed’s rate cut cycle (albeit with cautious messages from Powell…) and the inflows into BTC ETFs, indicating an increase in institutional investor interest (in addition, MicroStrategy’s BTC purchases, Microsoft starting to evaluate the purchase…) support our upside forecast for the big picture for now.
In the short term, given the nature of the market and pricing behavior, we think it would not be surprising to see occasional respite or pullbacks in digital assets. At this point, it is worth reiterating that fundamental dynamics remain bullish. While the fact that Bitcoin, the largest digital currency, has extended its record highs several times may continue to whet the appetite of buyers to take new, upside positions, we will be watching this group struggle with the masses who may want to take profit realizations and speculators who want to take advantage of potential declines after rapid rises.
TECHNICAL ANALYSIS
BTC/USDT
MicroStrategy, led by Michael Saylor, bought another 80,000 BTC in November, embracing Bitcoin as a hedge against inflation. Its total Bitcoin holdings grew to 330,000, valued at $30 billion. The company plans to continue to use some of the proceeds for Bitcoin investments, offering $1.75 billion in convertible bonds for its recent purchases.
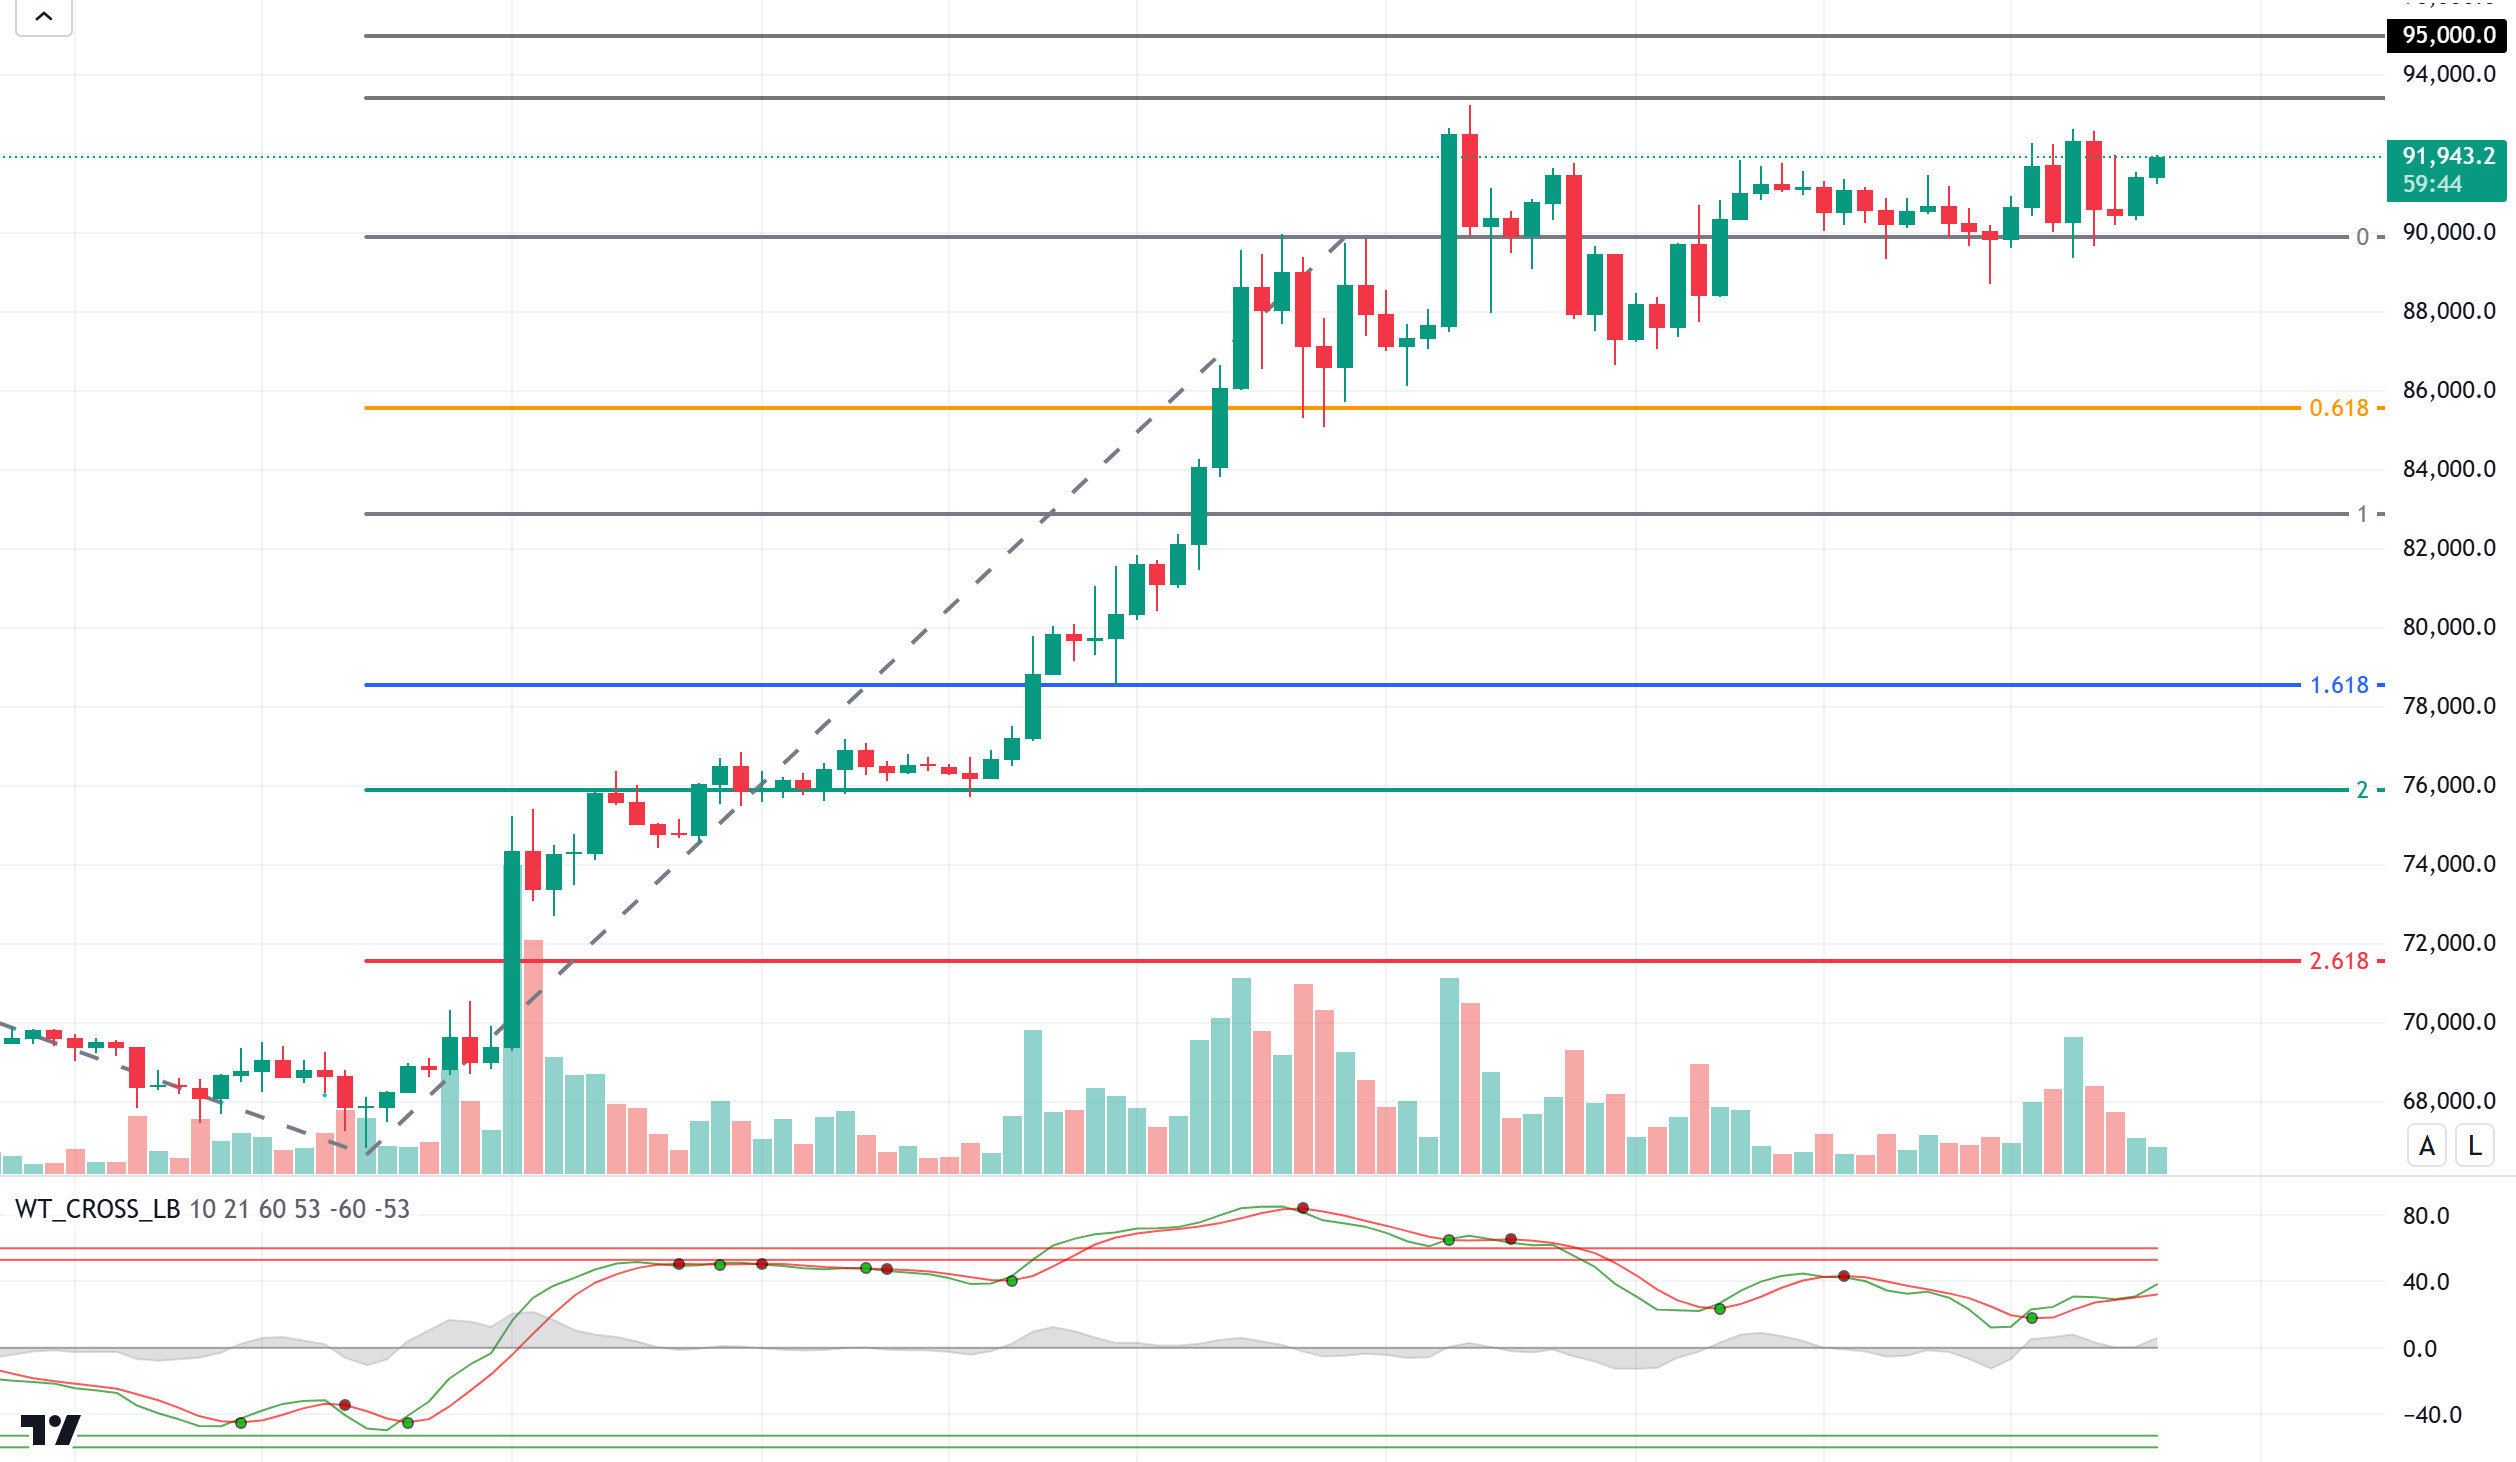
With all these positive developments, BTC settled above the 90,000 level again after short-term fluctuations when we look at the technical outlook. The 90,000 level, which appears as a support or resistance level from time to time, continues to be seen as a psychological threshold as of now. If the price exceeds this level, six-digit levels are targeted with the expectation of a new ATH. On the other hand, we may continue to think that selling pressure may increase slightly with closures below this level. Although it is seen that our technical oscillator continues to signal in the direction of buying again, the 93,434 level may be retested.
Supports: 90,000 – 87,000 – 85,500
Resistances: 91,350 – 93,000 – 95,000
ETH/USDT
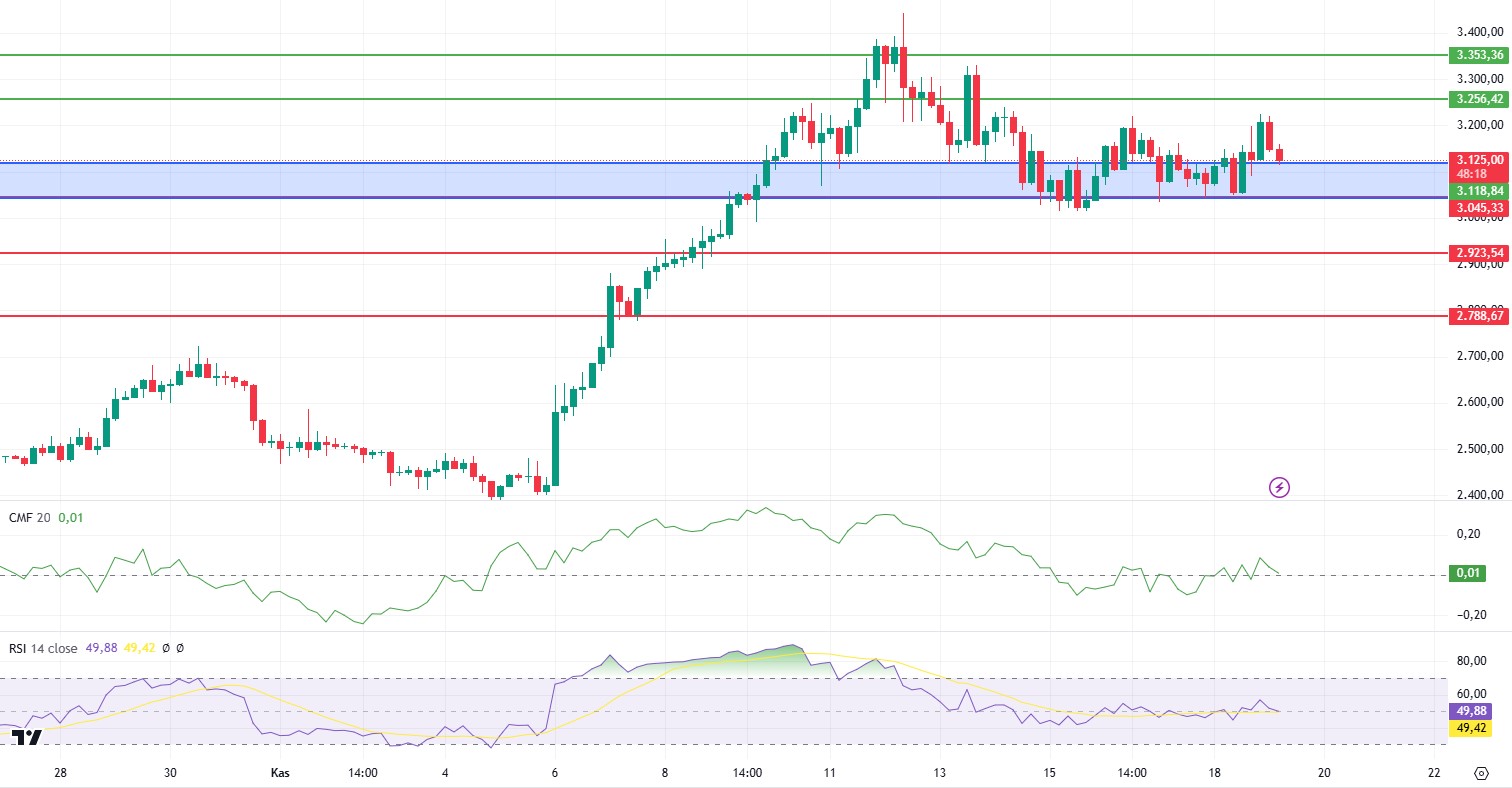
After breaking the 3,118 level, ETH managed to move upwards as expected and rose to 3,222. Then it is testing the 3,118 zone again. Chaikin Money Flow (CMF), Relative Strength Index (RSI), momentum and Commodity Channel Index (CCI) continue to move sideways for ETH, which continues to accumulate above $3,000 during these periods when BTC is looking for new highs. Provided that ETH does not lose the 3.118 level, this pullback can be characterized as a re-test move and we may see another rise to 3.256 levels during the day. However, the downside break of the 3,118 level may cause rapid declines to the 3,045 level again. Closures below the 3.045 level may start a downtrend.
Supports 3,118 – 3,045 – 2,923
Resistances 3,256 – 3,353 – 3,534
XRP/USDT
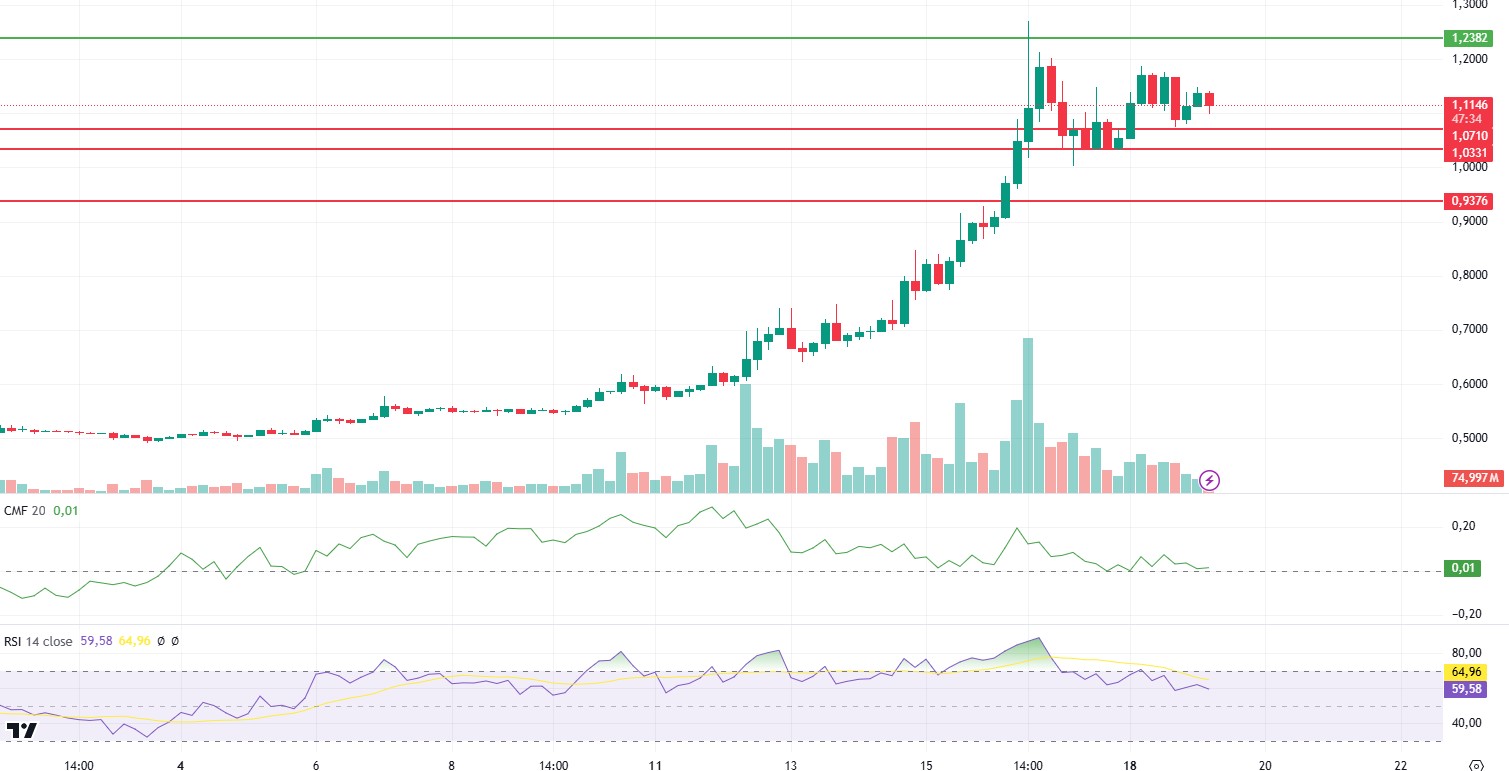
For XRP, which continues to accumulate between 1.03 – 1.23 levels, decreases in spot trading volumes are noticed. Chaikin Money Flow (CMF) converging to zero and moving horizontally also supports this indicator. Commodity Channel Index (CCI) is positive and Relative Strength Index (RSI) has turned neutral. In the light of this data, a decline to levels between 1.07 – 1.03 may occur during the day. It seems likely that reaction purchases will come in this decline. A break of 1.23 level may ensure the continuation of the uptrend.
Supports 1.0709 – 1.0333 – 0.9382
Resistances 1.2386 – 1.3487 – 1.4463
SOL/USDT
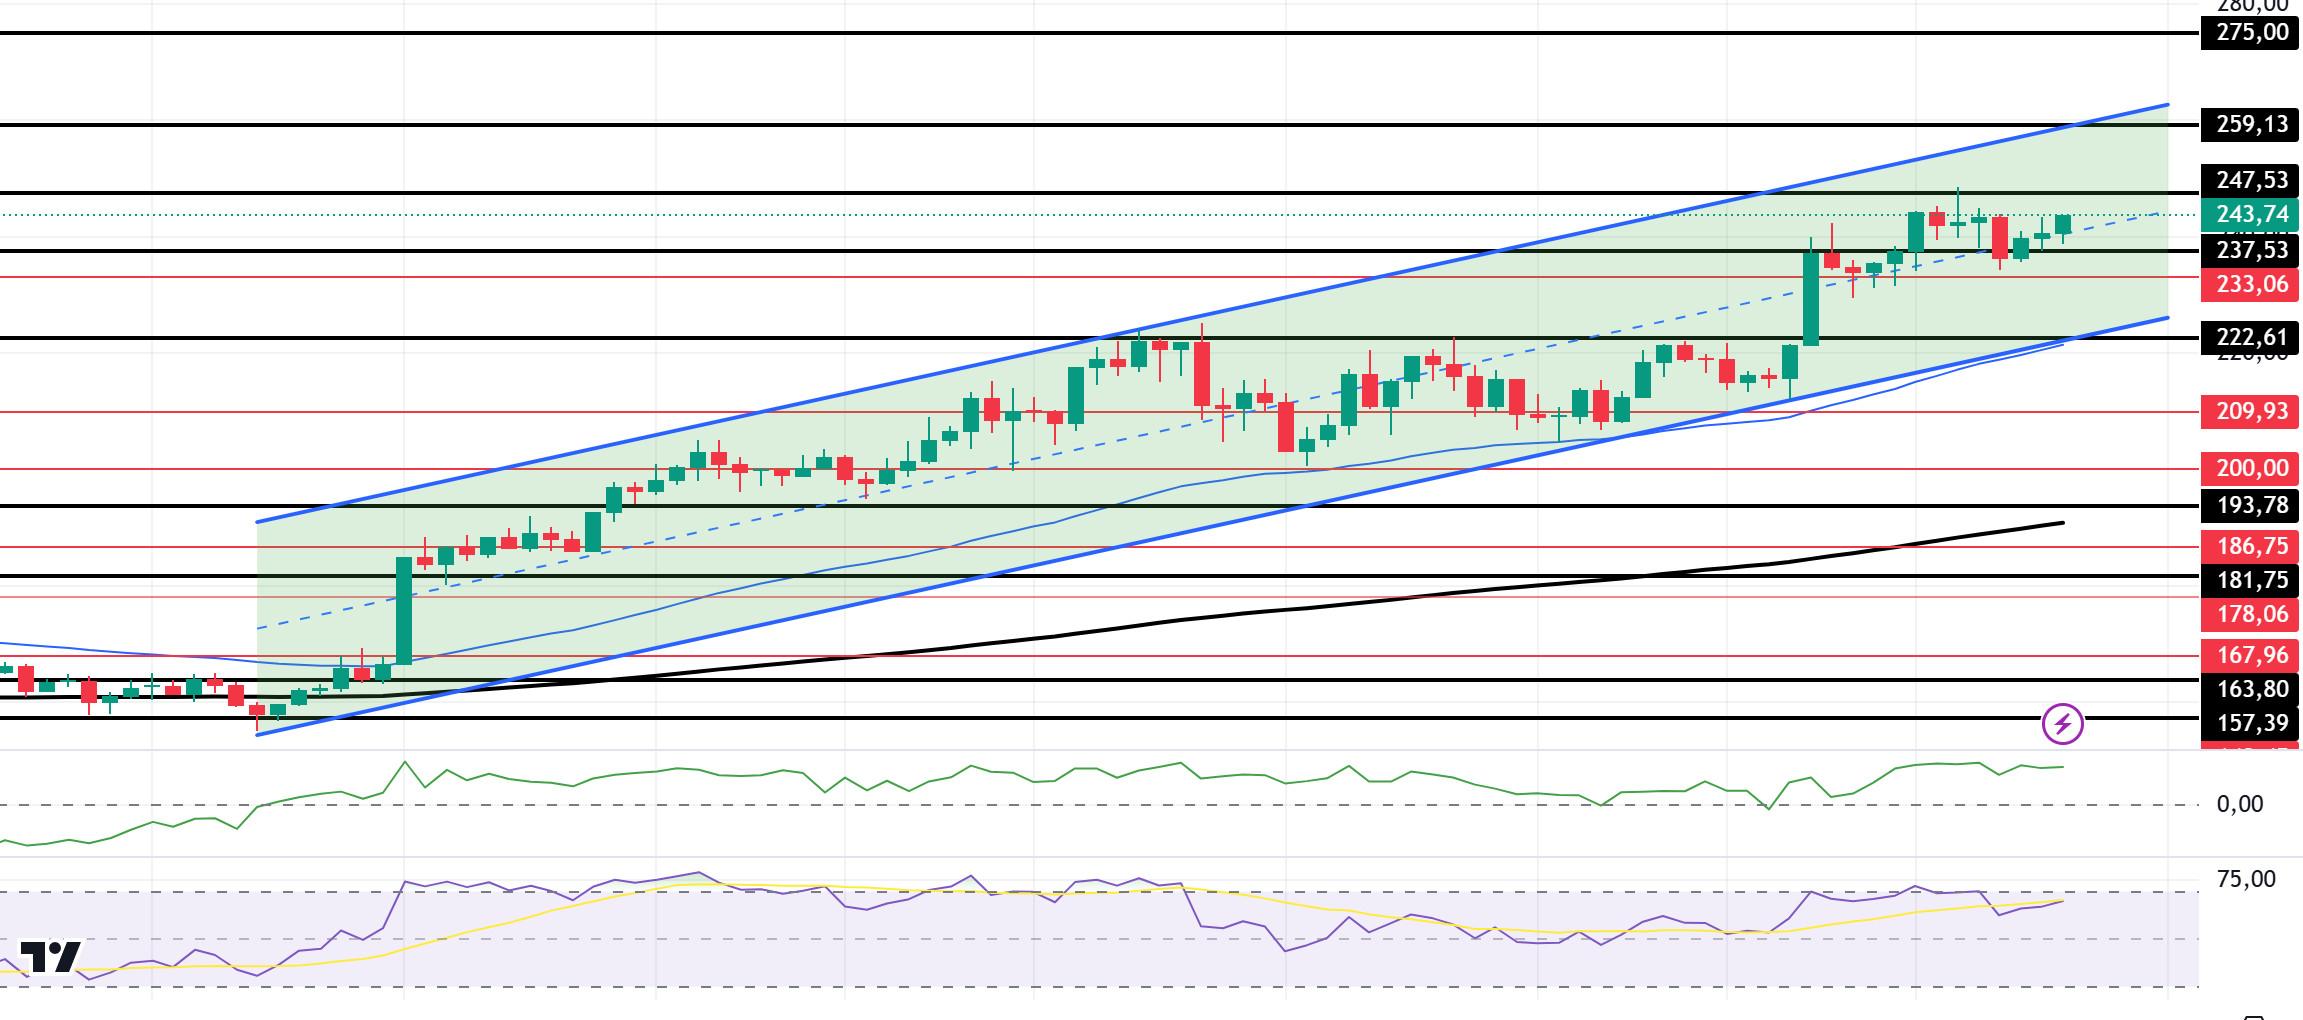
pump.fun, a no-code token distribution platform, continues to drive excitement and volume on the Solana network. Daily token distributions reached an all-time high, with over 31.5 new tokens created per minute. This has also led to an increase in user activity. Over the last 17 days, Solana has processed 45 million transactions. According to Artemis data, it recorded an increase of 7%. Technically, the 50 EMA (Blue Line) continues to be above the 200 EMA (Black Line) in the 4-hour timeframe. Since November 4, SOL, which has been in an uptrend since November 4, continues to be priced by maintaining this trend. This may mean that the uptrend will continue. However, when we examine the Chaikin Money Flow (CMF)20 indicator, money inflows are positive, but inflows have started to decrease. At the same time, Relative Strength Index (RSI)14 remained in the overbought zone. This may mean that there may be a sell-off. The 247.53 level is a very strong resistance point in the uptrend driven by both macroeconomic conditions and innovations in the Solana ecosystem. If it breaks here, the rise may continue. In case of retracements due to possible macroeconomic reasons or profit sales, the support levels of 222.61 and 193.78 can be triggered again. If the price reaches these support levels, a potential bullish opportunity may arise if momentum increases.
Supports 237.53 – 233.06 – 222.61
Resistances 247.53 – 259.13 – 237.53
DOGE/USDT
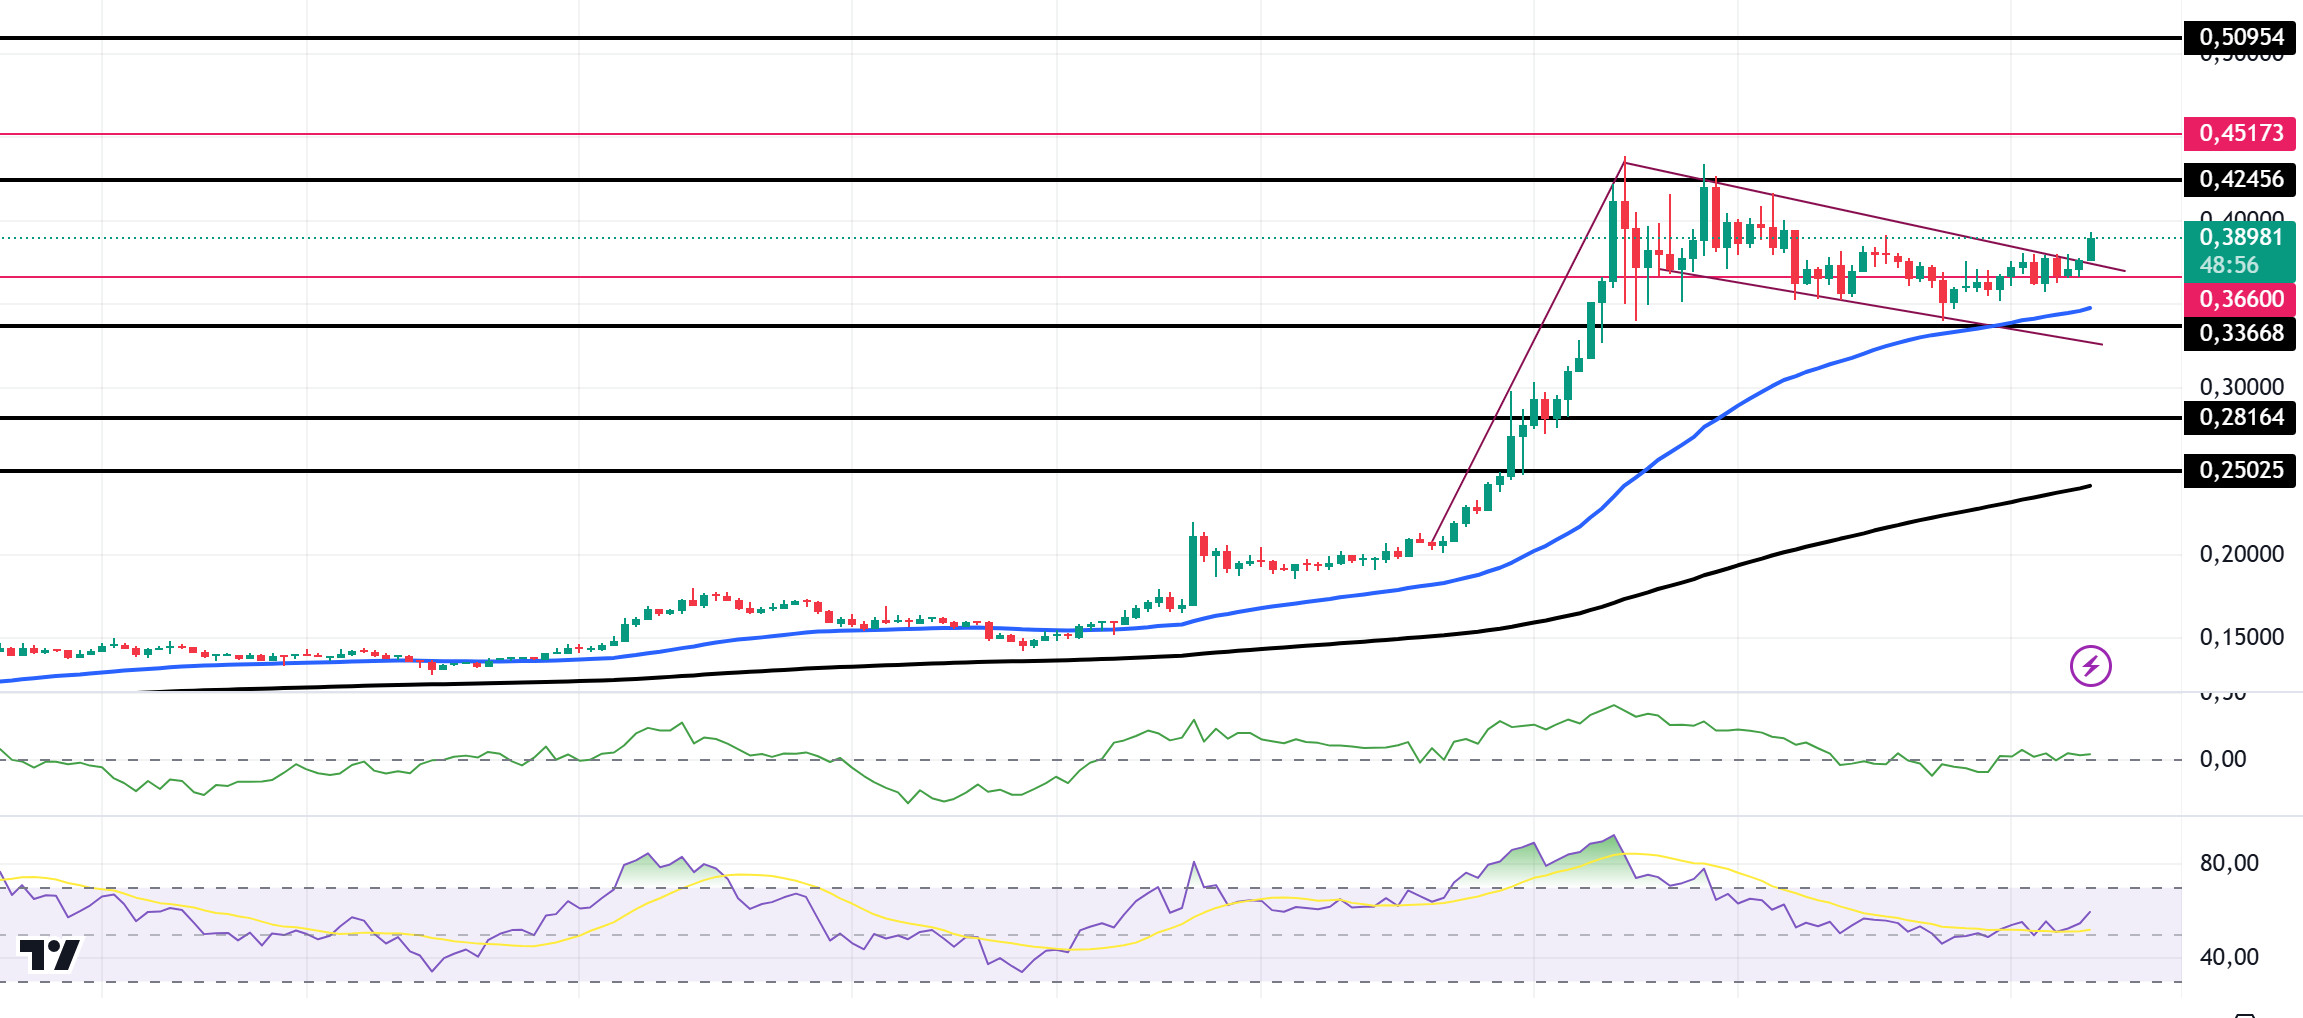
The ecosystem has seen a significant increase in whale transactions in Dogecoin. According to IntoTheBlock data, large DOGE transfers have increased by 41% in the last 24 hours. On the other hand, Coinglass’ latest analysis shows a remarkable liquidation pool worth $4.97 million at the 0.3812 price point. This could be a place that triggers the price. Technically, Doge continues to consolidate above 0.35 since our analysis yesterday. However, a bull flag pattern has formed. If the pattern works after a short pullback or consolidation, the rises will continue. On the 4-hour timeframe, the 50 EMA (Blue Line) continues to be above the 200 EMA (Black Line). This could mean that the uptrend will continue. But the gap between the two averages is still too wide. This could cause pullbacks. At the same time, the Relative Strength Index (RSI)14 has moved from overbought to neutral territory. However, the Chaikin Money Flow (CMF)20 indicator remains neutral. The 0.42456 level stands out as a very strong resistance point in the rises driven by both macroeconomic conditions and innovations in the Doge coin. If DOGE, which tested here, maintains its momentum and rises above this level, the rise may continue strongly. In case of retracements due to possible macroeconomic reasons or profit sales, the support levels of 0.33668 and 0.28164 can be triggered again. If the price hits these support levels, a potential bullish opportunity may arise if momentum increases.
Supports 0.36600 – 0.33668 – 0.28164
Resistances 0.42456 – 0.45173 – 0.50954
LEGAL NOTICE
The investment information, comments and recommendations contained herein do not constitute investment advice. Investment advisory services are provided individually by authorized institutions taking into account the risk and return preferences of individuals. The comments and recommendations contained herein are of a general nature. These recommendations may not be suitable for your financial situation and risk and return preferences. Therefore, making an investment decision based solely on the information contained herein may not produce results in line with your expectations.


