BTC/USDT
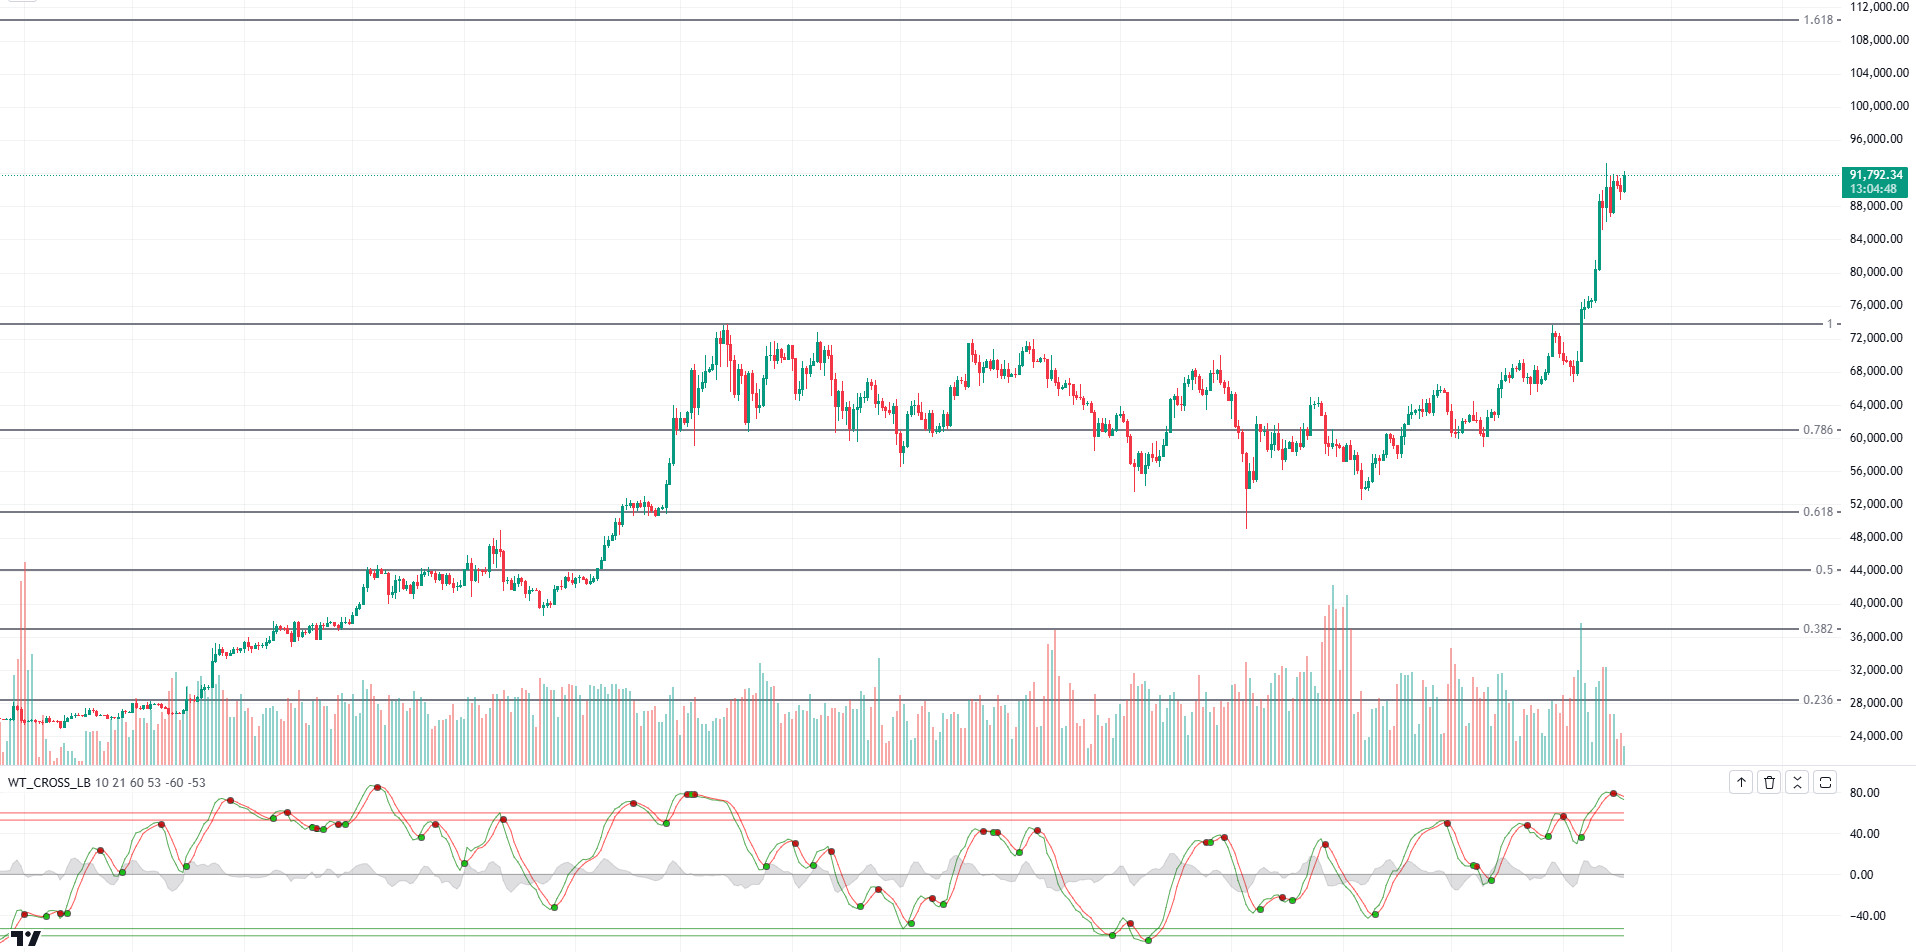
Another eventful week was left behind in Bitcoin. In this process, where many important developments affecting the market took place, eyes turned to the statements of FED Chairman Powell after the inflation data. Powell’s cautious statements regarding the expectations of an interest rate cut next month led to increased volatility in Bitcoin price. In addition, in the US, where Bitcoin spot ETF inflows have intensified, the expectations of the new president Donald Trump’s initiative on the cryptocurrency sector have brought the Bitcoin price close to all-time highs (ATH) again.
When we look at BTC’s technical outlook in light of all these developments, we see that the price is strongly moving towards six-digit levels, maintaining its historical uptrend. The increasing momentum, especially after breaking through the Fibonacci 1 level of 73,750 resistance, carried the price to the new ATH level of 93,434. The next target for BTC, which has entered the consolidation process at these levels, stands out as testing above 100,000 if momentum is regained. Trading signals in the price overbought zone, which progresses in negative harmony with technical oscillators on the daily chart, attract attention. Finally, when we look at the monthly return data for BTC November, it is seen that it has a return of 30.72% as of now with an average of 45%.
Supports 90,000 – 85,000 – 83,000
Resistances 93,434 – 95,000 – 100,000
ETH/USDT
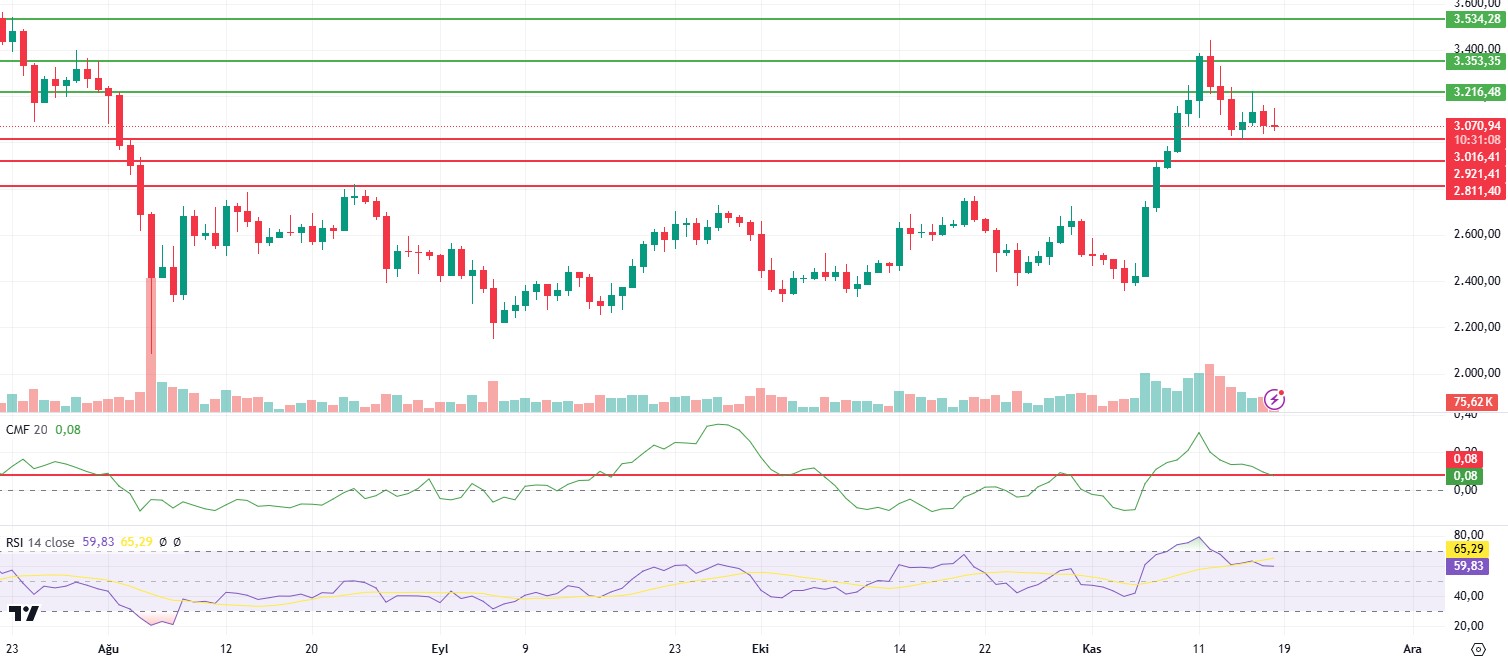
ETH, which managed to rise to 3,373 resistance after the US presidential elections, is trying to maintain the $3,000 level after starting a correction wave. During this bullish period, liquidity is mostly shifting to memecoins on networks like Solana. The lack of volume in ETH and L2s on ETH can be considered one of the most important factors. It is seen that the decline continues on ETH/BTC. A reaction can be expected at 0.033 levels in the pair, which comes to strong support zones. However, the downward break of the region may cause the declines to harden. On the other hand, on the on-chain side, it is seen that the demand for memecoins on the NFT and L2s side is increasing. After the saturation of other networks, we may see liquidity flow to Ethereum and Ethereum L2 networks.
When we examine ETH technically, it can be said that one of the first striking factors is the Chaikin Money Flow (CMF) value, which fell to 0.08. CMF falling below this level has the potential to create a sell signal. In last week’s analysis, we said that the Relative Strength Index (RSI) value, which rose to the overbought zone, could cause a correction on ETH up to 3,016 levels. Considering that this scenario has come true and the RSI level has declined to 58 levels, a bullish movement to 3.216 levels can be expected to come, provided that the 3.016 level is not lost. The loss of the 3,016 level may cause the decline to deepen and continue to the 2,921 level.
Supports 3,016 – 2,952 – 2,780
Resistances 3,255 – 3,373 – 3,558
XRP/USDT
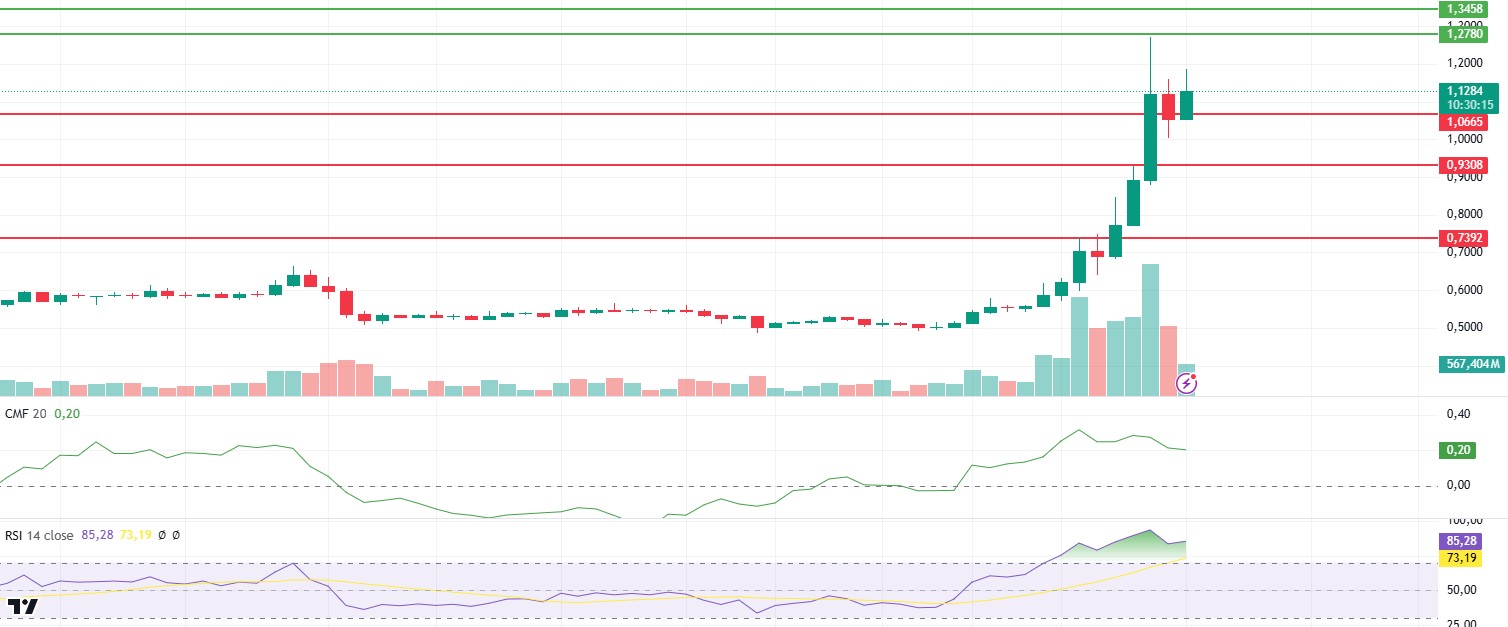
XRP, which continues to rise with very sharp movements after Gary Gensler’s statements that can be interpreted as resignation, is holding above 1.06 support with the rejection from here after rising to 1.27 levels. A retest on Chaikin Money Flow (CMF) and negative divergences on the Relative Strength Index (RSI) may bring some sideways movement of the price or corrections to 0.93 levels. However, breaking the key resistance of 1.34 may bring a continuation of the uptrend. For the medium and long term, it can be said that the potential price movements mentioned above for XRP, where bullish expectations continue, will not disrupt the main trend.
Supports 1.0665 – 0.9308 – 0.7392
Resistances 1.2386 – 1.3487 – 1.4463
SOL/USDT
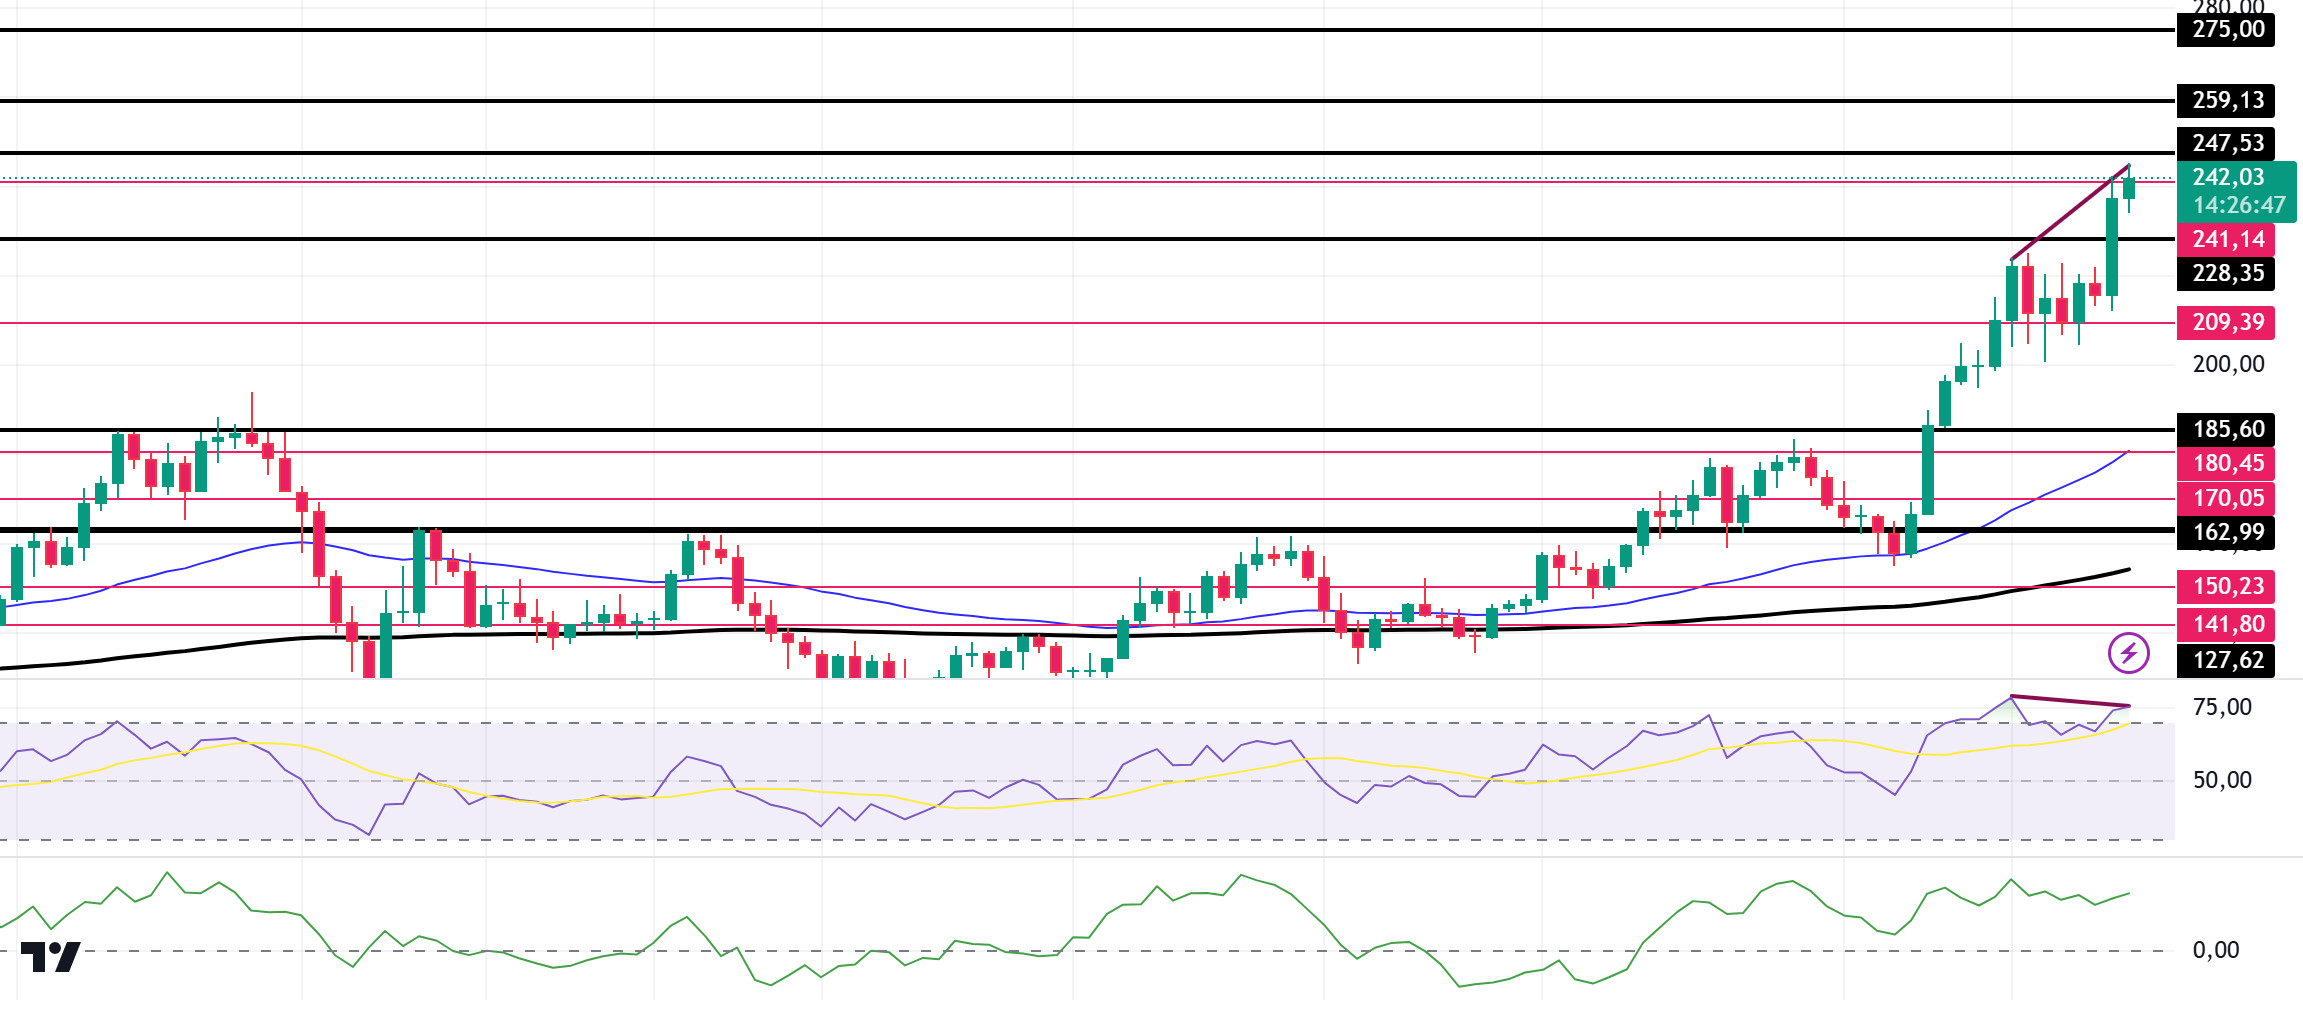
Last week’s data from the US showed that the October Producer Price Index came in line with expectations at 0.2%, indicating that inflation on the producer side was stable. In addition, unemployment claims fell to 217 thousand and the labor market continued to remain strong. The Consumer Price Index increased in October by 0.2% on a monthly basis and 2.6% on an annual basis, in line with expectations. This caused instant rises in cryptocurrencies. After all this data, according to data from CME, the probability of a 25 basis point rate cut is 61.9% at the time of writing. In the Solana ecosystem, DeFi Technologies officially announced the launch of SolFi, an operating company focused on Solana, on Tuesday, November 12. The firm hopes to join institutions Solana’s performance, which has grown significantly this year. SolFi will benefit from Solana’s performance in several areas. The fund will combine staking and advanced validator operations to generate returns for investors. In particular, it will leverage a proprietary Maximum Extractable Value (MEV) engine to increase staking returns. The company cited its inspiration as Michael Saylor’s Microstrategy, which is highly exposed to Bitcoin. DeFi Technologies CEO Olivier Roussy Newton suggested that SolFi could do for Solana what Microstrategy did for Bitcoin. On-chain, according to DeFiLlama data, SOL DEX daily trading volume exceeded $5 billion for three consecutive days. This showed that the ecosystem is attracting a lot of interest. In support of this, SOL’s Open Interest data increased aggressively. This shows that the activity of whales is increasing and the momentum could be on the upside. In other data, according to CoinGlass, Open Interest stands at around $5.83 billion, which is where it was last seen in December 2021. Meanwhile, the market has seen an increase in SOL’s supply. According to Tokenomist, 524,030 SOL tokens worth $110.25 million were launched. This amount represents approximately 0.11% of Solana’s circulating supply. As a result, while investors expect SOL’s price to rise, they are also prepared for possible resistance. BTC continues to rise, making an all-time ATH. In the data to be followed next week, Manufacturing PMI and Services PMI data from the US will be important. Technically, SOL is pricing at 242.22, up 15.10% last week. It has broken the 222.61 resistance, which is a strong resistance place, and turned it into support. On our daily chart, the 50 EMA (Blue Line) continues to accelerate upwards from the 200 EMA (Black Line). This shows us that the trend is bullish. The 185.60 level, which is a strong resistance, is working as a support after being broken by a voluminous candle last week. This is an important support level for the continuation of the uptrend. Relative Strength Index (RSI) is at 14 overbought levels. At the same time, a mismatch is seen. All this points to a pullback in the price. However, when we examine the Chaikin Money Flow (CMF)20 indicator, money inflows are positive and inflows continue to increase. If the positive results in macroeconomic data and positive developments in the ecosystem continue, it may test the first major resistance level of 257.97. In case of declines due to political developments or negative news in the Solana ecosystem, the 185.60 level can be followed and a buying point can be determined.
Supports 228.35 – 209.39 – 185.60
Resistances 247.53 – 259.13 – 275.00
DOGE/USDT
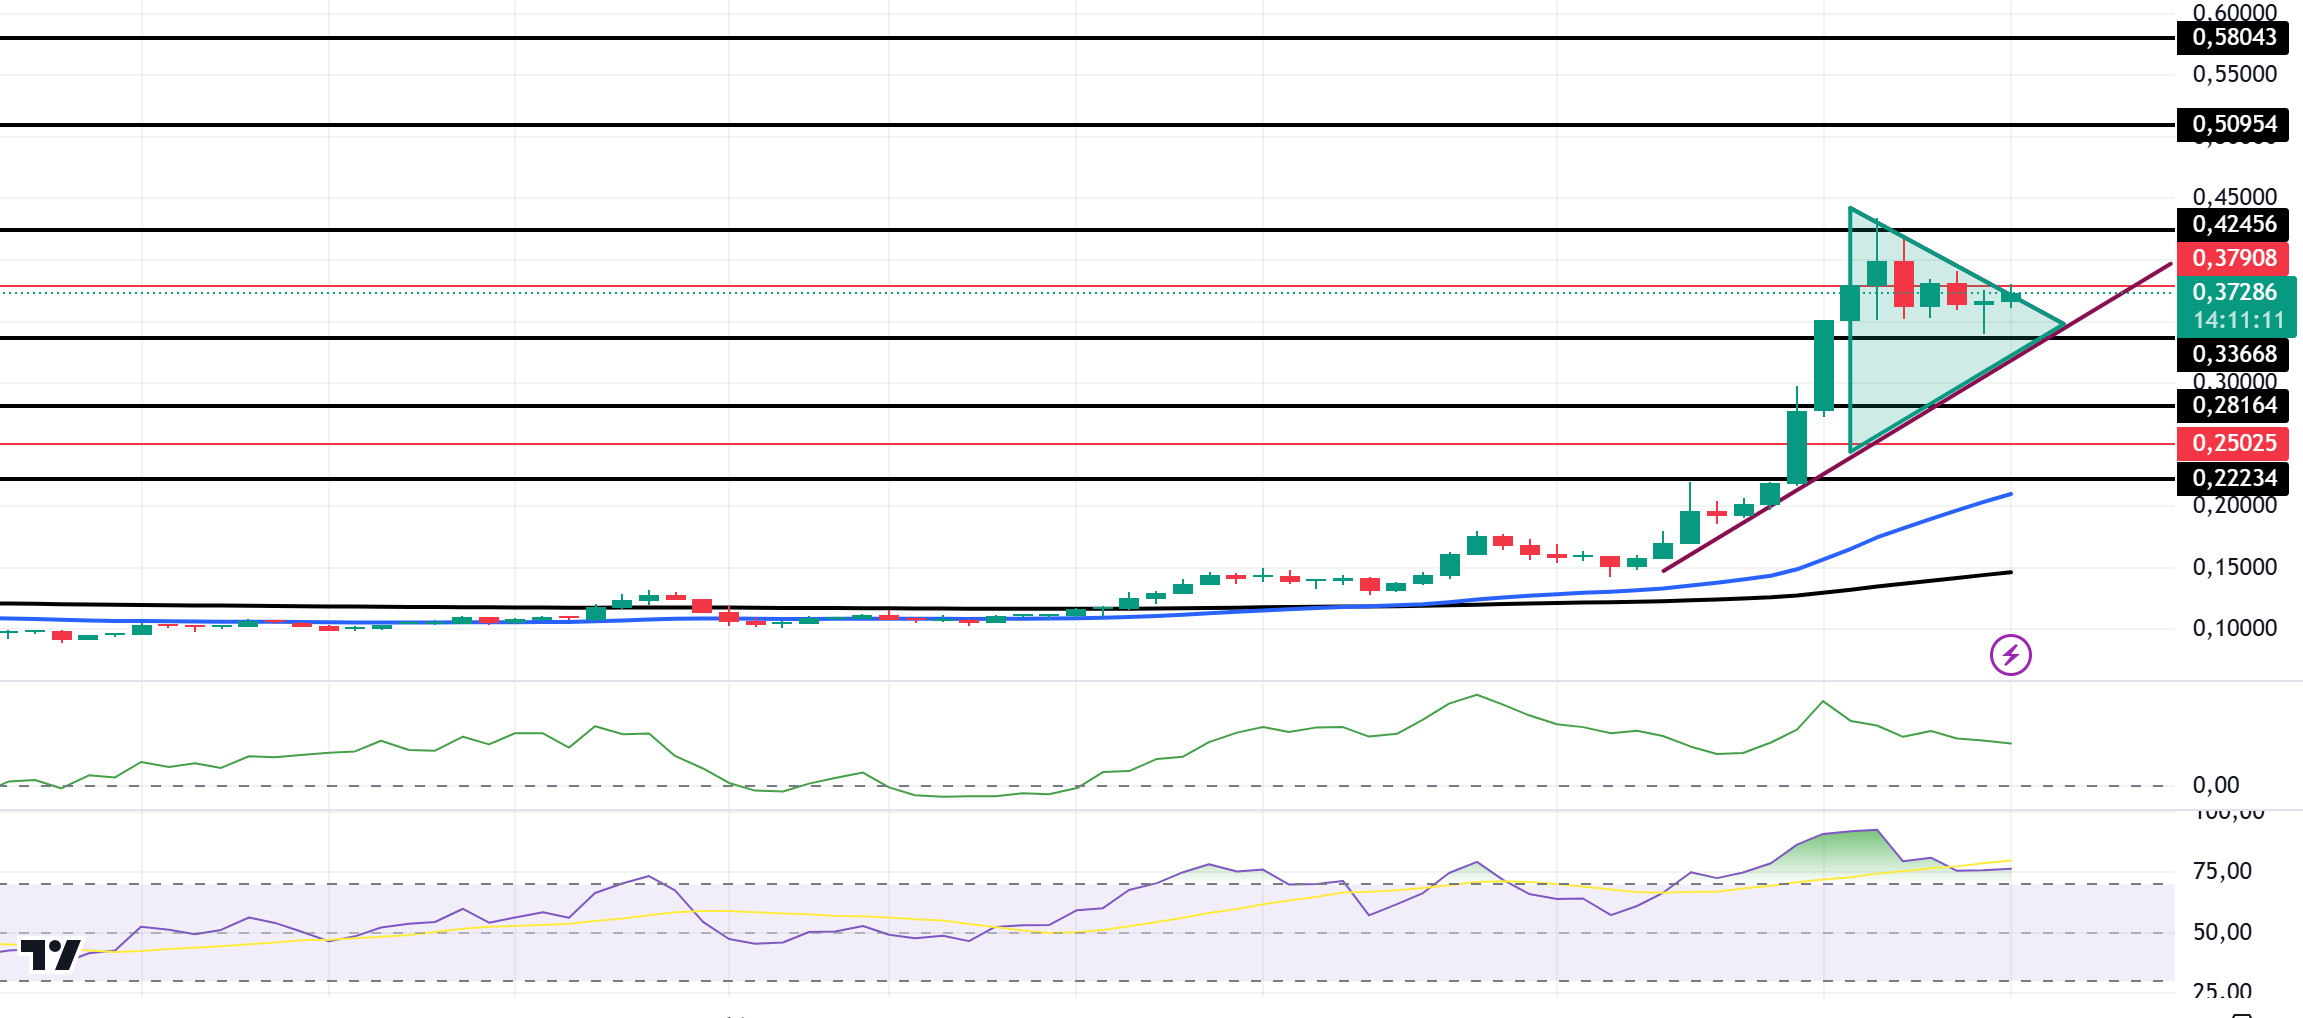
Last week’s data from the US showed that the October Producer Price Index came in line with expectations at 0.2%, indicating that inflation on the producer side was stable. In addition, unemployment claims fell to 217 thousand and the labor market continued to remain strong. The Consumer Price Index increased in October by 0.2% on a monthly basis and 2.6% on an annual basis, in line with expectations. This caused instant rises in cryptocurrencies. After all this data, according to data from CME, the probability of a 25 basis point rate cut is 61.9% at the time of writing. Last week, DOGE was very active and had an extremely busy agenda due to political developments. On Tuesday night, President-elect Donald Trump appointed Tesla CEO Elon Musk and entrepreneur Vivek Ramaswamy to lead the new administration’s Department of Government Efficiency, also known as D.O.GE. Dogecoin trading is about to go from meme token to reality as Donald Trump endorses D.O.G.E. In his X post, Musk said that all Department of Government Efficiency actions will be published online for maximum transparency. However, Dogecoin co-founder Billy Markus revealed a potential deflationary model for DOGE on GitHub. To implement deflationary changes, the community needs to reach a consensus and gain miner support. Dogecoin’s current design includes an intentional inflation rate, with 5 billion DOGE added each year. The supply currently stands at 146.78 billion units and increases by 5 billion every year. While this may sound inflationary, Markus said that the actual inflation rate decreases inversely proportional to the increasing supply of the coin. For Dogecoin to adopt a deflationary model, the community will need to support the proposed changes. On the other hand, the crypto community has rekindled excitement for the cryptocurrency with Elon Musk’s recent tweet about Dogecoin. The community celebrates Musk’s presence and continued support after years of fluctuating interest. Musk’s response to Melissa Chen’s tweet about “DOGE” highlights the social impact of cryptocurrencies and meme culture. Doge’s dramatic rise continued, reaching its June 2021 level again. One of the key reasons for this is that large investors, the so-called “whales”, have accumulated Dogecoin over the past three months amid increased interest after the election. This has strengthened DOGE’s price against possible pullbacks. As whale holdings approach the one billion threshold, sentiment among this group of investors supports a long-term outlook on Dogecoin’s value. According to on-chain data, an impressive 91.17% of the 5.82 million addresses of Dogecoin buyers are in profit. This means that they are holding Doge at an average price lower than current prices today. This may increase the selling pressure. In the data to be followed next week, Manufacturing PMI and Services PMI data from the USA will be important. Dogecoin currently has a market capitalization of $55.06 billion, with a trading volume of $7.06 billion in the last 24 hours. Technically, DOGE is priced at 0.3737, up 34.60% in the past week. Looking at the daily chart, although the 50 EMA (Blue Line) continues to stay above the 200 EMA (Black Line), the difference between the two averages is 44.18%, increasing the possibility of a pullback. This also shows us that the DOGE coin is bullish. If we look at the liquidity zone of DOGE, there is a liquidation place of approximately 215 million dollars at 0.4005 in the short position. When we look at the Chaikin Money Flow (CMF)20 indicator, money inflows started to decrease, albeit positive. Relative Strength Index (RSI)14 continues to remain in the overbought zone. This may bring profit sales. However, if the symmetrical triangle pattern works, a 66% rally may be seen. In case of possible negative developments in macroeconomic conditions and ecosystem and pullbacks, 0.33668 can be followed as a strong support. In case of a continuation of the rises, 0.42456 should be followed as a strong resistance.
Supports: 0.33668 – 0.28164 – 0.25025
Resistances: 0.37908 – 0.42456 – 0.50954
TRX/USDT
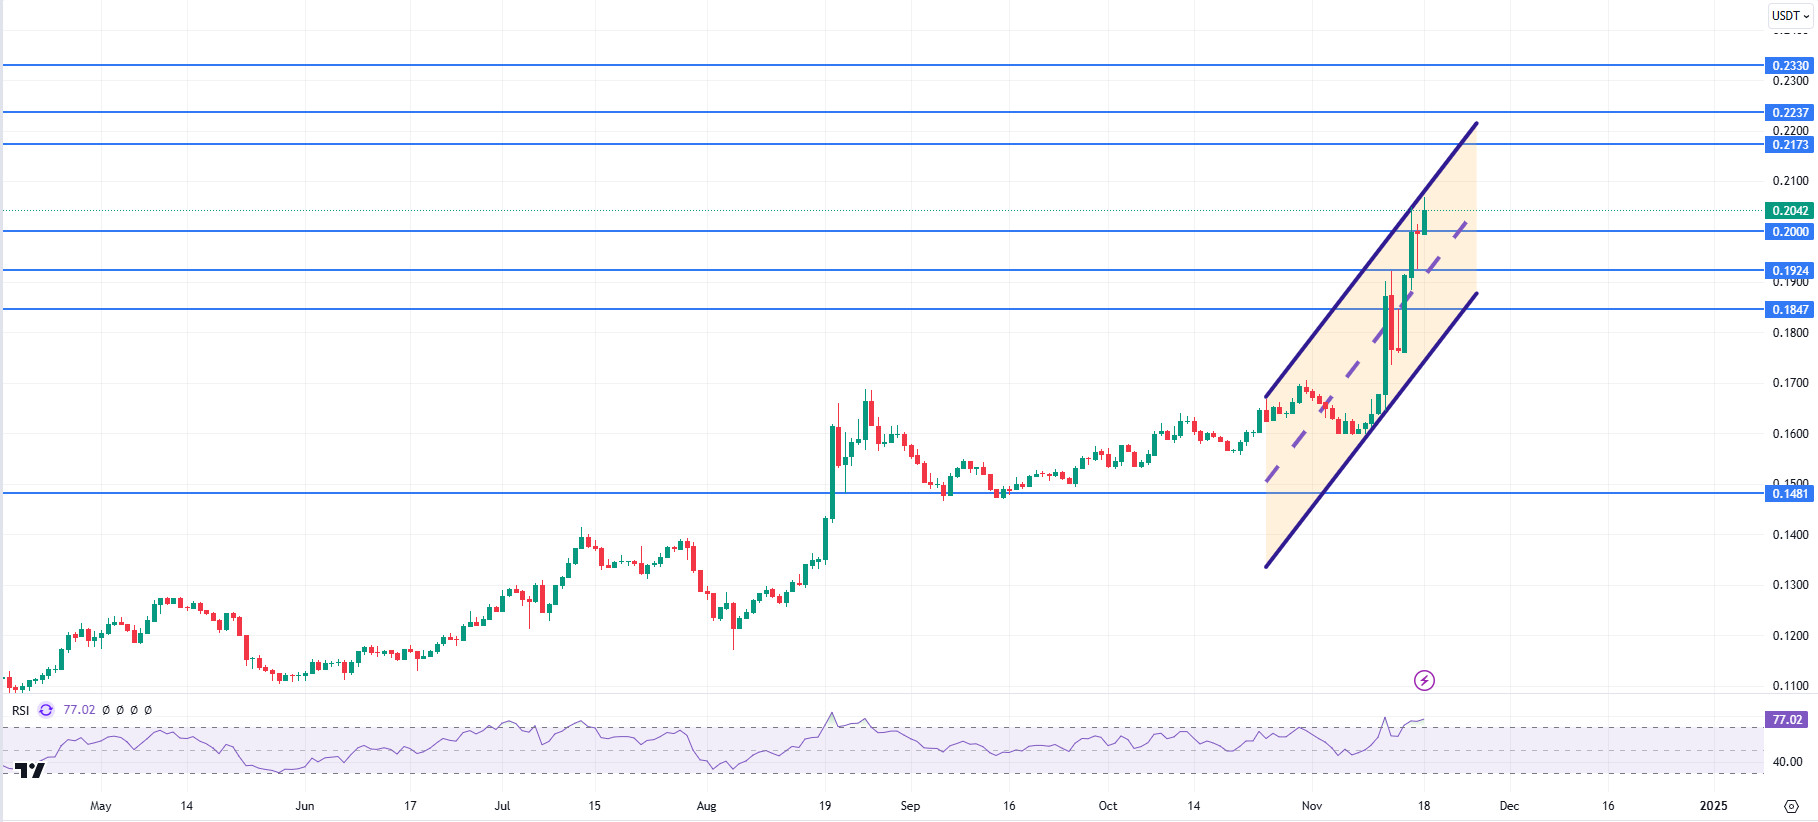
TRX, which started last week at 0.1640, rose by about 22% during the week and closed the week at 0.1996. This week, data on unemployment claims, services purchasing managers index and manufacturing purchasing managers index will be released in the US. These data are important to affect the market and data to be announced in line with expectations may have a positive impact.
TRX, which is currently trading at 0.2042 and moving within the bullish channel on the daily chart, is located in the upper band of the channel. Relative Strength Index is in the overbought zone with a value of 77 and can be expected to decline slightly from its current level and move to the middle band of the channel. In such a case, it may test the 0.1924 support. If it cannot break the 0.1924 support and rises with the next buying reaction, it may want to test the 0.2173 resistance. On the daily chart, the bullish demand may continue as long as it stays above 0.1481 support. If this support is broken, selling pressure may increase.
Supports: 0.2000 – 0.1924 – 0.1847
Resistances 0.2173 – 0.2237 – 0.2330
AVAX/USDT
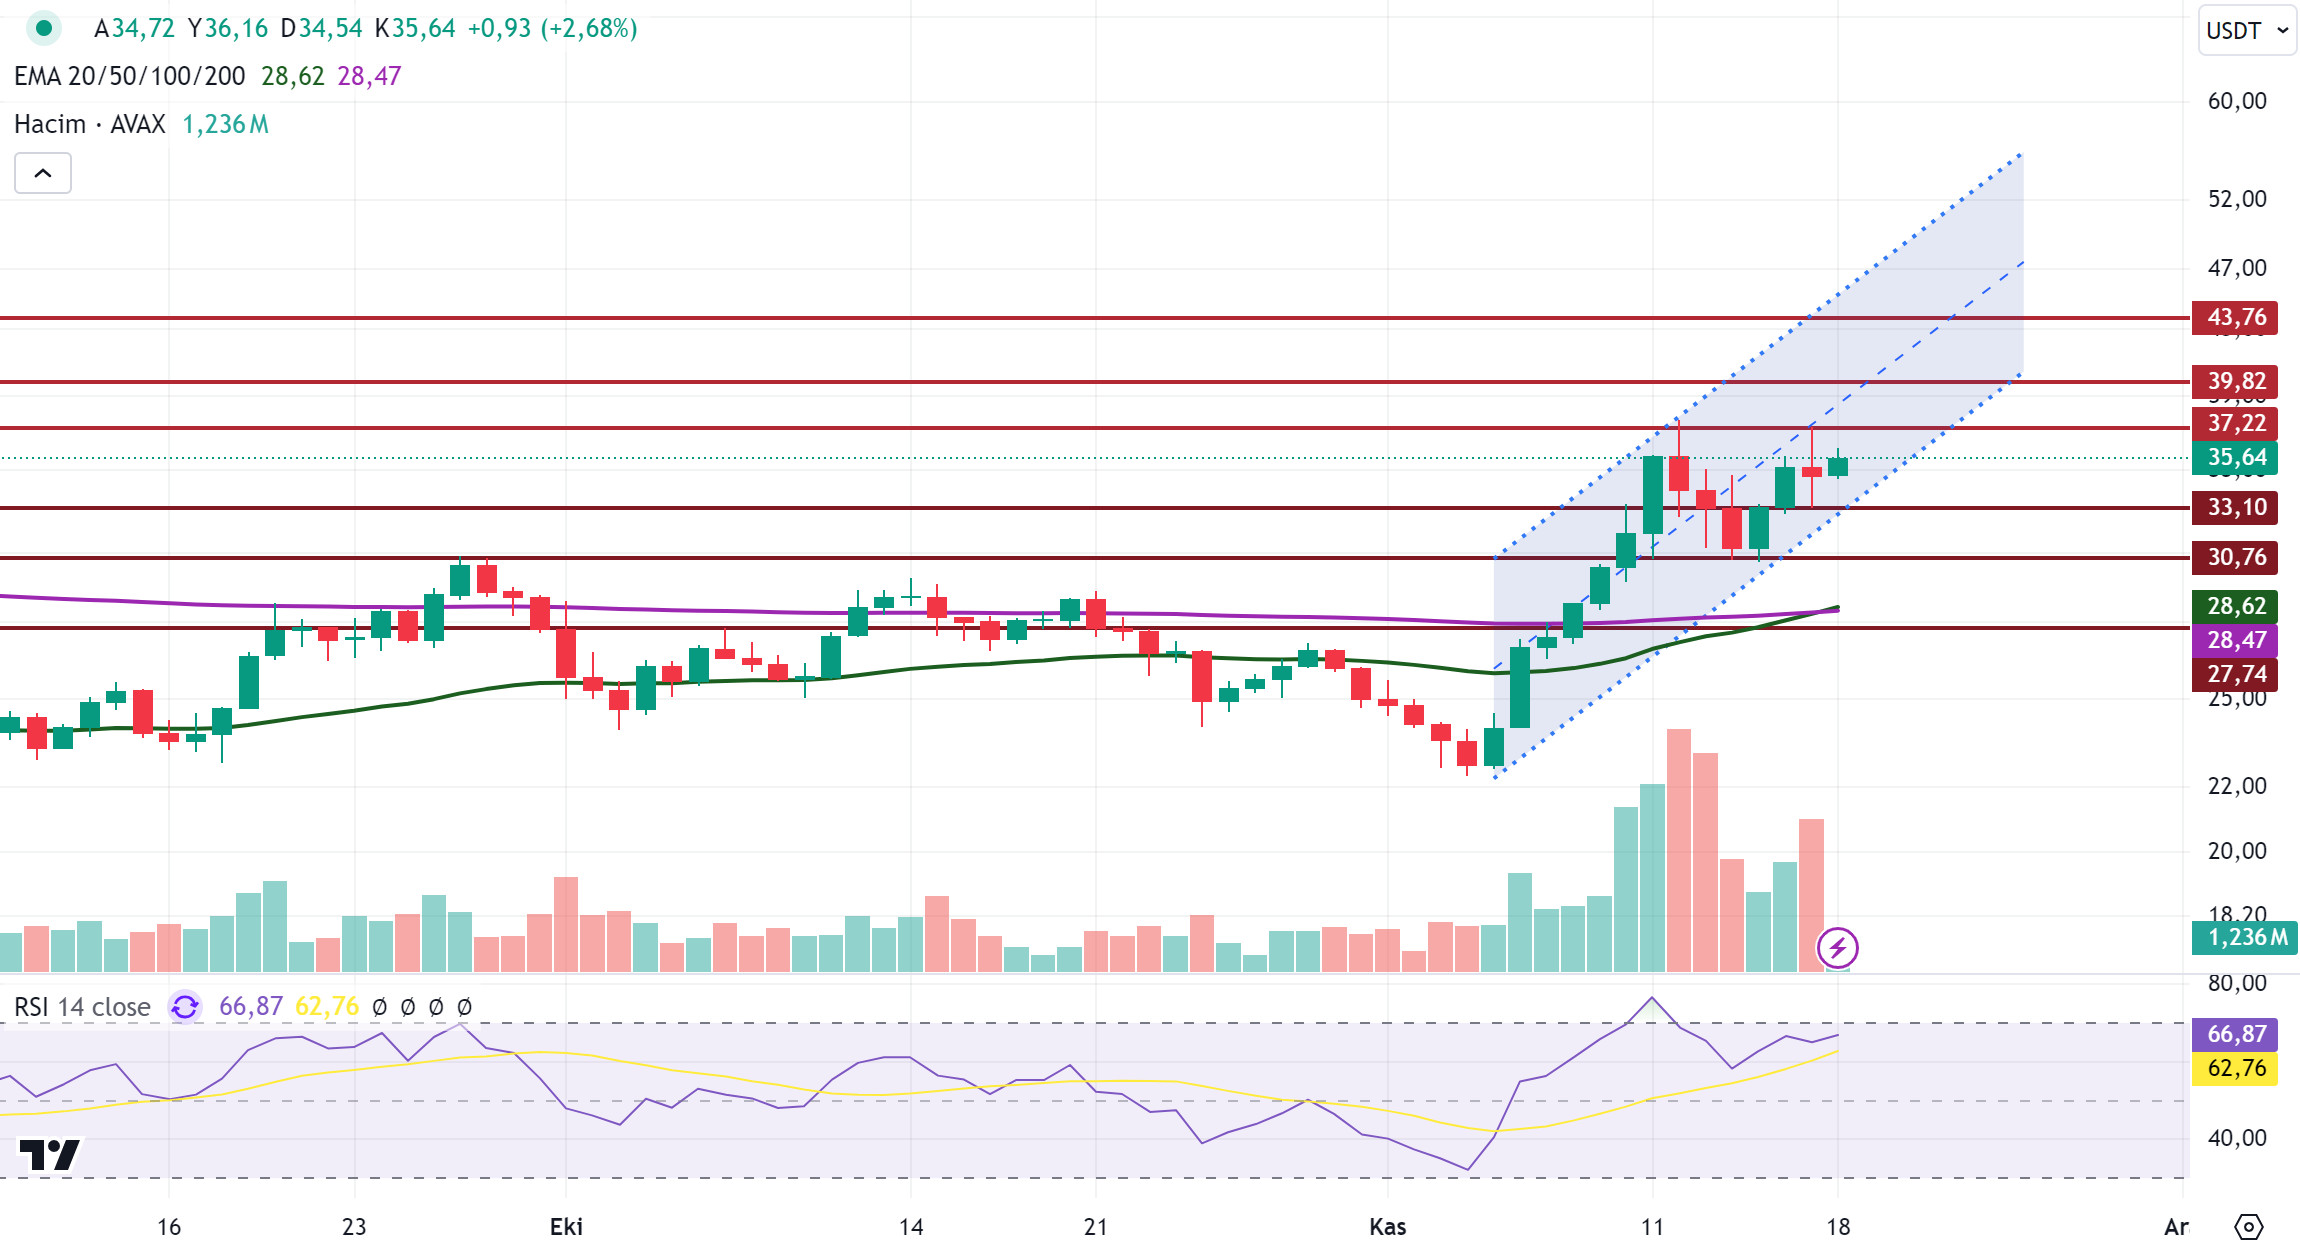
AVAX, which rose in parallel with the crypto market after the US elections, rose from $ 22 to $ 37.5, then fell in the middle of last week and fell to $ 30. AVAX, which started to rise again with the purchases on Friday and at the weekend, closed the week at 34.7. AVAX, which started the new week with a rise, is currently trading at 35.6. AVAX, which continues to be traded in the bullish channel, continues to be traded in the middle band of the channel with the purchases coming after the declines it experienced.
The Relative Strength Index (RSI) value for AVAX is around 66 and is not in the overbought zone, but it shows that buying pressure continues. If the RSI crosses 70 and is in overbought territory, we may see short-term corrections. Currently, the RSI is in neutral territory and AVAX is moving in line with the market. This increases the buying pressure on AVAX, which is also trading above the exponential moving average (EMA) levels. In the event that AVAX closes above the $ 37 level with its rise, high-volume purchases that may come in case of a daily close above the $ 40 level and above can be seen. The fact that the market is in an uptrend may strengthen AVAX’s rise. This week, a token unlocking worth approximately $ 58 million will take place in AVAX, which may cause a loss of value in AVAX. With the token unlocking, we can see levels of $ 33 and below in AVAX. It may also fall to $ 30 and below with panic sales in the sharp decline that may occur, but AVAX, which moves in parallel with the market, may come to the middle band of the bullish channel again after the decline.
Supports 33.10 – 30.76 – 27.74
Resistances 37.22 – 39.82 – 43.76
SHIB/USDT
Shytoshi Kusama, lead developer of Shiba Inu (SHIB), reacted to a media outlet’s analysis calling SHIB a “failure”. Kusama stated that Shiba Inu has been misrepresented for its innovative projects and long-term goals. She pointed out that with the support of the community, SHIB has transcended the perception of memecoin and transformed into a technology-oriented project. Planned initiatives such as the education campaign aim to change this perception. These discussions can increase SHIB’s community engagement and contribute to its long-term vision.
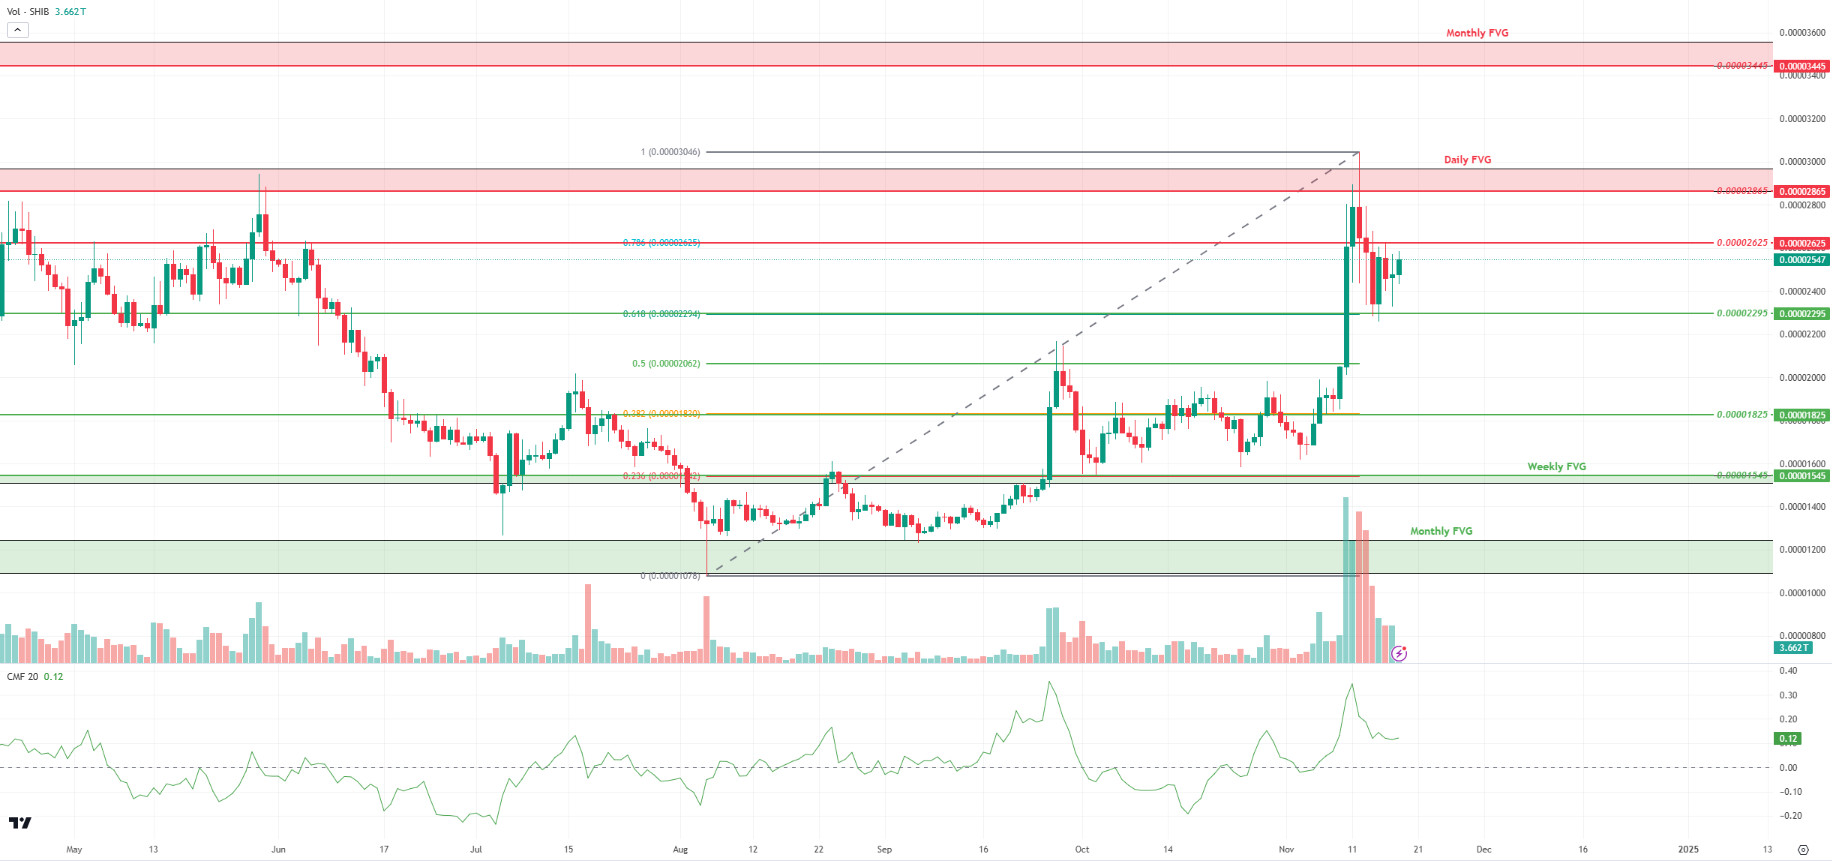
Technically, the price seems to have reacted from the Fibonacci 0.618 level at 0.00002295. The Chaikin Money Flow (CMF) oscillator shows that the selling pressure increased compared to the previous week. In case the price fails to break the 0.00002625 resistance level, a retracement towards the 0.00002295 level may occur. This level can be considered as a strong support. However, the loss of this level may lead to a decline down to 0.00001825, the Fibonacci 0.382 level. On the other hand, if the price breaks through the 0.00002625 level, a rise towards the daily Fair Value Gap (FVG) level of 0.00002865 can be expected.
Supports 0.00002295 – 0.00001825 – 0.00001545
Resistances 0.00002625 – 0.00002865 – 0.00003445
LEGAL NOTICE
The investment information, comments and recommendations contained in this document do not constitute investment advisory services. Investment advisory services are provided by authorized institutions on a personal basis, taking into account the risk and return preferences of individuals. The comments and recommendations contained in this document are of a general type. These recommendations may not be suitable for your financial situation and risk and return preferences. Therefore, making an investment decision based solely on the information contained in this document may not result in results that are in line with your expectations.


